Races in Seabrook, New Hampshire (NH) Detailed Stats
Ancestries, Foreign-born residents, place of birth

Recent posts about races in Seabrook, New Hampshire on our local forum with over 2,400,000 registered users:
 | Whole House Well Water Filtration (Arsenic) (17 replies) |
| Around 95 up to Portsmouth - Looking to buy a house in good school district 475k (11 replies) |
| Moving to southeast NH, looking for suggestions (22 replies) |
| Well NH, its been nice but (85 replies) |
| First visit to NH (28 replies) |
| Possible relocation to SE NH (9 replies) |
2.3% of Seabrook, NH residents are foreign-born (0.9% born in Europe, 0.9% born in North America, 0.3% born in Latin America, 0.2% born in Asia), which is 115.6% less than the foreign-born rate of 5.0% across the entire state of New Hampshire.
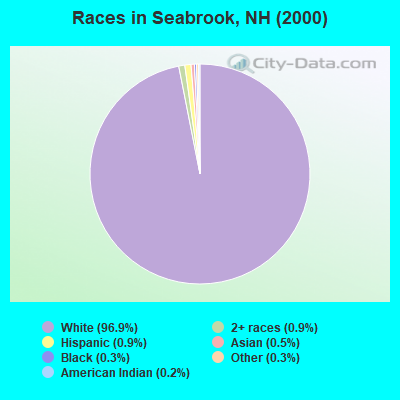
Race distribution in Seabrook

- 7,68596.9%White alone
- 680.9%Hispanic
- 720.9%Two or more races
- 430.5%Asian alone
- 270.3%Black alone
- 200.3%Other race alone
- 190.2%American Indian alone
2000
2022
-
- 1,175,25295.1%White alone
- 20,4891.7%Hispanic
- 15,8031.3%Asian alone
- 11,6060.9%Two or more races
- 8,3540.7%Black alone
- 2,6980.2%American Indian alone
- 1,2540.1%Other race alone
- 3300.03%Native Hawaiian and Other
Pacific Islander alone

-
- 1,208,10186.6%White alone
- 63,4794.5%Hispanic
- 60,7244.4%Two or more races
- 36,5192.6%Asian alone
- 17,9311.3%Black alone
- 6,6150.5%Other race alone
- 1,0140.07%American Indian alone
- 8480.06%Native Hawaiian and Other
Pacific Islander alone

Income and house value in Seabrook
- Median household income in 2022
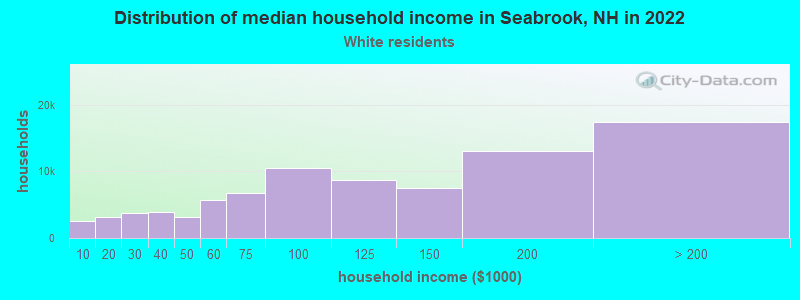
- $79,607White non-Hispanic householders
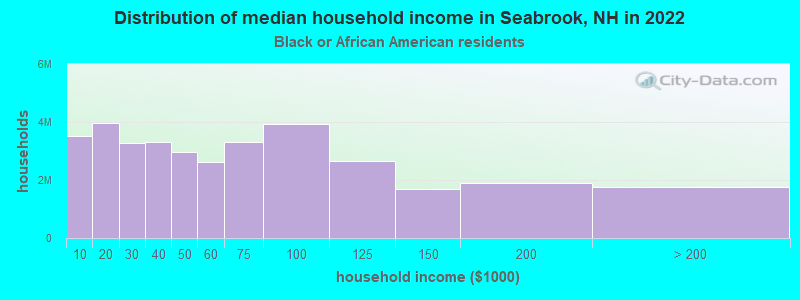
- $96,629Black householders
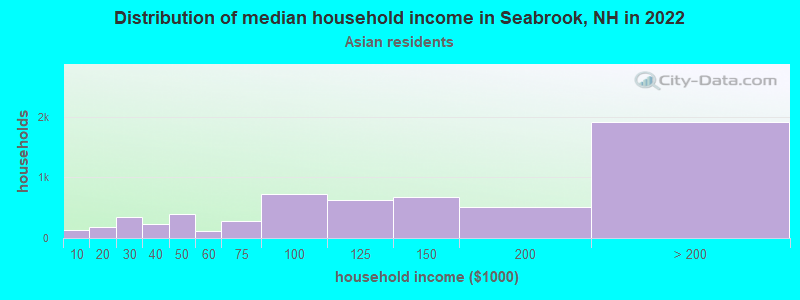
- $49,213Asian householders
- $55,398Some other race householders
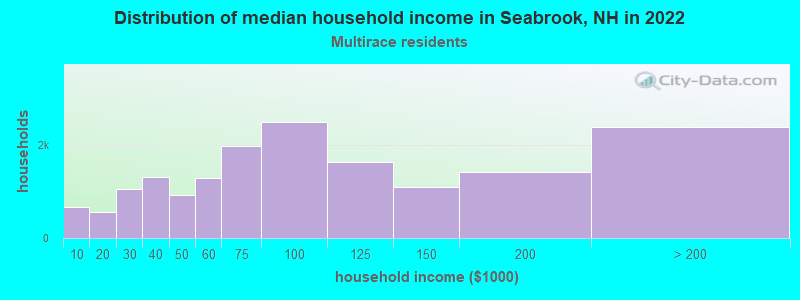
- $120,905Two or more races householders
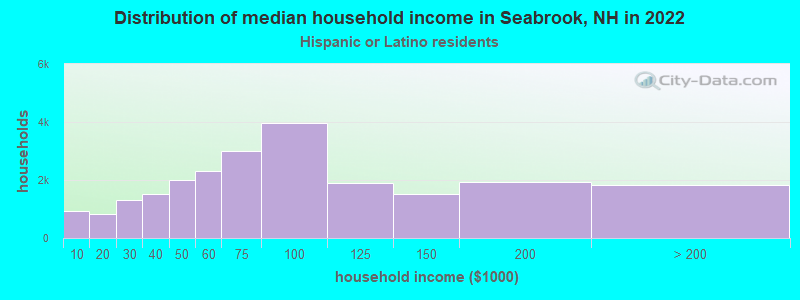
- $94,211Hispanic or Latino race householders
- Median 2022 house value
- $556,728White Non-Hispanic householders
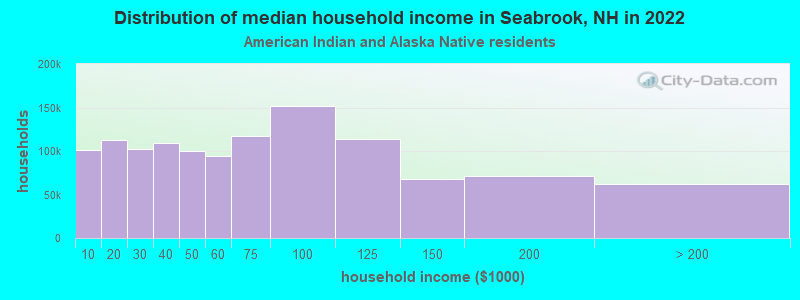
- $269,197American Indian or Alaska Native householders
- $687,507Some other race householders
- $372,476Two or more races householders
- $343,753Hispanic or Latino householders
Household income for White non-Hispanic householders
Household income for Black householders
Household income for American Indian and Alaska Native householders
Household income for Asian householders
Household income for Two or more races householders
Household income for Hispanic or Latino race householders
Foreign-born residents in Seabrook
184 residents are foreign born (0.9% Europe, 0.9% North America, 0.3% Latin America, 0.2% Asia).
| This city: | 2.3% |
| New Hampshire: | 4.4% |
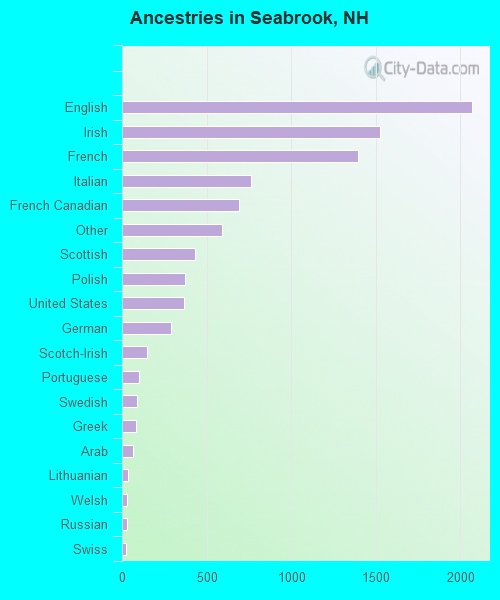
Ancestries in Seabrook

- 2,06822.5%English
- 1,52916.6%Irish
- 1,39915.2%French
- 7668.3%Italian
- 6927.5%French Canadian
- 5896.4%Other
- 4314.7%Scottish
- 3724.0%Polish
- 3684.0%United States
- 2913.2%German
- 1501.6%Scotch-Irish
- 1011.1%Portuguese
- 870.9%Swedish
- 840.9%Greek
- 630.7%Arab
- 360.4%Lithuanian
- 320.3%Welsh
- 270.3%Russian
- 260.3%Swiss
- 160.2%Dutch
- 150.2%Hungarian
- 140.2%Danish
- 140.2%Ukrainian
- 70.08%Czech
- 70.08%Norwegian
- 60.07%West Indian
Zip codes: 03874.