Races in Sebastian, Florida (FL) Detailed Stats
Data:
Races - White alone (%)
Races - White alone (% change since 2000)
Races - Black alone (%)
Races - Black alone (% change since 2000)
Races - American Indian alone (%)
Races - American Indian alone (% change since 2000)
Races - Asian alone (%)
Races - Asian alone (% change since 2000)
Races - Hispanic (%)
Races - Hispanic (% change since 2000)
Races - Native Hawaiian and Other Pacific Islander alone (%)
Races - Native Hawaiian and Other Pacific Islander alone (% change since 2000)
Races - Two or more races(%)
Races - Two or more races(% change since 2000)
Races - Other race alone (%)
Races - Other race alone (% change since 2000)
Racial diversity
Place of birth - Born in state of residence (%)
Place of birth - Born in state of residence (%) - White
Place of birth - Born in state of residence (%) - Black or African American
Place of birth - Born in state of residence (%) - Asian
Place of birth - Born in state of residence (%) - Hispanic or Latino
Place of birth - Born in state of residence (%) - American Indian and Alaska Native
Place of birth - Born in state of residence (%) - Multirace
Place of birth - Born in state of residence (%) - Other Race
Place of birth - Born in other state (%)
Place of birth - Born in other state (%) - White
Place of birth - Born in other state (%) - Black or African American
Place of birth - Born in other state (%) - Asian
Place of birth - Born in other state (%) - Hispanic or Latino
Place of birth - Born in other state (%) - American Indian and Alaska Native
Place of birth - Born in other state (%) - Multirace
Place of birth - Born in other state (%) - Other Race
Place of birth - Native, outside of US (%)
Place of birth - Native, outside of US (%) - White
Place of birth - Native, outside of US (%) - Black or African American
Place of birth - Native, outside of US (%) - Asian
Place of birth - Native, outside of US (%) - Hispanic or Latino
Place of birth - Native, outside of US (%) - American Indian and Alaska Native
Place of birth - Native, outside of US (%) - Multirace
Place of birth - Native, outside of US (%) - Other Race
Place of birth - Foreign born (%)
Place of birth - Foreign born (%) - White
Place of birth - Foreign born (%) - Black or African American
Place of birth - Foreign born (%) - Asian
Place of birth - Foreign born (%) - Hispanic or Latino
Place of birth - Foreign born (%) - American Indian and Alaska Native
Place of birth - Foreign born (%) - Multirace
Place of birth - Foreign born (%) - Other Race
Residents speaking English at home (%)
Residents speaking English at home - Born in the United States (%)
Residents speaking English at home - Native, born elsewhere (%)
Residents speaking English at home - Foreign born (%)
Residents speaking Spanish at home (%)
Residents speaking Spanish at home - Born in the United States (%)
Residents speaking Spanish at home - Native, born elsewhere (%)
Residents speaking Spanish at home - Foreign born (%)
Residents speaking other language at home (%)
Residents speaking other language at home - Born in the United States (%)
Residents speaking other language at home - Native, born elsewhere (%)
Residents speaking other language at home - Foreign born (%)
Marital status - Never married (%)
Marital status - Now married (%)
Marital status - Separated (%)
Marital status - Widowed (%)
Marital status - Divorced (%)
Ancestries Reported - Arab (%)
Ancestries Reported - Czech (%)
Ancestries Reported - Danish (%)
Ancestries Reported - Dutch (%)
Ancestries Reported - English (%)
Ancestries Reported - French (%)
Ancestries Reported - French Canadian (%)
Ancestries Reported - German (%)
Ancestries Reported - Greek (%)
Ancestries Reported - Hungarian (%)
Ancestries Reported - Irish (%)
Ancestries Reported - Italian (%)
Ancestries Reported - Lithuanian (%)
Ancestries Reported - Norwegian (%)
Ancestries Reported - Polish (%)
Ancestries Reported - Portuguese (%)
Ancestries Reported - Russian (%)
Ancestries Reported - Scotch-Irish (%)
Ancestries Reported - Scottish (%)
Ancestries Reported - Slovak (%)
Ancestries Reported - Subsaharan African (%)
Ancestries Reported - Swedish (%)
Ancestries Reported - Swiss (%)
Ancestries Reported - Ukrainian (%)
Ancestries Reported - United States (%)
Ancestries Reported - Welsh (%)
Ancestries Reported - West Indian (%)
Ancestries Reported - Other (%)
Geographical mobility - Same house 1 year ago (%)
Geographical mobility - Same house 1 year ago (%) - White
Geographical mobility - Same house 1 year ago (%) - Black or African American
Geographical mobility - Same house 1 year ago (%) - Asian
Geographical mobility - Same house 1 year ago (%) - Hispanic or Latino
Geographical mobility - Same house 1 year ago (%) - American Indian and Alaska Native
Geographical mobility - Same house 1 year ago (%) - Multirace
Geographical mobility - Same house 1 year ago (%) - Other Race
Geographical mobility - Moved within same county (%)
Geographical mobility - Moved within same county (%) - White
Geographical mobility - Moved within same county (%) - Black or African American
Geographical mobility - Moved within same county (%) - Asian
Geographical mobility - Moved within same county (%) - Hispanic or Latino
Geographical mobility - Moved within same county (%) - American Indian and Alaska Native
Geographical mobility - Moved within same county (%) - Multirace
Geographical mobility - Moved within same county (%) - Other Race
Geographical mobility - Moved from different county within same state (%)
Geographical mobility - Moved from different county within same state (%) - White
Geographical mobility - Moved from different county within same state (%) - Black or African American
Geographical mobility - Moved from different county within same state (%) - Asian
Geographical mobility - Moved from different county within same state (%) - Hispanic or Latino
Geographical mobility - Moved from different county within same state (%) - American Indian and Alaska Native
Geographical mobility - Moved from different county within same state (%) - Multirace
Geographical mobility - Moved from different county within same state (%) - Other Race
Geographical mobility - Moved from different state (%)
Geographical mobility - Moved from different state (%) - White
Geographical mobility - Moved from different state (%) - Black or African American
Geographical mobility - Moved from different state (%) - Asian
Geographical mobility - Moved from different state (%) - Hispanic or Latino
Geographical mobility - Moved from different state (%) - American Indian and Alaska Native
Geographical mobility - Moved from different state (%) - Multirace
Geographical mobility - Moved from different state (%) - Other Race
Geographical mobility - Moved from abroad (%)
Geographical mobility - Moved from abroad (%) - White
Geographical mobility - Moved from abroad (%) - Black or African American
Geographical mobility - Moved from abroad (%) - Asian
Geographical mobility - Moved from abroad (%) - Hispanic or Latino
Geographical mobility - Moved from abroad (%) - American Indian and Alaska Native
Geographical mobility - Moved from abroad (%) - Multirace
Geographical mobility - Moved from abroad (%) - Other Race
Place of birth for the foreign-born population - Ireland (%)
Place of birth for the foreign-born population - Denmark (%)
Place of birth for the foreign-born population - Norway (%)
Place of birth for the foreign-born population - Sweden (%)
Place of birth for the foreign-born population - United Kingdom (%)
Place of birth for the foreign-born population - England (%)
Place of birth for the foreign-born population - Scotland (%)
Place of birth for the foreign-born population - Other Northern Europe (%)
Place of birth for the foreign-born population - Austria (%)
Place of birth for the foreign-born population - Belgium (%)
Place of birth for the foreign-born population - France (%)
Place of birth for the foreign-born population - Germany (%)
Place of birth for the foreign-born population - Netherlands (%)
Place of birth for the foreign-born population - Switzerland (%)
Place of birth for the foreign-born population - Other Western Europe (%)
Place of birth for the foreign-born population - Greece (%)
Place of birth for the foreign-born population - Italy (%)
Place of birth for the foreign-born population - Portugal (%)
Place of birth for the foreign-born population - Spain (%)
Place of birth for the foreign-born population - Other Southern Europe (%)
Place of birth for the foreign-born population - Albania (%)
Place of birth for the foreign-born population - Belarus (%)
Place of birth for the foreign-born population - Bosnia and Herzegovina (%)
Place of birth for the foreign-born population - Bulgaria (%)
Place of birth for the foreign-born population - Croatia (%)
Place of birth for the foreign-born population - Czechoslovakia (%)
Place of birth for the foreign-born population - Hungary (%)
Place of birth for the foreign-born population - Latvia (%)
Place of birth for the foreign-born population - Lithuania (%)
Place of birth for the foreign-born population - North Macedonia (Macedonia) (%)
Place of birth for the foreign-born population - Moldova (%)
Place of birth for the foreign-born population - Poland (%)
Place of birth for the foreign-born population - Romania (%)
Place of birth for the foreign-born population - Russia (%)
Place of birth for the foreign-born population - Serbia (%)
Place of birth for the foreign-born population - Ukraine (%)
Place of birth for the foreign-born population - Other Eastern Europe (%)
Place of birth for the foreign-born population - China (%)
Place of birth for the foreign-born population - Hong Kong (%)
Place of birth for the foreign-born population - Taiwan (%)
Place of birth for the foreign-born population - Japan (%)
Place of birth for the foreign-born population - Korea (%)
Place of birth for the foreign-born population - Other Eastern Asia (%)
Place of birth for the foreign-born population - Afghanistan (%)
Place of birth for the foreign-born population - Bangladesh (%)
Place of birth for the foreign-born population - India (%)
Place of birth for the foreign-born population - Iran (%)
Place of birth for the foreign-born population - Kazakhstan (%)
Place of birth for the foreign-born population - Nepal (%)
Place of birth for the foreign-born population - Pakistan (%)
Place of birth for the foreign-born population - Sri Lanka (%)
Place of birth for the foreign-born population - Uzbekistan (%)
Place of birth for the foreign-born population - Other South Central Asia (%)
Place of birth for the foreign-born population - Burma (%)
Place of birth for the foreign-born population - Cambodia (%)
Place of birth for the foreign-born population - Indonesia (%)
Place of birth for the foreign-born population - Laos (%)
Place of birth for the foreign-born population - Malaysia (%)
Place of birth for the foreign-born population - Philippines (%)
Place of birth for the foreign-born population - Singapore (%)
Place of birth for the foreign-born population - Thailand (%)
Place of birth for the foreign-born population - Vietnam (%)
Place of birth for the foreign-born population - Other South Eastern Asia (%)
Place of birth for the foreign-born population - Armenia (%)
Place of birth for the foreign-born population - Iraq (%)
Place of birth for the foreign-born population - Israel (%)
Place of birth for the foreign-born population - Jordan (%)
Place of birth for the foreign-born population - Kuwait (%)
Place of birth for the foreign-born population - Lebanon (%)
Place of birth for the foreign-born population - Saudi Arabia (%)
Place of birth for the foreign-born population - Syria (%)
Place of birth for the foreign-born population - Turkey (%)
Place of birth for the foreign-born population - Yemen (%)
Place of birth for the foreign-born population - Other Western Asia (%)
Place of birth for the foreign-born population - Eritrea (%)
Place of birth for the foreign-born population - Ethiopia (%)
Place of birth for the foreign-born population - Kenya (%)
Place of birth for the foreign-born population - Somalia (%)
Place of birth for the foreign-born population - Uganda (%)
Place of birth for the foreign-born population - Zimbabwe (%)
Place of birth for the foreign-born population - Other Eastern Africa (%)
Place of birth for the foreign-born population - Cameroon (%)
Place of birth for the foreign-born population - Congo (%)
Place of birth for the foreign-born population - Democratic Republic of Congo (Zaire) (%)
Place of birth for the foreign-born population - Other Middle Africa (%)
Place of birth for the foreign-born population - Egypt (%)
Place of birth for the foreign-born population - Morocco (%)
Place of birth for the foreign-born population - Sudan (%)
Place of birth for the foreign-born population - Other Northern Africa (%)
Place of birth for the foreign-born population - South Africa (%)
Place of birth for the foreign-born population - Other Southern Africa (%)
Place of birth for the foreign-born population - Cabo Verde (%)
Place of birth for the foreign-born population - Ghana (%)
Place of birth for the foreign-born population - Liberia (%)
Place of birth for the foreign-born population - Nigeria (%)
Place of birth for the foreign-born population - Senegal (%)
Place of birth for the foreign-born population - Sierra Leone (%)
Place of birth for the foreign-born population - Other Western Africa (%)
Place of birth for the foreign-born population - Australia (%)
Place of birth for the foreign-born population - New Zealand (%)
Place of birth for the foreign-born population - Fiji (%)
Place of birth for the foreign-born population - Micronesia (%)
Place of birth for the foreign-born population - Bahamas (%)
Place of birth for the foreign-born population - Barbados (%)
Place of birth for the foreign-born population - Cuba (%)
Place of birth for the foreign-born population - Dominica (%)
Place of birth for the foreign-born population - Dominican Republic (%)
Place of birth for the foreign-born population - Grenada (%)
Place of birth for the foreign-born population - Haiti (%)
Place of birth for the foreign-born population - Jamaica (%)
Place of birth for the foreign-born population - St. Vincent and the Grenadines (%)
Place of birth for the foreign-born population - Trinidad and Tobago (%)
Place of birth for the foreign-born population - West Indies (%)
Place of birth for the foreign-born population - Other Caribbean (%)
Place of birth for the foreign-born population - Belize (%)
Place of birth for the foreign-born population - Costa Rica (%)
Place of birth for the foreign-born population - El Salvador (%)
Place of birth for the foreign-born population - Guatemala (%)
Place of birth for the foreign-born population - Honduras (%)
Place of birth for the foreign-born population - Mexico (%)
Place of birth for the foreign-born population - Nicaragua (%)
Place of birth for the foreign-born population - Panama (%)
Place of birth for the foreign-born population - Other Central America (%)
Place of birth for the foreign-born population - Argentina (%)
Place of birth for the foreign-born population - Bolivia (%)
Place of birth for the foreign-born population - Brazil (%)
Place of birth for the foreign-born population - Chile (%)
Place of birth for the foreign-born population - Colombia (%)
Place of birth for the foreign-born population - Ecuador (%)
Place of birth for the foreign-born population - Guyana (%)
Place of birth for the foreign-born population - Peru (%)
Place of birth for the foreign-born population - Uruguay (%)
Place of birth for the foreign-born population - Venezuela (%)
Place of birth for the foreign-born population - Other South America (%)
Place of birth for the foreign-born population - Canada (%)
Place of birth for the foreign-born population - Other Northern America (%)
Place of birth for the foreign-born population - Other (%)
Latest news about races in Sebastian, FL collected exclusively by city-data.com from local newspapers, TV, and radio stations
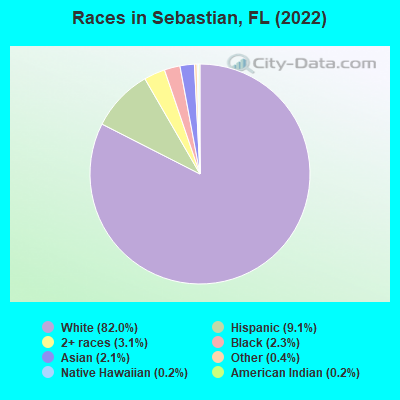
According to 2022 data, the most numerous races in Sebastian, FL are White alone (21,540 residents), Hispanic (2,398 residents), and Black alone (612 residents). 88.3% of Sebastian residents speak English at home. 7.7% of Sebastian, FL residents are foreign-born (3.1% born in Latin America, 2.6% born in Europe, 1.3% born in Asia), which is 171.2% less than the foreign-born rate of 21.0% across the entire state of Florida.
Race distribution in Sebastian
2000 2022
10,458,509 65.4% White alone 2,682,715 16.8% Hispanic 2,264,268 14.2% Black alone 261,693 1.6% Asian alone 236,954 1.5% Two or more races 42,358 0.3% American Indian alone 28,994 0.2% Other race alone 6,887 0.04% Native Hawaiian and Other
11,309,403 50.8% White alone 6,025,039 27.1% Hispanic 3,241,015 14.6% Black alone 861,630 3.9% Two or more races 623,692 2.8% Asian alone 152,054 0.7% Other race alone 22,504 0.1% American Indian alone 9,486 0.04% Native Hawaiian and Other
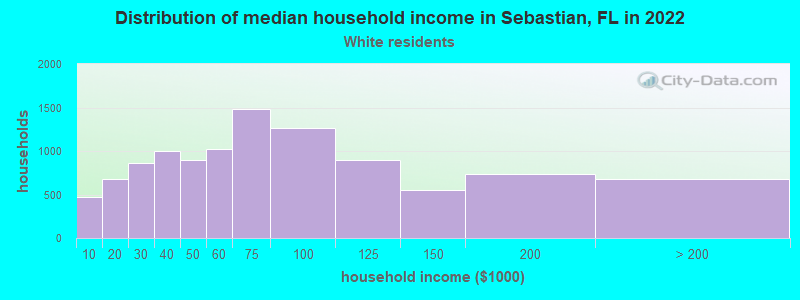
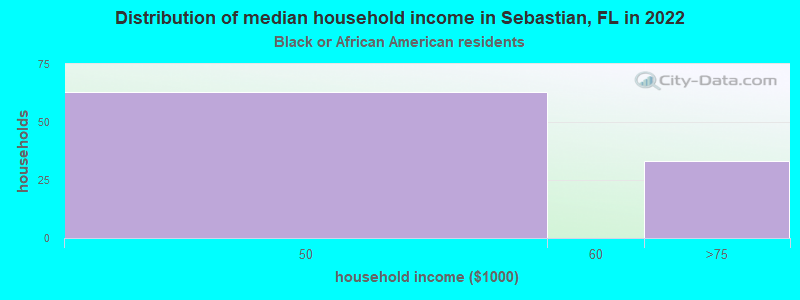
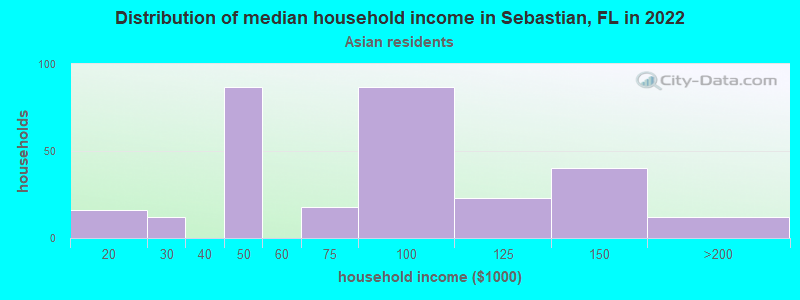
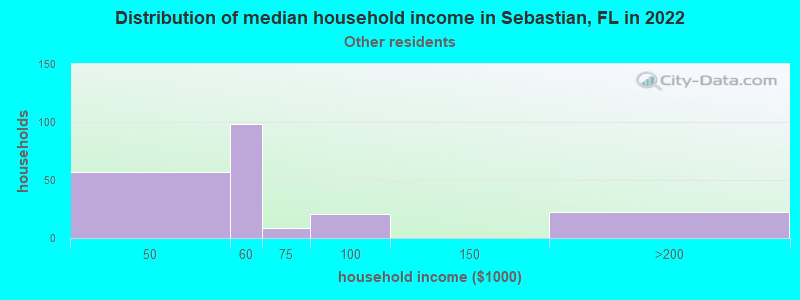
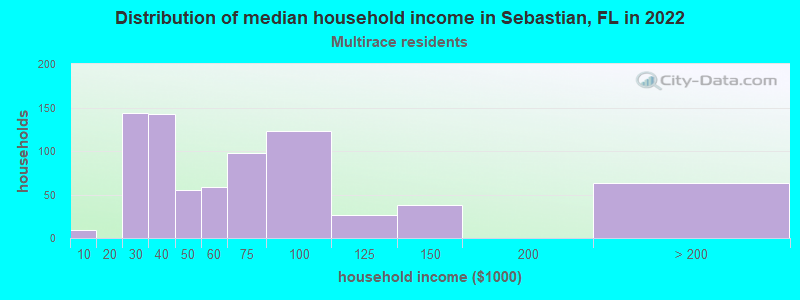
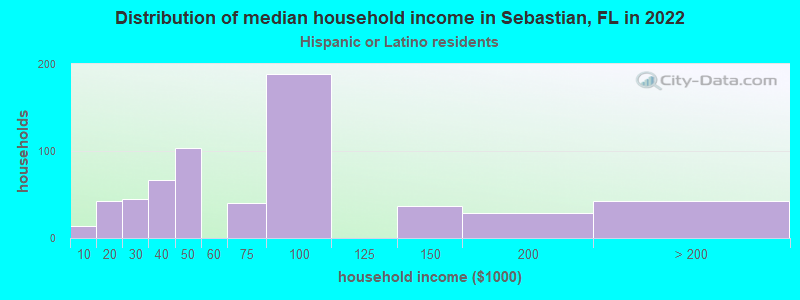
Income and house value in Sebastian Median household income in 2022 $65,206 White non-Hispanic householders$45,974 Black householders$85,266 Asian householders$71,474 Some other race householders$56,721 Two or more races householdersMedian 2022 house value $319,380 White Non-Hispanic householders$327,178 Black or African American householdersover $1,000,000 American Indian or Alaska Native householders $302,767 Asian householders$203,427 Two or more races householders$313,955 Hispanic or Latino householders
Median age by race in Sebastian
61.3 Median age for White residents60.7 62.8 39.1 Median age for Black or African American residents14.8 50.8 -598,566,307.6 Median age for American Indian / Alaska Native residents-611,418,047.3 -594,925,633.7 43.6 Median age for Asian residents44.7 44.7 -666,666,666.0 Median age for Native Hawaiian / Pacific Islander residents-666,666,666.0 -666,666,666.0 61.0 Median age for Other race residents60.3 60.3 35.6 Median age for Two or more races residents32.1 36.6 61.1 Median age for White alone residents59.6 63.1 37.9 Median age for Hispanic or Latino residents31.4 39.7
Owner/renter occupied households by race in Sebastian
House owners and renters - White residents 9,091 84.6% Owner occupied1,659 15.4% Renter occupiedHouse owners and renters - Black or African American residents 84 81.1% Owner occupied19 18.9% Renter occupiedHouse owners and renters - Asian residents 303 100.0% Owner occupiedHouse owners and renters - Other race residents 218 90.7% Owner occupied22 9.3% Renter occupiedHouse owners and renters - Two or more races residents 407 65.0% Owner occupied219 35.0% Renter occupiedHouse owners and renters - White alone residents 8,942 84.6% Owner occupied1,626 15.4% Renter occupiedHouse owners and renters - Hispanic or Latino residents 525 82.9% Owner occupied109 17.1% Renter occupied
Language usage in Sebastian
English speakers - Total 88.3% of residents of Sebastian speak English at home.
6.7% of residents speak Spanish at home 1,025 59.0% Speak English very well712 41.0% Speak English less than very well4.5% of residents speak other language at home 735 63.3% Speak English very well426 36.7% Speak English less than very well
English speakers - Born in the United States 96.7% of residents of Sebastian speak English at home.
2.8% of residents speak Spanish at home 283 58.5% Speak English very well201 41.5% Speak English less than very well1.1% of residents speak other language at home 128 70.7% Speak English very well53 29.3% Speak English less than very well
English speakers - Native, born elsewhere 93.4% of residents of Sebastian speak English at home.
23.0% of residents speak Spanish at home 115 100.0% Speak English very well3.6% of residents speak other language at home 18 100.0% Speak English less than very well
English speakers - Foreign-born 37.7% of residents of Sebastian speak English at home.
29.6% of residents speak Spanish at home 201 27.6% Speak English very well526 72.4% Speak English less than very well30.2% of residents speak other language at home 440 59.1% Speak English very well304 40.9% Speak English less than very well
White (Caucasian) - Speak only English Native:
98.6% (19,881)Foreign-born:
65.9% (648)
White (Caucasian) - Speak another language Native:
1.6% (325)Foreign-born:
40.9% (402)
Asian - Speak only English Native:
50.8% (106)Foreign-born:
23.4% (57)
Asian - Speak another language Native:
48.8% (102)Foreign-born:
76.5% (185)
Other race - Speak only English Native:
75.3% (198)Foreign-born:
39.4% (90)
Other race - Speak another language Native:
13.8% (36)Foreign-born:
68.1% (155)
Two or more races - Speak only English Native:
52.5% (1,024)Foreign-born:
9.0% (67)
Two or more races - Speak another language Native:
45.8% (893)Foreign-born:
91.0% (677)
White alone - Speak only English Native:
98.4% (19,728)Foreign-born:
66.5% (632)
White alone - Speak another language Native:
1.6% (313)Foreign-born:
34.0% (322)
Hispanic or Latino - Speak only English Native:
45.1% (650)Foreign-born:
17.3% (155)
Hispanic or Latino - Speak another language Native:
54.3% (782)Foreign-born:
80.9% (723)
Foreign-born residents in Sebastian 2,034 residents are foreign born (3.1% Latin America , 2.6% Europe , 1.3% Asia ).
This city:
7.7%Florida:
21.1%
Marital status for residents in Sebastian Marital status - White (Caucasian) population 15 years and over
Males 21.8% Never married59.1% Now married0.7% Separated4.1% Widowed14.4% DivorcedFemales 13.5% Never married57.0% Now married1.2% Separated16.2% Widowed12.1% DivorcedWomen who gave birth in the past 12 months Now married:
100.0% (72)Unmarried:
0.0% (0)
Women who did not give birth in the past 12 months Now married:
54.3% (1,468)Unmarried:
45.7% (1,235)
Marital status - Black or African American population 15 years and over
Males 90.5% Never married9.5% Now married0.0% Separated0.0% Widowed0.0% DivorcedFemales 18.8% Never married38.2% Now married0.0% Separated0.0% Widowed42.9% DivorcedWomen who did not give birth in the past 12 months Now married:
76.1% (50)Unmarried:
23.9% (16)
Marital status - Asian population 15 years and over
Males 44.7% Never married55.3% Now married0.0% Separated0.0% Widowed0.0% DivorcedFemales 34.7% Never married59.2% Now married6.1% Separated0.0% Widowed0.0% DivorcedWomen who did not give birth in the past 12 months Now married:
46.8% (67)Unmarried:
53.2% (77)
Marital status - Other race population 15 years and over
Males 29.9% Never married62.7% Now married0.0% Separated0.0% Widowed7.4% DivorcedFemales 33.0% Never married67.0% Now married0.0% Separated0.0% Widowed0.0% DivorcedWomen who did not give birth in the past 12 months Now married:
54.1% (57)Unmarried:
45.9% (49)
Marital status - Two or more races population 15 years and over
Males 18.0% Never married81.9% Now married0.1% Separated0.0% Widowed0.0% DivorcedFemales 25.7% Never married45.6% Now married0.0% Separated0.0% Widowed28.6% DivorcedWomen who gave birth in the past 12 months Now married:
100.0% (36)Unmarried:
0.0% (0)
Women who did not give birth in the past 12 months Now married:
28.1% (161)Unmarried:
71.9% (413)
Marital status - White alone, not Hispanic / Latino population 15 years and over
Males 21.8% Never married59.1% Now married0.7% Separated4.3% Widowed14.1% DivorcedFemales 12.9% Never married57.7% Now married1.1% Separated16.4% Widowed11.9% DivorcedWomen who gave birth in the past 12 months Now married:
100.0% (65)Unmarried:
0.0% (0)
Women who did not give birth in the past 12 months Now married:
55.7% (1,429)Unmarried:
44.3% (1,135)
Marital status - Hispanic or Latino population 15 years and over
Males 20.6% Never married70.7% Now married0.0% Separated0.0% Widowed8.7% DivorcedFemales 30.9% Never married44.0% Now married2.2% Separated2.0% Widowed21.0% DivorcedWomen who gave birth in the past 12 months Now married:
100.0% (34)Unmarried:
0.0% (0)
Women who did not give birth in the past 12 months Now married:
26.6% (113)Unmarried:
73.4% (312)
Ancestries in Sebastian
2,147 17.3% English1,730 14.0% German1,497 12.1% Irish1,206 9.7% Italian978 7.9% American553 4.5% Polish358 2.9% European332 2.7% Scottish272 2.2% Scotch-Irish271 2.2% French235 1.9% French Canadian101 0.8% Greek100 0.8% Brazilian88 0.7% Ukrainian75 0.6% Lithuanian69 0.6% Canadian69 0.6% Hungarian67 0.5% British64 0.5% Estonian54 0.4% Swedish53 0.4% Norwegian51 0.4% Portuguese49 0.4% Czech49 0.4% Dutch49 0.4% Jamaican44 0.4% Russian31 0.3% Welsh29 0.2% Arab21 0.2% Austrian20 0.2% Armenian18 0.1% Celtic18 0.1% Assyrian18 0.1% Danish15 0.1% Swiss14 0.1% Eastern European14 0.1% Slovak12 0.10% Maltese12 0.10% Slavic11 0.09% Czechoslovakian9 0.07% Finnish7 0.06% Northern European5 0.04% Albanian
Geographical mobility in Sebastian Same house 1 year ago 18,783 87.7% White (Caucasian)371 64.2% Black or African American46 100.0% American Indian / Alaska Native457 100.0% Asian46 100.0% Native Hawaiian / Pacific Islander574 86.6% Other race2,443 84.0% Two or more races18,806 87.9% White alone, not Hispanic / Latino2,132 89.1% Hispanic or LatinoMoved within same county 753 3.5% White / Caucasian43 7.4% Black or African American231 7.9% Two or more races723 3.4% White alone, not Hispanic / Latino31 1.3% Hispanic or LatinoMoved within same state 1,016 4.7% White / Caucasian86 13.0% Other race185 6.4% Two or more races997 4.7% White alone, not Hispanic / Latino282 11.8% Hispanic or LatinoMoved from different state 828 3.9% White / Caucasian154 26.7% Black or African American115 4.0% Two or more races824 3.8% White alone, not Hispanic / LatinoMoved from abroad 58 0.3% White62 0.3% White alone, not Hispanic / Latino
Children Nativity (place of birth) in Sebastian
Children under 6 years - Living with two parents Both parents native 566 100.0% NativeBoth parents foreign-born 21 100.0% NativeOne native, one foreign-born parent 19 100.0% NativeChildren under 6 years - Living with one parent Native parent 229 100.0% NativeChildren 6 to 17 years - Living with two parents Both parents native 832 100.0% NativeBoth parents foreign-born 74 53.9% Native63 46.1% Foreign-bornOne native, one foreign-born parent 68 100.0% NativeChildren 6 to 17 years - Living with one parent Native parent 1,002 100.0% NativeForeign-born parent 118 44.4% Native147 55.6% Foreign-born
Grandparents responsible for own grandchildren in Sebastian
Grandparents (30 to 59 years) White / Caucasian 24 12.2% Responsible for grandchildren175 87.8% Not responsible for grandchildrenBlack or African American 53 100.0% Not responsible for grandchildrenTwo or more races 125 100.0% Not responsible for grandchildrenWhite alone, not Hispanic / Latino 40 18.6% Responsible for grandchildren175 81.4% Not responsible for grandchildrenHispanic or Latino 72 100.0% Not responsible for grandchildrenGrandparents (60 years and over) White / Caucasian 43 44.6% Responsible for grandchildren54 55.4% Not responsible for grandchildrenWhite alone, not Hispanic / Latino 47 51.8% Responsible for grandchildren44 48.2% Not responsible for grandchildrenHispanic or Latino 10 100.0% Not responsible for grandchildren