Races in Sebring, Florida (FL) Detailed Stats
Data:
Races - White alone (%)
Races - White alone (% change since 2000)
Races - Black alone (%)
Races - Black alone (% change since 2000)
Races - American Indian alone (%)
Races - American Indian alone (% change since 2000)
Races - Asian alone (%)
Races - Asian alone (% change since 2000)
Races - Hispanic (%)
Races - Hispanic (% change since 2000)
Races - Native Hawaiian and Other Pacific Islander alone (%)
Races - Native Hawaiian and Other Pacific Islander alone (% change since 2000)
Races - Two or more races(%)
Races - Two or more races(% change since 2000)
Races - Other race alone (%)
Races - Other race alone (% change since 2000)
Racial diversity
Place of birth - Born in state of residence (%)
Place of birth - Born in state of residence (%) - White
Place of birth - Born in state of residence (%) - Black or African American
Place of birth - Born in state of residence (%) - Asian
Place of birth - Born in state of residence (%) - Hispanic or Latino
Place of birth - Born in state of residence (%) - American Indian and Alaska Native
Place of birth - Born in state of residence (%) - Multirace
Place of birth - Born in state of residence (%) - Other Race
Place of birth - Born in other state (%)
Place of birth - Born in other state (%) - White
Place of birth - Born in other state (%) - Black or African American
Place of birth - Born in other state (%) - Asian
Place of birth - Born in other state (%) - Hispanic or Latino
Place of birth - Born in other state (%) - American Indian and Alaska Native
Place of birth - Born in other state (%) - Multirace
Place of birth - Born in other state (%) - Other Race
Place of birth - Native, outside of US (%)
Place of birth - Native, outside of US (%) - White
Place of birth - Native, outside of US (%) - Black or African American
Place of birth - Native, outside of US (%) - Asian
Place of birth - Native, outside of US (%) - Hispanic or Latino
Place of birth - Native, outside of US (%) - American Indian and Alaska Native
Place of birth - Native, outside of US (%) - Multirace
Place of birth - Native, outside of US (%) - Other Race
Place of birth - Foreign born (%)
Place of birth - Foreign born (%) - White
Place of birth - Foreign born (%) - Black or African American
Place of birth - Foreign born (%) - Asian
Place of birth - Foreign born (%) - Hispanic or Latino
Place of birth - Foreign born (%) - American Indian and Alaska Native
Place of birth - Foreign born (%) - Multirace
Place of birth - Foreign born (%) - Other Race
Residents speaking English at home (%)
Residents speaking English at home - Born in the United States (%)
Residents speaking English at home - Native, born elsewhere (%)
Residents speaking English at home - Foreign born (%)
Residents speaking Spanish at home (%)
Residents speaking Spanish at home - Born in the United States (%)
Residents speaking Spanish at home - Native, born elsewhere (%)
Residents speaking Spanish at home - Foreign born (%)
Residents speaking other language at home (%)
Residents speaking other language at home - Born in the United States (%)
Residents speaking other language at home - Native, born elsewhere (%)
Residents speaking other language at home - Foreign born (%)
Marital status - Never married (%)
Marital status - Now married (%)
Marital status - Separated (%)
Marital status - Widowed (%)
Marital status - Divorced (%)
Ancestries Reported - Arab (%)
Ancestries Reported - Czech (%)
Ancestries Reported - Danish (%)
Ancestries Reported - Dutch (%)
Ancestries Reported - English (%)
Ancestries Reported - French (%)
Ancestries Reported - French Canadian (%)
Ancestries Reported - German (%)
Ancestries Reported - Greek (%)
Ancestries Reported - Hungarian (%)
Ancestries Reported - Irish (%)
Ancestries Reported - Italian (%)
Ancestries Reported - Lithuanian (%)
Ancestries Reported - Norwegian (%)
Ancestries Reported - Polish (%)
Ancestries Reported - Portuguese (%)
Ancestries Reported - Russian (%)
Ancestries Reported - Scotch-Irish (%)
Ancestries Reported - Scottish (%)
Ancestries Reported - Slovak (%)
Ancestries Reported - Subsaharan African (%)
Ancestries Reported - Swedish (%)
Ancestries Reported - Swiss (%)
Ancestries Reported - Ukrainian (%)
Ancestries Reported - United States (%)
Ancestries Reported - Welsh (%)
Ancestries Reported - West Indian (%)
Ancestries Reported - Other (%)
Geographical mobility - Same house 1 year ago (%)
Geographical mobility - Same house 1 year ago (%) - White
Geographical mobility - Same house 1 year ago (%) - Black or African American
Geographical mobility - Same house 1 year ago (%) - Asian
Geographical mobility - Same house 1 year ago (%) - Hispanic or Latino
Geographical mobility - Same house 1 year ago (%) - American Indian and Alaska Native
Geographical mobility - Same house 1 year ago (%) - Multirace
Geographical mobility - Same house 1 year ago (%) - Other Race
Geographical mobility - Moved within same county (%)
Geographical mobility - Moved within same county (%) - White
Geographical mobility - Moved within same county (%) - Black or African American
Geographical mobility - Moved within same county (%) - Asian
Geographical mobility - Moved within same county (%) - Hispanic or Latino
Geographical mobility - Moved within same county (%) - American Indian and Alaska Native
Geographical mobility - Moved within same county (%) - Multirace
Geographical mobility - Moved within same county (%) - Other Race
Geographical mobility - Moved from different county within same state (%)
Geographical mobility - Moved from different county within same state (%) - White
Geographical mobility - Moved from different county within same state (%) - Black or African American
Geographical mobility - Moved from different county within same state (%) - Asian
Geographical mobility - Moved from different county within same state (%) - Hispanic or Latino
Geographical mobility - Moved from different county within same state (%) - American Indian and Alaska Native
Geographical mobility - Moved from different county within same state (%) - Multirace
Geographical mobility - Moved from different county within same state (%) - Other Race
Geographical mobility - Moved from different state (%)
Geographical mobility - Moved from different state (%) - White
Geographical mobility - Moved from different state (%) - Black or African American
Geographical mobility - Moved from different state (%) - Asian
Geographical mobility - Moved from different state (%) - Hispanic or Latino
Geographical mobility - Moved from different state (%) - American Indian and Alaska Native
Geographical mobility - Moved from different state (%) - Multirace
Geographical mobility - Moved from different state (%) - Other Race
Geographical mobility - Moved from abroad (%)
Geographical mobility - Moved from abroad (%) - White
Geographical mobility - Moved from abroad (%) - Black or African American
Geographical mobility - Moved from abroad (%) - Asian
Geographical mobility - Moved from abroad (%) - Hispanic or Latino
Geographical mobility - Moved from abroad (%) - American Indian and Alaska Native
Geographical mobility - Moved from abroad (%) - Multirace
Geographical mobility - Moved from abroad (%) - Other Race
Place of birth for the foreign-born population - Ireland (%)
Place of birth for the foreign-born population - Denmark (%)
Place of birth for the foreign-born population - Norway (%)
Place of birth for the foreign-born population - Sweden (%)
Place of birth for the foreign-born population - United Kingdom (%)
Place of birth for the foreign-born population - England (%)
Place of birth for the foreign-born population - Scotland (%)
Place of birth for the foreign-born population - Other Northern Europe (%)
Place of birth for the foreign-born population - Austria (%)
Place of birth for the foreign-born population - Belgium (%)
Place of birth for the foreign-born population - France (%)
Place of birth for the foreign-born population - Germany (%)
Place of birth for the foreign-born population - Netherlands (%)
Place of birth for the foreign-born population - Switzerland (%)
Place of birth for the foreign-born population - Other Western Europe (%)
Place of birth for the foreign-born population - Greece (%)
Place of birth for the foreign-born population - Italy (%)
Place of birth for the foreign-born population - Portugal (%)
Place of birth for the foreign-born population - Spain (%)
Place of birth for the foreign-born population - Other Southern Europe (%)
Place of birth for the foreign-born population - Albania (%)
Place of birth for the foreign-born population - Belarus (%)
Place of birth for the foreign-born population - Bosnia and Herzegovina (%)
Place of birth for the foreign-born population - Bulgaria (%)
Place of birth for the foreign-born population - Croatia (%)
Place of birth for the foreign-born population - Czechoslovakia (%)
Place of birth for the foreign-born population - Hungary (%)
Place of birth for the foreign-born population - Latvia (%)
Place of birth for the foreign-born population - Lithuania (%)
Place of birth for the foreign-born population - North Macedonia (Macedonia) (%)
Place of birth for the foreign-born population - Moldova (%)
Place of birth for the foreign-born population - Poland (%)
Place of birth for the foreign-born population - Romania (%)
Place of birth for the foreign-born population - Russia (%)
Place of birth for the foreign-born population - Serbia (%)
Place of birth for the foreign-born population - Ukraine (%)
Place of birth for the foreign-born population - Other Eastern Europe (%)
Place of birth for the foreign-born population - China (%)
Place of birth for the foreign-born population - Hong Kong (%)
Place of birth for the foreign-born population - Taiwan (%)
Place of birth for the foreign-born population - Japan (%)
Place of birth for the foreign-born population - Korea (%)
Place of birth for the foreign-born population - Other Eastern Asia (%)
Place of birth for the foreign-born population - Afghanistan (%)
Place of birth for the foreign-born population - Bangladesh (%)
Place of birth for the foreign-born population - India (%)
Place of birth for the foreign-born population - Iran (%)
Place of birth for the foreign-born population - Kazakhstan (%)
Place of birth for the foreign-born population - Nepal (%)
Place of birth for the foreign-born population - Pakistan (%)
Place of birth for the foreign-born population - Sri Lanka (%)
Place of birth for the foreign-born population - Uzbekistan (%)
Place of birth for the foreign-born population - Other South Central Asia (%)
Place of birth for the foreign-born population - Burma (%)
Place of birth for the foreign-born population - Cambodia (%)
Place of birth for the foreign-born population - Indonesia (%)
Place of birth for the foreign-born population - Laos (%)
Place of birth for the foreign-born population - Malaysia (%)
Place of birth for the foreign-born population - Philippines (%)
Place of birth for the foreign-born population - Singapore (%)
Place of birth for the foreign-born population - Thailand (%)
Place of birth for the foreign-born population - Vietnam (%)
Place of birth for the foreign-born population - Other South Eastern Asia (%)
Place of birth for the foreign-born population - Armenia (%)
Place of birth for the foreign-born population - Iraq (%)
Place of birth for the foreign-born population - Israel (%)
Place of birth for the foreign-born population - Jordan (%)
Place of birth for the foreign-born population - Kuwait (%)
Place of birth for the foreign-born population - Lebanon (%)
Place of birth for the foreign-born population - Saudi Arabia (%)
Place of birth for the foreign-born population - Syria (%)
Place of birth for the foreign-born population - Turkey (%)
Place of birth for the foreign-born population - Yemen (%)
Place of birth for the foreign-born population - Other Western Asia (%)
Place of birth for the foreign-born population - Eritrea (%)
Place of birth for the foreign-born population - Ethiopia (%)
Place of birth for the foreign-born population - Kenya (%)
Place of birth for the foreign-born population - Somalia (%)
Place of birth for the foreign-born population - Uganda (%)
Place of birth for the foreign-born population - Zimbabwe (%)
Place of birth for the foreign-born population - Other Eastern Africa (%)
Place of birth for the foreign-born population - Cameroon (%)
Place of birth for the foreign-born population - Congo (%)
Place of birth for the foreign-born population - Democratic Republic of Congo (Zaire) (%)
Place of birth for the foreign-born population - Other Middle Africa (%)
Place of birth for the foreign-born population - Egypt (%)
Place of birth for the foreign-born population - Morocco (%)
Place of birth for the foreign-born population - Sudan (%)
Place of birth for the foreign-born population - Other Northern Africa (%)
Place of birth for the foreign-born population - South Africa (%)
Place of birth for the foreign-born population - Other Southern Africa (%)
Place of birth for the foreign-born population - Cabo Verde (%)
Place of birth for the foreign-born population - Ghana (%)
Place of birth for the foreign-born population - Liberia (%)
Place of birth for the foreign-born population - Nigeria (%)
Place of birth for the foreign-born population - Senegal (%)
Place of birth for the foreign-born population - Sierra Leone (%)
Place of birth for the foreign-born population - Other Western Africa (%)
Place of birth for the foreign-born population - Australia (%)
Place of birth for the foreign-born population - New Zealand (%)
Place of birth for the foreign-born population - Fiji (%)
Place of birth for the foreign-born population - Micronesia (%)
Place of birth for the foreign-born population - Bahamas (%)
Place of birth for the foreign-born population - Barbados (%)
Place of birth for the foreign-born population - Cuba (%)
Place of birth for the foreign-born population - Dominica (%)
Place of birth for the foreign-born population - Dominican Republic (%)
Place of birth for the foreign-born population - Grenada (%)
Place of birth for the foreign-born population - Haiti (%)
Place of birth for the foreign-born population - Jamaica (%)
Place of birth for the foreign-born population - St. Vincent and the Grenadines (%)
Place of birth for the foreign-born population - Trinidad and Tobago (%)
Place of birth for the foreign-born population - West Indies (%)
Place of birth for the foreign-born population - Other Caribbean (%)
Place of birth for the foreign-born population - Belize (%)
Place of birth for the foreign-born population - Costa Rica (%)
Place of birth for the foreign-born population - El Salvador (%)
Place of birth for the foreign-born population - Guatemala (%)
Place of birth for the foreign-born population - Honduras (%)
Place of birth for the foreign-born population - Mexico (%)
Place of birth for the foreign-born population - Nicaragua (%)
Place of birth for the foreign-born population - Panama (%)
Place of birth for the foreign-born population - Other Central America (%)
Place of birth for the foreign-born population - Argentina (%)
Place of birth for the foreign-born population - Bolivia (%)
Place of birth for the foreign-born population - Brazil (%)
Place of birth for the foreign-born population - Chile (%)
Place of birth for the foreign-born population - Colombia (%)
Place of birth for the foreign-born population - Ecuador (%)
Place of birth for the foreign-born population - Guyana (%)
Place of birth for the foreign-born population - Peru (%)
Place of birth for the foreign-born population - Uruguay (%)
Place of birth for the foreign-born population - Venezuela (%)
Place of birth for the foreign-born population - Other South America (%)
Place of birth for the foreign-born population - Canada (%)
Place of birth for the foreign-born population - Other Northern America (%)
Place of birth for the foreign-born population - Other (%)
Latest news about races in Sebring, FL collected exclusively by city-data.com from local newspapers, TV, and radio stations
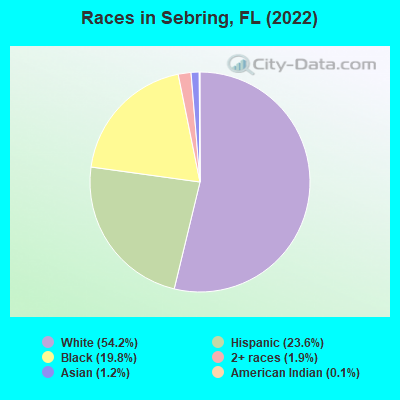
According to 2022 data, the most numerous races in Sebring, FL are White alone (6,152 residents), Hispanic (2,678 residents), and Black alone (2,247 residents). 78.7% of Sebring residents speak English at home. 12.6% of Sebring, FL residents are foreign-born (9.1% born in Latin America, 1.6% born in Asia), which is 66.8% less than the foreign-born rate of 21.0% across the entire state of Florida.
Race distribution in Sebring
2000 2022
10,458,509 65.4% White alone 2,682,715 16.8% Hispanic 2,264,268 14.2% Black alone 261,693 1.6% Asian alone 236,954 1.5% Two or more races 42,358 0.3% American Indian alone 28,994 0.2% Other race alone 6,887 0.04% Native Hawaiian and Other
11,309,403 50.8% White alone 6,025,039 27.1% Hispanic 3,241,015 14.6% Black alone 861,630 3.9% Two or more races 623,692 2.8% Asian alone 152,054 0.7% Other race alone 22,504 0.1% American Indian alone 9,486 0.04% Native Hawaiian and Other
Income and house value in Sebring Median household income in 2022 $51,170 White non-Hispanic householders$27,338 Black householders$23,482 Some other race householders$25,140 Hispanic or Latino race householdersMedian 2022 house value $187,949 White Non-Hispanic householders$105,741 Black or African American householders$523,871 American Indian or Alaska Native householders over $1,000,000 Asian householders$147,973 Some other race householders$158,934 Two or more races householders$160,546 Hispanic or Latino householders
Median age by race in Sebring
58.4 Median age for White residents60.1 56.6 26.8 Median age for Black or African American residents33.5 25.4 69.6 Median age for American Indian / Alaska Native residents-1,043,771,042.7 -1,066,339,065.3 53.1 Median age for Asian residents49.3 56.6 -666,666,666.0 Median age for Native Hawaiian / Pacific Islander residents-666,666,666.0 -666,666,666.0 37.6 Median age for Other race residents44.1 15.8 42.5 Median age for Two or more races residents44.1 43.0 61.4 Median age for White alone residents62.3 60.9 39.9 Median age for Hispanic or Latino residents43.5 32.4
Owner/renter occupied households by race in Sebring
House owners and renters - White residents 2,027 59.2% Owner occupied1,400 40.8% Renter occupiedHouse owners and renters - Black or African American residents 209 30.7% Owner occupied472 69.3% Renter occupiedHouse owners and renters - Asian residents 60 98.7% Owner occupied1 1.3% Renter occupiedHouse owners and renters - Other race residents 85 20.8% Owner occupied325 79.2% Renter occupiedHouse owners and renters - Two or more races residents 214 52.3% Owner occupied195 47.7% Renter occupiedHouse owners and renters - White alone residents 1,894 60.3% Owner occupied1,248 39.7% Renter occupiedHouse owners and renters - Hispanic or Latino residents 429 44.2% Owner occupied542 55.8% Renter occupied
Language usage in Sebring
English speakers - Total 78.7% of residents of Sebring speak English at home.
17.4% of residents speak Spanish at home 1,015 52.6% Speak English very well915 47.4% Speak English less than very well4.0% of residents speak other language at home 307 68.8% Speak English very well139 31.2% Speak English less than very well
English speakers - Born in the United States 91.1% of residents of Sebring speak English at home.
8.6% of residents speak Spanish at home 438 100.0% Speak English very well0.5% of residents speak other language at home 24 100.0% Speak English very well
English speakers - Native, born elsewhere 88.1% of residents of Sebring speak English at home.
41.0% of residents speak Spanish at home 87 40.7% Speak English very well127 59.3% Speak English less than very well
English speakers - Foreign-born 11.6% of residents of Sebring speak English at home.
65.1% of residents speak Spanish at home 142 16.2% Speak English very well732 83.8% Speak English less than very well25.2% of residents speak other language at home 205 60.5% Speak English very well134 39.5% Speak English less than very well
White (Caucasian) - Speak only English Native:
97.9% (6,015)Foreign-born:
9.1% (29)
White (Caucasian) - Speak another language Native:
3.3% (205)Foreign-born:
98.3% (314)
Black or African American - Speak only English Native:
97.0% (1,916)Foreign-born:
77.6% (48)
Black or African American - Speak another language Native:
2.9% (57)Foreign-born:
20.5% (13)
Asian - Speak another language Native:
85.7% (30)Foreign-born:
100.0% (133)
Other race - Speak another language Native:
60.6% (350)Foreign-born:
100.0% (242)
Two or more races - Speak only English Native:
36.0% (305)Foreign-born:
14.0% (55)
Two or more races - Speak another language Native:
37.6% (318)Foreign-born:
78.1% (307)
White alone - Speak only English Native:
98.7% (5,714)Foreign-born:
19.6% (32)
White alone - Speak another language Native:
1.3% (76)Foreign-born:
100.0% (164)
Hispanic or Latino - Speak only English Native:
45.6% (770)Foreign-born:
1.8% (15)
Hispanic or Latino - Speak another language Native:
58.5% (987)Foreign-born:
98.1% (830)
Foreign-born residents in Sebring 1,430 residents are foreign born (9.1% Latin America , 1.6% Asia ).
This city:
12.6%Florida:
21.1%
Marital status for residents in Sebring Marital status - White (Caucasian) population 15 years and over
Males 27.0% Never married42.8% Now married1.1% Separated9.1% Widowed20.1% DivorcedFemales 25.4% Never married34.6% Now married2.9% Separated13.4% Widowed23.7% DivorcedWomen who gave birth in the past 12 months Now married:
67.1% (45)Unmarried:
32.9% (22)
Women who did not give birth in the past 12 months Now married:
23.5% (272)Unmarried:
76.5% (887)
Marital status - Black or African American population 15 years and over
Males 48.2% Never married44.5% Now married0.0% Separated3.7% Widowed3.7% DivorcedFemales 60.7% Never married32.0% Now married0.0% Separated2.6% Widowed4.8% DivorcedWomen who gave birth in the past 12 months Now married:
100.0% (29)Unmarried:
0.0% (0)
Women who did not give birth in the past 12 months Now married:
24.7% (139)Unmarried:
75.3% (422)
Marital status - American Indian / Alaska Native population 15 years and over
Males 100.0% Never married0.0% Now married0.0% Separated0.0% Widowed0.0% DivorcedFemales 0.0% Never married100.0% Now married0.0% Separated0.0% Widowed0.0% DivorcedWomen who did not give birth in the past 12 months Now married:
100.0% (18)Unmarried:
0.0% (0)
Marital status - Asian population 15 years and over
Males 22.9% Never married75.7% Now married0.0% Separated0.0% Widowed1.4% DivorcedFemales 19.2% Never married71.8% Now married0.0% Separated0.0% Widowed9.0% DivorcedWomen who did not give birth in the past 12 months Now married:
65.1% (42)Unmarried:
34.9% (23)
Marital status - Other race population 15 years and over
Males 48.1% Never married19.1% Now married17.9% Separated7.7% Widowed7.3% DivorcedFemales 44.6% Never married28.0% Now married13.7% Separated3.4% Widowed10.3% DivorcedWomen who did not give birth in the past 12 months Now married:
42.2% (82)Unmarried:
57.8% (112)
Marital status - Two or more races population 15 years and over
Males 37.7% Never married55.4% Now married0.0% Separated1.4% Widowed5.5% DivorcedFemales 34.7% Never married25.9% Now married7.6% Separated0.0% Widowed31.9% DivorcedWomen who did not give birth in the past 12 months Now married:
30.4% (57)Unmarried:
69.6% (131)
Marital status - White alone, not Hispanic / Latino population 15 years and over
Males 24.9% Never married41.8% Now married1.0% Separated10.7% Widowed21.6% DivorcedFemales 26.2% Never married33.1% Now married2.1% Separated14.7% Widowed23.9% DivorcedWomen who gave birth in the past 12 months Now married:
60.9% (38)Unmarried:
39.1% (24)
Women who did not give birth in the past 12 months Now married:
22.6% (244)Unmarried:
77.4% (834)
Marital status - Hispanic or Latino population 15 years and over
Males 40.0% Never married40.0% Now married8.1% Separated3.6% Widowed8.3% DivorcedFemales 24.4% Never married38.1% Now married10.4% Separated2.5% Widowed24.5% DivorcedWomen who gave birth in the past 12 months Now married:
100.0% (12)Unmarried:
0.0% (0)
Women who did not give birth in the past 12 months Now married:
39.1% (162)Unmarried:
60.9% (252)
Ancestries in Sebring
927 13.5% American505 7.3% German434 6.3% English422 6.1% Irish138 2.0% Jamaican116 1.7% African112 1.6% Italian84 1.2% Scottish69 1.0% Polish64 0.9% French Canadian58 0.8% Nigerian47 0.7% French43 0.6% Brazilian42 0.6% European41 0.6% Greek41 0.6% Scotch-Irish27 0.4% British20 0.3% Hungarian16 0.2% Haitian15 0.2% Dutch13 0.2% Finnish11 0.2% Canadian9 0.1% South African7 0.1% Norwegian7 0.1% Portuguese7 0.1% Slovak6 0.09% Swiss5 0.07% Lebanese4 0.06% Lithuanian
Children Nativity (place of birth) in Sebring
Children under 6 years - Living with two parents Both parents native 251 100.0% NativeBoth parents foreign-born 42 100.0% NativeOne native, one foreign-born parent 67 100.0% NativeChildren under 6 years - Living with one parent Native parent 92 100.0% NativeForeign-born parent 15 100.0% NativeChildren 6 to 17 years - Living with two parents Both parents native 332 100.0% NativeBoth parents foreign-born 137 93.2% Native10 6.8% Foreign-bornOne native, one foreign-born parent 154 100.0% NativeChildren 6 to 17 years - Living with one parent Native parent 577 100.0% Native
Grandparents responsible for own grandchildren in Sebring
Grandparents (30 to 59 years) White / Caucasian 57 100.0% Not responsible for grandchildrenWhite alone, not Hispanic / Latino 74 100.0% Not responsible for grandchildrenGrandparents (60 years and over) White / Caucasian 6 10.7% Responsible for grandchildren50 89.3% Not responsible for grandchildrenWhite alone, not Hispanic / Latino 6 9.3% Responsible for grandchildren63 90.7% Not responsible for grandchildren