Races in Siesta Key, Florida (FL) Detailed Stats
Data:
Races - White alone (%)
Races - White alone (% change since 2000)
Races - Black alone (%)
Races - Black alone (% change since 2000)
Races - American Indian alone (%)
Races - American Indian alone (% change since 2000)
Races - Asian alone (%)
Races - Asian alone (% change since 2000)
Races - Hispanic (%)
Races - Hispanic (% change since 2000)
Races - Native Hawaiian and Other Pacific Islander alone (%)
Races - Native Hawaiian and Other Pacific Islander alone (% change since 2000)
Races - Two or more races(%)
Races - Two or more races(% change since 2000)
Races - Other race alone (%)
Races - Other race alone (% change since 2000)
Racial diversity
Place of birth - Born in state of residence (%)
Place of birth - Born in state of residence (%) - White
Place of birth - Born in state of residence (%) - Black or African American
Place of birth - Born in state of residence (%) - Asian
Place of birth - Born in state of residence (%) - Hispanic or Latino
Place of birth - Born in state of residence (%) - American Indian and Alaska Native
Place of birth - Born in state of residence (%) - Multirace
Place of birth - Born in state of residence (%) - Other Race
Place of birth - Born in other state (%)
Place of birth - Born in other state (%) - White
Place of birth - Born in other state (%) - Black or African American
Place of birth - Born in other state (%) - Asian
Place of birth - Born in other state (%) - Hispanic or Latino
Place of birth - Born in other state (%) - American Indian and Alaska Native
Place of birth - Born in other state (%) - Multirace
Place of birth - Born in other state (%) - Other Race
Place of birth - Native, outside of US (%)
Place of birth - Native, outside of US (%) - White
Place of birth - Native, outside of US (%) - Black or African American
Place of birth - Native, outside of US (%) - Asian
Place of birth - Native, outside of US (%) - Hispanic or Latino
Place of birth - Native, outside of US (%) - American Indian and Alaska Native
Place of birth - Native, outside of US (%) - Multirace
Place of birth - Native, outside of US (%) - Other Race
Place of birth - Foreign born (%)
Place of birth - Foreign born (%) - White
Place of birth - Foreign born (%) - Black or African American
Place of birth - Foreign born (%) - Asian
Place of birth - Foreign born (%) - Hispanic or Latino
Place of birth - Foreign born (%) - American Indian and Alaska Native
Place of birth - Foreign born (%) - Multirace
Place of birth - Foreign born (%) - Other Race
Residents speaking English at home (%)
Residents speaking English at home - Born in the United States (%)
Residents speaking English at home - Native, born elsewhere (%)
Residents speaking English at home - Foreign born (%)
Residents speaking Spanish at home (%)
Residents speaking Spanish at home - Born in the United States (%)
Residents speaking Spanish at home - Native, born elsewhere (%)
Residents speaking Spanish at home - Foreign born (%)
Residents speaking other language at home (%)
Residents speaking other language at home - Born in the United States (%)
Residents speaking other language at home - Native, born elsewhere (%)
Residents speaking other language at home - Foreign born (%)
Marital status - Never married (%)
Marital status - Now married (%)
Marital status - Separated (%)
Marital status - Widowed (%)
Marital status - Divorced (%)
Ancestries Reported - Arab (%)
Ancestries Reported - Czech (%)
Ancestries Reported - Danish (%)
Ancestries Reported - Dutch (%)
Ancestries Reported - English (%)
Ancestries Reported - French (%)
Ancestries Reported - French Canadian (%)
Ancestries Reported - German (%)
Ancestries Reported - Greek (%)
Ancestries Reported - Hungarian (%)
Ancestries Reported - Irish (%)
Ancestries Reported - Italian (%)
Ancestries Reported - Lithuanian (%)
Ancestries Reported - Norwegian (%)
Ancestries Reported - Polish (%)
Ancestries Reported - Portuguese (%)
Ancestries Reported - Russian (%)
Ancestries Reported - Scotch-Irish (%)
Ancestries Reported - Scottish (%)
Ancestries Reported - Slovak (%)
Ancestries Reported - Subsaharan African (%)
Ancestries Reported - Swedish (%)
Ancestries Reported - Swiss (%)
Ancestries Reported - Ukrainian (%)
Ancestries Reported - United States (%)
Ancestries Reported - Welsh (%)
Ancestries Reported - West Indian (%)
Ancestries Reported - Other (%)
Geographical mobility - Same house 1 year ago (%)
Geographical mobility - Same house 1 year ago (%) - White
Geographical mobility - Same house 1 year ago (%) - Black or African American
Geographical mobility - Same house 1 year ago (%) - Asian
Geographical mobility - Same house 1 year ago (%) - Hispanic or Latino
Geographical mobility - Same house 1 year ago (%) - American Indian and Alaska Native
Geographical mobility - Same house 1 year ago (%) - Multirace
Geographical mobility - Same house 1 year ago (%) - Other Race
Geographical mobility - Moved within same county (%)
Geographical mobility - Moved within same county (%) - White
Geographical mobility - Moved within same county (%) - Black or African American
Geographical mobility - Moved within same county (%) - Asian
Geographical mobility - Moved within same county (%) - Hispanic or Latino
Geographical mobility - Moved within same county (%) - American Indian and Alaska Native
Geographical mobility - Moved within same county (%) - Multirace
Geographical mobility - Moved within same county (%) - Other Race
Geographical mobility - Moved from different county within same state (%)
Geographical mobility - Moved from different county within same state (%) - White
Geographical mobility - Moved from different county within same state (%) - Black or African American
Geographical mobility - Moved from different county within same state (%) - Asian
Geographical mobility - Moved from different county within same state (%) - Hispanic or Latino
Geographical mobility - Moved from different county within same state (%) - American Indian and Alaska Native
Geographical mobility - Moved from different county within same state (%) - Multirace
Geographical mobility - Moved from different county within same state (%) - Other Race
Geographical mobility - Moved from different state (%)
Geographical mobility - Moved from different state (%) - White
Geographical mobility - Moved from different state (%) - Black or African American
Geographical mobility - Moved from different state (%) - Asian
Geographical mobility - Moved from different state (%) - Hispanic or Latino
Geographical mobility - Moved from different state (%) - American Indian and Alaska Native
Geographical mobility - Moved from different state (%) - Multirace
Geographical mobility - Moved from different state (%) - Other Race
Geographical mobility - Moved from abroad (%)
Geographical mobility - Moved from abroad (%) - White
Geographical mobility - Moved from abroad (%) - Black or African American
Geographical mobility - Moved from abroad (%) - Asian
Geographical mobility - Moved from abroad (%) - Hispanic or Latino
Geographical mobility - Moved from abroad (%) - American Indian and Alaska Native
Geographical mobility - Moved from abroad (%) - Multirace
Geographical mobility - Moved from abroad (%) - Other Race
Place of birth for the foreign-born population - Ireland (%)
Place of birth for the foreign-born population - Denmark (%)
Place of birth for the foreign-born population - Norway (%)
Place of birth for the foreign-born population - Sweden (%)
Place of birth for the foreign-born population - United Kingdom (%)
Place of birth for the foreign-born population - England (%)
Place of birth for the foreign-born population - Scotland (%)
Place of birth for the foreign-born population - Other Northern Europe (%)
Place of birth for the foreign-born population - Austria (%)
Place of birth for the foreign-born population - Belgium (%)
Place of birth for the foreign-born population - France (%)
Place of birth for the foreign-born population - Germany (%)
Place of birth for the foreign-born population - Netherlands (%)
Place of birth for the foreign-born population - Switzerland (%)
Place of birth for the foreign-born population - Other Western Europe (%)
Place of birth for the foreign-born population - Greece (%)
Place of birth for the foreign-born population - Italy (%)
Place of birth for the foreign-born population - Portugal (%)
Place of birth for the foreign-born population - Spain (%)
Place of birth for the foreign-born population - Other Southern Europe (%)
Place of birth for the foreign-born population - Albania (%)
Place of birth for the foreign-born population - Belarus (%)
Place of birth for the foreign-born population - Bosnia and Herzegovina (%)
Place of birth for the foreign-born population - Bulgaria (%)
Place of birth for the foreign-born population - Croatia (%)
Place of birth for the foreign-born population - Czechoslovakia (%)
Place of birth for the foreign-born population - Hungary (%)
Place of birth for the foreign-born population - Latvia (%)
Place of birth for the foreign-born population - Lithuania (%)
Place of birth for the foreign-born population - North Macedonia (Macedonia) (%)
Place of birth for the foreign-born population - Moldova (%)
Place of birth for the foreign-born population - Poland (%)
Place of birth for the foreign-born population - Romania (%)
Place of birth for the foreign-born population - Russia (%)
Place of birth for the foreign-born population - Serbia (%)
Place of birth for the foreign-born population - Ukraine (%)
Place of birth for the foreign-born population - Other Eastern Europe (%)
Place of birth for the foreign-born population - China (%)
Place of birth for the foreign-born population - Hong Kong (%)
Place of birth for the foreign-born population - Taiwan (%)
Place of birth for the foreign-born population - Japan (%)
Place of birth for the foreign-born population - Korea (%)
Place of birth for the foreign-born population - Other Eastern Asia (%)
Place of birth for the foreign-born population - Afghanistan (%)
Place of birth for the foreign-born population - Bangladesh (%)
Place of birth for the foreign-born population - India (%)
Place of birth for the foreign-born population - Iran (%)
Place of birth for the foreign-born population - Kazakhstan (%)
Place of birth for the foreign-born population - Nepal (%)
Place of birth for the foreign-born population - Pakistan (%)
Place of birth for the foreign-born population - Sri Lanka (%)
Place of birth for the foreign-born population - Uzbekistan (%)
Place of birth for the foreign-born population - Other South Central Asia (%)
Place of birth for the foreign-born population - Burma (%)
Place of birth for the foreign-born population - Cambodia (%)
Place of birth for the foreign-born population - Indonesia (%)
Place of birth for the foreign-born population - Laos (%)
Place of birth for the foreign-born population - Malaysia (%)
Place of birth for the foreign-born population - Philippines (%)
Place of birth for the foreign-born population - Singapore (%)
Place of birth for the foreign-born population - Thailand (%)
Place of birth for the foreign-born population - Vietnam (%)
Place of birth for the foreign-born population - Other South Eastern Asia (%)
Place of birth for the foreign-born population - Armenia (%)
Place of birth for the foreign-born population - Iraq (%)
Place of birth for the foreign-born population - Israel (%)
Place of birth for the foreign-born population - Jordan (%)
Place of birth for the foreign-born population - Kuwait (%)
Place of birth for the foreign-born population - Lebanon (%)
Place of birth for the foreign-born population - Saudi Arabia (%)
Place of birth for the foreign-born population - Syria (%)
Place of birth for the foreign-born population - Turkey (%)
Place of birth for the foreign-born population - Yemen (%)
Place of birth for the foreign-born population - Other Western Asia (%)
Place of birth for the foreign-born population - Eritrea (%)
Place of birth for the foreign-born population - Ethiopia (%)
Place of birth for the foreign-born population - Kenya (%)
Place of birth for the foreign-born population - Somalia (%)
Place of birth for the foreign-born population - Uganda (%)
Place of birth for the foreign-born population - Zimbabwe (%)
Place of birth for the foreign-born population - Other Eastern Africa (%)
Place of birth for the foreign-born population - Cameroon (%)
Place of birth for the foreign-born population - Congo (%)
Place of birth for the foreign-born population - Democratic Republic of Congo (Zaire) (%)
Place of birth for the foreign-born population - Other Middle Africa (%)
Place of birth for the foreign-born population - Egypt (%)
Place of birth for the foreign-born population - Morocco (%)
Place of birth for the foreign-born population - Sudan (%)
Place of birth for the foreign-born population - Other Northern Africa (%)
Place of birth for the foreign-born population - South Africa (%)
Place of birth for the foreign-born population - Other Southern Africa (%)
Place of birth for the foreign-born population - Cabo Verde (%)
Place of birth for the foreign-born population - Ghana (%)
Place of birth for the foreign-born population - Liberia (%)
Place of birth for the foreign-born population - Nigeria (%)
Place of birth for the foreign-born population - Senegal (%)
Place of birth for the foreign-born population - Sierra Leone (%)
Place of birth for the foreign-born population - Other Western Africa (%)
Place of birth for the foreign-born population - Australia (%)
Place of birth for the foreign-born population - New Zealand (%)
Place of birth for the foreign-born population - Fiji (%)
Place of birth for the foreign-born population - Micronesia (%)
Place of birth for the foreign-born population - Bahamas (%)
Place of birth for the foreign-born population - Barbados (%)
Place of birth for the foreign-born population - Cuba (%)
Place of birth for the foreign-born population - Dominica (%)
Place of birth for the foreign-born population - Dominican Republic (%)
Place of birth for the foreign-born population - Grenada (%)
Place of birth for the foreign-born population - Haiti (%)
Place of birth for the foreign-born population - Jamaica (%)
Place of birth for the foreign-born population - St. Vincent and the Grenadines (%)
Place of birth for the foreign-born population - Trinidad and Tobago (%)
Place of birth for the foreign-born population - West Indies (%)
Place of birth for the foreign-born population - Other Caribbean (%)
Place of birth for the foreign-born population - Belize (%)
Place of birth for the foreign-born population - Costa Rica (%)
Place of birth for the foreign-born population - El Salvador (%)
Place of birth for the foreign-born population - Guatemala (%)
Place of birth for the foreign-born population - Honduras (%)
Place of birth for the foreign-born population - Mexico (%)
Place of birth for the foreign-born population - Nicaragua (%)
Place of birth for the foreign-born population - Panama (%)
Place of birth for the foreign-born population - Other Central America (%)
Place of birth for the foreign-born population - Argentina (%)
Place of birth for the foreign-born population - Bolivia (%)
Place of birth for the foreign-born population - Brazil (%)
Place of birth for the foreign-born population - Chile (%)
Place of birth for the foreign-born population - Colombia (%)
Place of birth for the foreign-born population - Ecuador (%)
Place of birth for the foreign-born population - Guyana (%)
Place of birth for the foreign-born population - Peru (%)
Place of birth for the foreign-born population - Uruguay (%)
Place of birth for the foreign-born population - Venezuela (%)
Place of birth for the foreign-born population - Other South America (%)
Place of birth for the foreign-born population - Canada (%)
Place of birth for the foreign-born population - Other Northern America (%)
Place of birth for the foreign-born population - Other (%)
Beertopia, Parrish Heritage Days, Art in the Park, Gamble Plantation Open House & more, all this weekend! (2 replies)Irish Celtic Festival, Palmetto Heritage Festival, Festival of the Arts, Paul Anka & Baseball, all this weekend! (0 replies)Gem Jewelry & Bead Show, Special Olympics Paddle Competition, Opera Open House, Wrestling & More, all this weekend! (0 replies)DeSoto Heritage Grand Parade, SRQ Comic-Con, Rowing Championships, BIG Car Show, Tattoo Expo & more, all this weekend! (1 reply)Downtown SRQ Blues Festival, Quilts on Parade, Gamble Plantation Open House, NHRA Pro Mods & more, all this weekend! (2 replies)Cardboard Boat Race/ Englewood Pioneer Festival, Beat the Heat Challenge & more, all this weekend! (1 reply)
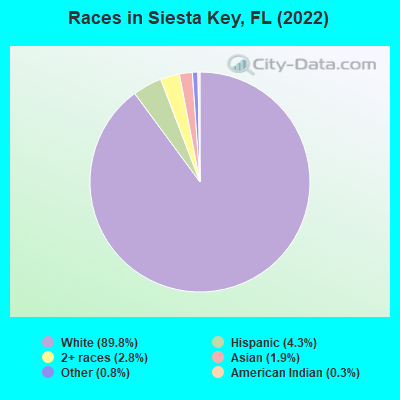
According to 2022 data, the most numerous races in Siesta Key, FL are White alone (5,231 residents), Hispanic (251 residents), and Black alone (0 residents). 89.1% of Siesta Key residents speak English at home. 13.3% of Siesta Key, FL residents are foreign-born (5.7% born in Europe, 2.8% born in Asia, 2.8% born in North America, 1.7% born in Latin America), which is 58.4% less than the foreign-born rate of 21.0% across the entire state of Florida.
Race distribution in Siesta Key
2000 2022
10,458,509 65.4% White alone 2,682,715 16.8% Hispanic 2,264,268 14.2% Black alone 261,693 1.6% Asian alone 236,954 1.5% Two or more races 42,358 0.3% American Indian alone 28,994 0.2% Other race alone 6,887 0.04% Native Hawaiian and Other
11,309,403 50.8% White alone 6,025,039 27.1% Hispanic 3,241,015 14.6% Black alone 861,630 3.9% Two or more races 623,692 2.8% Asian alone 152,054 0.7% Other race alone 22,504 0.1% American Indian alone 9,486 0.04% Native Hawaiian and Other
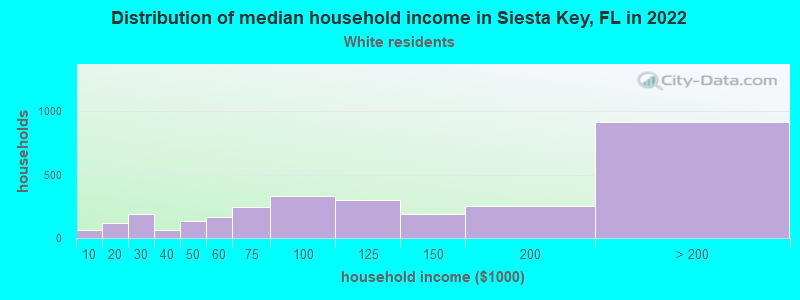
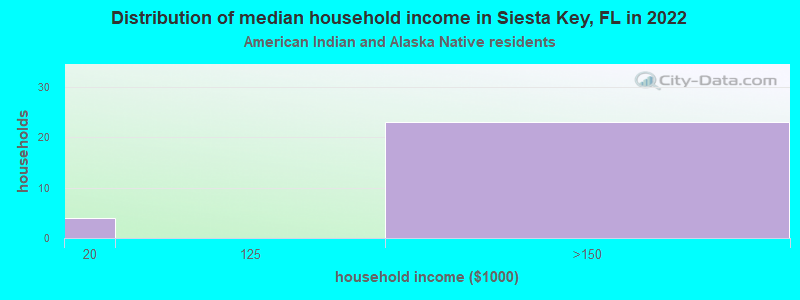
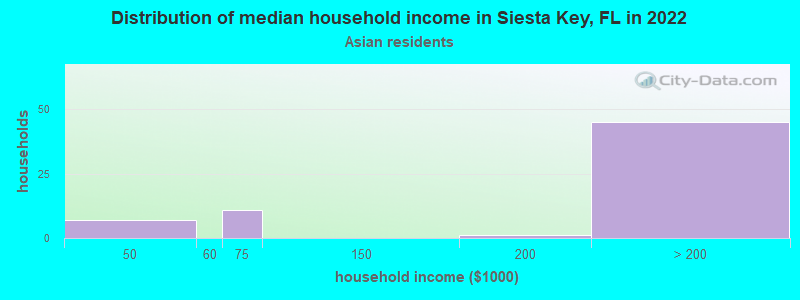
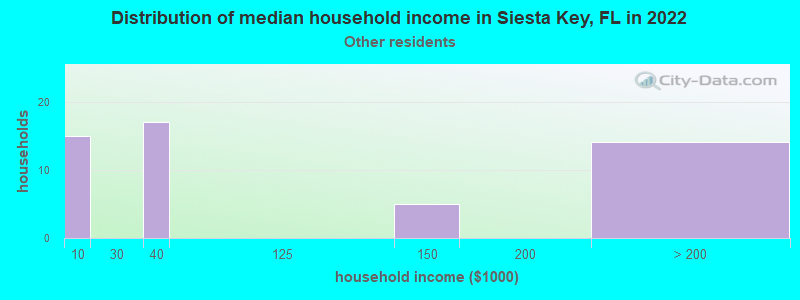
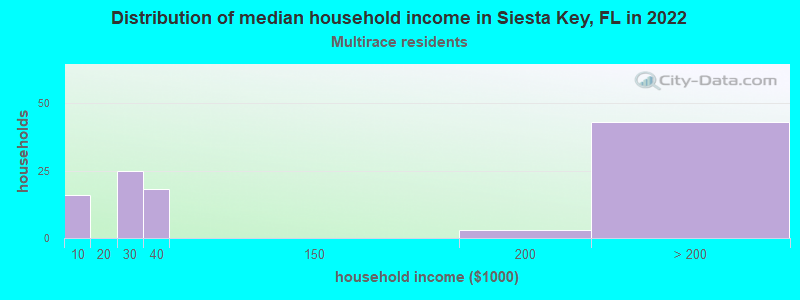
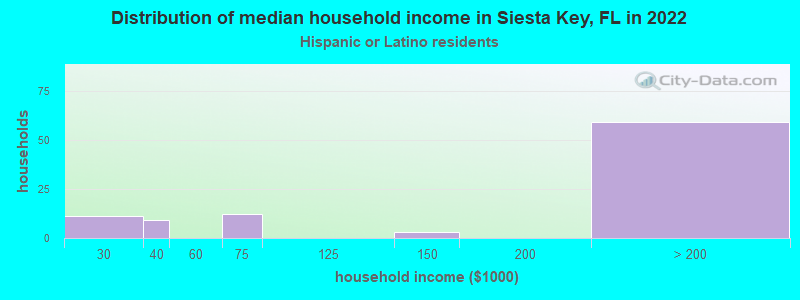
Income and house value in Siesta Key Median household income in 2022 $110,072 White non-Hispanic householdersover $200,000 Asian householdersMedian 2022 house value over $1,000,000 White Non-Hispanic householders$368,556 Black or African American householders$450,458 American Indian or Alaska Native householders$614,261 Two or more races householders$450,458 Hispanic or Latino householders
Median age by race in Siesta Key
69.4 Median age for White residents68.3 69.4 -785,310,733.7 Median age for Black or African American residents-859,047,618.2 -670,401,493.3 -1,274,161,734.4 Median age for American Indian / Alaska Native residents-856,941,507.2 -594,925,633.7 62.5 Median age for Asian residents55.2 68.0 -679,849,340.2 Median age for Native Hawaiian / Pacific Islander residents-858,307,848.3 -443,298,968.6 61.5 Median age for Other race residents79.2 69.2 35.9 Median age for Two or more races residents25.5 35.9 69.0 Median age for White alone residents67.5 69.3 51.6 Median age for Hispanic or Latino residents51.4 60.5
Owner/renter occupied households by race in Siesta Key
House owners and renters - White residents 2,636 89.7% Owner occupied304 10.3% Renter occupiedHouse owners and renters - American Indian / Alaska Native residents 28 100.0% Owner occupiedHouse owners and renters - Asian residents 58 79.1% Owner occupied15 20.9% Renter occupiedHouse owners and renters - Other race residents 67 100.0% Owner occupiedHouse owners and renters - Two or more races residents 89 81.4% Owner occupied20 18.6% Renter occupiedHouse owners and renters - White alone residents 2,615 89.1% Owner occupied320 10.9% Renter occupiedHouse owners and renters - Hispanic or Latino residents 109 100.0% Owner occupied
Language usage in Siesta Key
English speakers - Total 89.1% of residents of Siesta Key speak English at home.
1.9% of residents speak Spanish at home 104 94.5% Speak English very well6 5.5% Speak English less than very well9.0% of residents speak other language at home 372 71.1% Speak English very well151 28.9% Speak English less than very well
English speakers - Born in the United States 97.3% of residents of Siesta Key speak English at home.
0.7% of residents speak Spanish at home 31 100.0% Speak English very well1.9% of residents speak other language at home 81 100.0% Speak English very well
English speakers - Native, born elsewhere 55.8% of residents of Siesta Key speak English at home.
2.9% of residents speak Spanish at home 4 100.0% Speak English very well41.3% of residents speak other language at home 10 17.5% Speak English very well47 82.5% Speak English less than very well
English speakers - Foreign-born 45.5% of residents of Siesta Key speak English at home.
9.4% of residents speak Spanish at home 76 91.6% Speak English very well7 8.4% Speak English less than very well43.3% of residents speak other language at home 283 74.3% Speak English very well98 25.7% Speak English less than very well
White (Caucasian) - Speak only English Native:
97.4% (4,472)Foreign-born:
54.6% (280)
White (Caucasian) - Speak another language Native:
2.7% (126)Foreign-born:
44.8% (230)
American Indian / Alaska Native - Speak only English Native:
77.0% (4)Foreign-born:
61.4% (23)
Asian - Speak only English Native:
100.0% (10)Foreign-born:
33.3% (35)
Asian - Speak another language Native:
6.4% (1)Foreign-born:
61.2% (64)
Two or more races - Speak only English Native:
97.4% (249)Foreign-born:
31.4% (54)
Two or more races - Speak another language Native:
5.7% (14)Foreign-born:
57.6% (98)
White alone - Speak only English Native:
96.7% (4,451)Foreign-born:
49.6% (301)
White alone - Speak another language Native:
3.3% (154)Foreign-born:
48.6% (295)
Hispanic or Latino - Speak only English Native:
100.0% (131)Foreign-born:
15.0% (18)
Foreign-born residents in Siesta Key 772 residents are foreign born (5.7% Europe , 2.8% Asia , 2.8% North America , 1.7% Latin America ).
This city:
13.3%Florida:
21.1%
Marital status for residents in Siesta Key Marital status - White (Caucasian) population 15 years and over
Males 9.2% Never married70.3% Now married0.8% Separated4.6% Widowed15.1% DivorcedFemales 11.0% Never married69.4% Now married0.2% Separated13.2% Widowed6.1% DivorcedWomen who did not give birth in the past 12 months Now married:
40.7% (123)Unmarried:
59.3% (180)
Marital status - Asian population 15 years and over
Males 13.3% Never married44.4% Now married6.7% Separated2.2% Widowed33.3% DivorcedFemales 0.0% Never married33.3% Now married0.0% Separated8.8% Widowed57.9% DivorcedMarital status - Other race population 15 years and over
Males 0.0% Never married86.7% Now married0.0% Separated0.0% Widowed13.3% DivorcedFemales 35.1% Never married32.4% Now married0.0% Separated32.4% Widowed0.0% DivorcedWomen who did not give birth in the past 12 months Now married:
18.8% (4)Unmarried:
81.2% (19)
Marital status - Two or more races population 15 years and over
Males 25.6% Never married65.9% Now married0.0% Separated0.0% Widowed8.5% DivorcedFemales 23.1% Never married62.8% Now married0.0% Separated0.0% Widowed14.0% DivorcedWomen who did not give birth in the past 12 months Now married:
44.4% (53)Unmarried:
55.6% (67)
Marital status - White alone, not Hispanic / Latino population 15 years and over
Males 9.2% Never married70.2% Now married0.8% Separated4.6% Widowed15.1% DivorcedFemales 11.2% Never married70.6% Now married0.2% Separated11.7% Widowed6.2% DivorcedWomen who did not give birth in the past 12 months Now married:
42.1% (130)Unmarried:
57.9% (179)
Marital status - Hispanic or Latino population 15 years and over
Males 0.0% Never married95.7% Now married0.0% Separated0.0% Widowed4.3% DivorcedFemales 15.5% Never married42.6% Now married0.0% Separated41.9% Widowed0.0% DivorcedWomen who did not give birth in the past 12 months Now married:
49.2% (31)Unmarried:
50.8% (32)
Ancestries in Siesta Key
559 16.9% German526 15.9% American464 14.0% English356 10.7% Irish319 9.6% Italian88 2.7% Norwegian79 2.4% Polish63 1.9% French61 1.8% British55 1.7% European47 1.4% Bulgarian42 1.3% Austrian39 1.2% Finnish38 1.1% Iranian33 1.0% Canadian31 0.9% Serbian30 0.9% Lebanese29 0.9% Ukrainian26 0.8% Scottish25 0.8% Swedish23 0.7% Welsh21 0.6% Portuguese20 0.6% Eastern European20 0.6% Scandinavian17 0.5% Israeli15 0.5% Hungarian12 0.4% French Canadian10 0.3% Scotch-Irish10 0.3% Greek9 0.3% Romanian8 0.2% Australian6 0.2% Dutch6 0.2% Czech6 0.2% Slavic6 0.2% Slovene5 0.2% Russian4 0.1% Swiss3 0.09% Brazilian2 0.06% Armenian
Children Nativity (place of birth) in Siesta Key
Children under 6 years - Living with two parents Both parents native 64 100.0% NativeOne native, one foreign-born parent 14 100.0% NativeChildren 6 to 17 years - Living with two parents Both parents native 185 100.0% NativeBoth parents foreign-born 12 80.0% Native3 20.0% Foreign-bornOne native, one foreign-born parent 27 100.0% NativeChildren 6 to 17 years - Living with one parent Native parent 44 67.2% Native22 32.8% Foreign-bornForeign-born parent 15 100.0% Native
Grandparents responsible for own grandchildren in Siesta Key
Grandparents (30 to 59 years) White / Caucasian 2 100.0% Responsible for grandchildrenWhite alone, not Hispanic / Latino 2 100.0% Responsible for grandchildren
Grandparents (60 years and over) White / Caucasian 3 100.0% Not responsible for grandchildrenWhite alone, not Hispanic / Latino 3 100.0% Not responsible for grandchildren