Races in Sioux City, Iowa (IA) Detailed Stats
Data:
Races - White alone (%)
Races - White alone (% change since 2000)
Races - Black alone (%)
Races - Black alone (% change since 2000)
Races - American Indian alone (%)
Races - American Indian alone (% change since 2000)
Races - Asian alone (%)
Races - Asian alone (% change since 2000)
Races - Hispanic (%)
Races - Hispanic (% change since 2000)
Races - Native Hawaiian and Other Pacific Islander alone (%)
Races - Native Hawaiian and Other Pacific Islander alone (% change since 2000)
Races - Two or more races(%)
Races - Two or more races(% change since 2000)
Races - Other race alone (%)
Races - Other race alone (% change since 2000)
Racial diversity
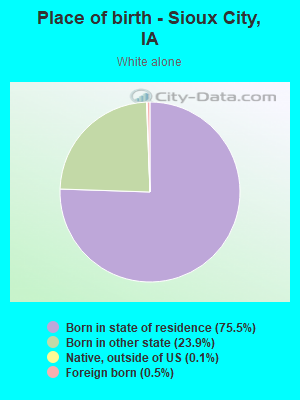
Place of birth - Born in state of residence (%)
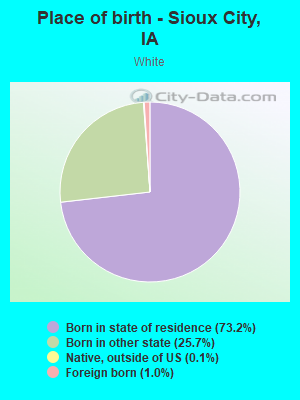
Place of birth - Born in state of residence (%) - White
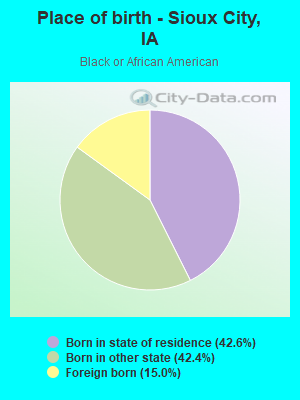
Place of birth - Born in state of residence (%) - Black or African American
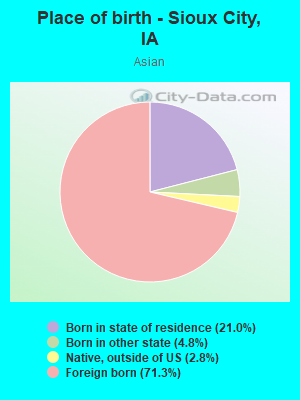
Place of birth - Born in state of residence (%) - Asian
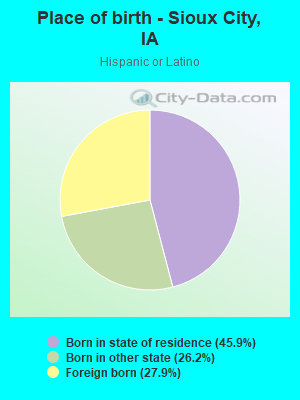
Place of birth - Born in state of residence (%) - Hispanic or Latino
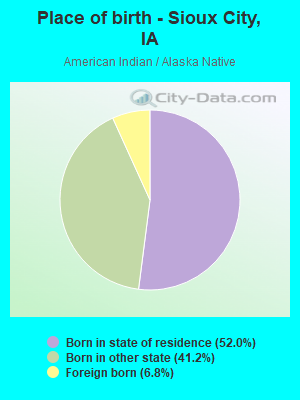
Place of birth - Born in state of residence (%) - American Indian and Alaska Native
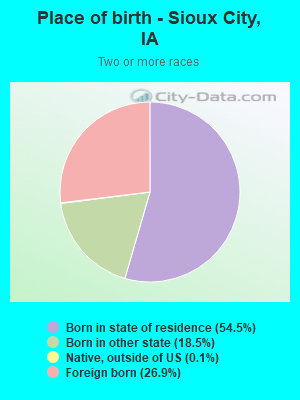
Place of birth - Born in state of residence (%) - Multirace
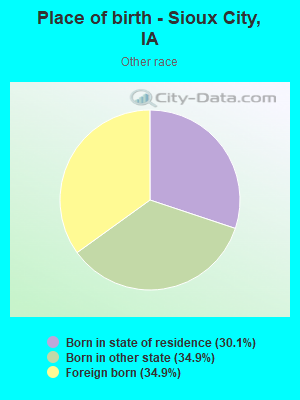
Place of birth - Born in state of residence (%) - Other Race
Place of birth - Born in other state (%)
Place of birth - Born in other state (%) - White
Place of birth - Born in other state (%) - Black or African American
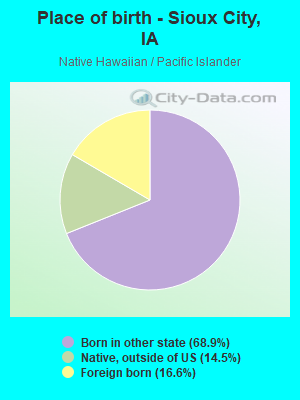
Place of birth - Born in other state (%) - Asian
Place of birth - Born in other state (%) - Hispanic or Latino
Place of birth - Born in other state (%) - American Indian and Alaska Native
Place of birth - Born in other state (%) - Multirace
Place of birth - Born in other state (%) - Other Race
Place of birth - Native, outside of US (%)
Place of birth - Native, outside of US (%) - White
Place of birth - Native, outside of US (%) - Black or African American
Place of birth - Native, outside of US (%) - Asian
Place of birth - Native, outside of US (%) - Hispanic or Latino
Place of birth - Native, outside of US (%) - American Indian and Alaska Native
Place of birth - Native, outside of US (%) - Multirace
Place of birth - Native, outside of US (%) - Other Race
Place of birth - Foreign born (%)
Place of birth - Foreign born (%) - White
Place of birth - Foreign born (%) - Black or African American
Place of birth - Foreign born (%) - Asian
Place of birth - Foreign born (%) - Hispanic or Latino
Place of birth - Foreign born (%) - American Indian and Alaska Native
Place of birth - Foreign born (%) - Multirace
Place of birth - Foreign born (%) - Other Race
Residents speaking English at home (%)
Residents speaking English at home - Born in the United States (%)
Residents speaking English at home - Native, born elsewhere (%)
Residents speaking English at home - Foreign born (%)
Residents speaking Spanish at home (%)
Residents speaking Spanish at home - Born in the United States (%)
Residents speaking Spanish at home - Native, born elsewhere (%)
Residents speaking Spanish at home - Foreign born (%)
Residents speaking other language at home (%)
Residents speaking other language at home - Born in the United States (%)
Residents speaking other language at home - Native, born elsewhere (%)
Residents speaking other language at home - Foreign born (%)
Marital status - Never married (%)
Marital status - Now married (%)
Marital status - Separated (%)
Marital status - Widowed (%)
Marital status - Divorced (%)
Ancestries Reported - Arab (%)
Ancestries Reported - Czech (%)
Ancestries Reported - Danish (%)
Ancestries Reported - Dutch (%)
Ancestries Reported - English (%)
Ancestries Reported - French (%)
Ancestries Reported - French Canadian (%)
Ancestries Reported - German (%)
Ancestries Reported - Greek (%)
Ancestries Reported - Hungarian (%)
Ancestries Reported - Irish (%)
Ancestries Reported - Italian (%)
Ancestries Reported - Lithuanian (%)
Ancestries Reported - Norwegian (%)
Ancestries Reported - Polish (%)
Ancestries Reported - Portuguese (%)
Ancestries Reported - Russian (%)
Ancestries Reported - Scotch-Irish (%)
Ancestries Reported - Scottish (%)
Ancestries Reported - Slovak (%)
Ancestries Reported - Subsaharan African (%)
Ancestries Reported - Swedish (%)
Ancestries Reported - Swiss (%)
Ancestries Reported - Ukrainian (%)
Ancestries Reported - United States (%)
Ancestries Reported - Welsh (%)
Ancestries Reported - West Indian (%)
Ancestries Reported - Other (%)
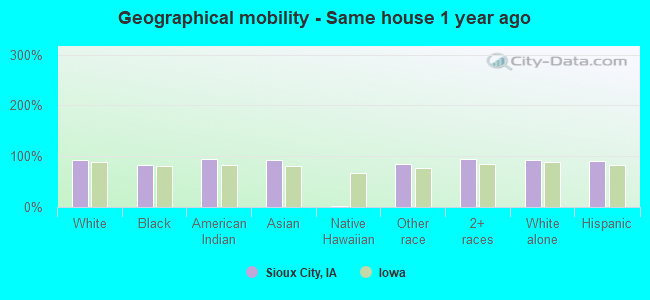
Geographical mobility - Same house 1 year ago (%)
Geographical mobility - Same house 1 year ago (%) - White
Geographical mobility - Same house 1 year ago (%) - Black or African American
Geographical mobility - Same house 1 year ago (%) - Asian
Geographical mobility - Same house 1 year ago (%) - Hispanic or Latino
Geographical mobility - Same house 1 year ago (%) - American Indian and Alaska Native
Geographical mobility - Same house 1 year ago (%) - Multirace
Geographical mobility - Same house 1 year ago (%) - Other Race
Geographical mobility - Moved within same county (%)
Geographical mobility - Moved within same county (%) - White
Geographical mobility - Moved within same county (%) - Black or African American
Geographical mobility - Moved within same county (%) - Asian
Geographical mobility - Moved within same county (%) - Hispanic or Latino
Geographical mobility - Moved within same county (%) - American Indian and Alaska Native
Geographical mobility - Moved within same county (%) - Multirace
Geographical mobility - Moved within same county (%) - Other Race
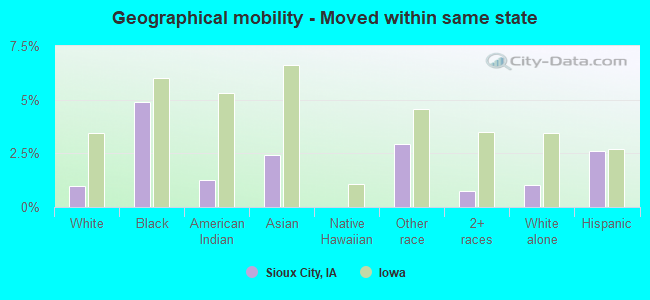
Geographical mobility - Moved from different county within same state (%)
Geographical mobility - Moved from different county within same state (%) - White
Geographical mobility - Moved from different county within same state (%) - Black or African American
Geographical mobility - Moved from different county within same state (%) - Asian
Geographical mobility - Moved from different county within same state (%) - Hispanic or Latino
Geographical mobility - Moved from different county within same state (%) - American Indian and Alaska Native
Geographical mobility - Moved from different county within same state (%) - Multirace
Geographical mobility - Moved from different county within same state (%) - Other Race
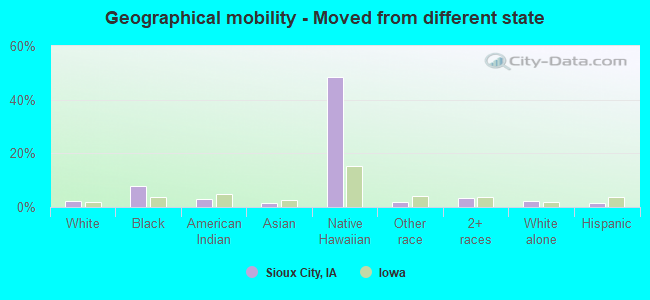
Geographical mobility - Moved from different state (%)
Geographical mobility - Moved from different state (%) - White
Geographical mobility - Moved from different state (%) - Black or African American
Geographical mobility - Moved from different state (%) - Asian
Geographical mobility - Moved from different state (%) - Hispanic or Latino
Geographical mobility - Moved from different state (%) - American Indian and Alaska Native
Geographical mobility - Moved from different state (%) - Multirace
Geographical mobility - Moved from different state (%) - Other Race
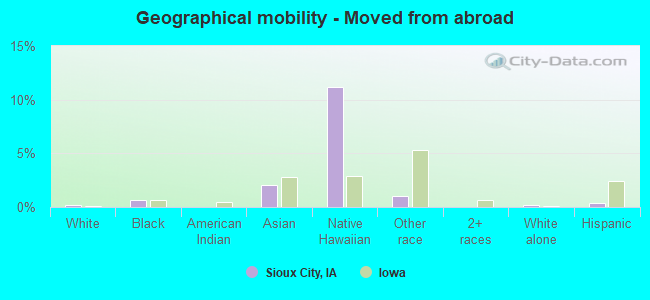
Geographical mobility - Moved from abroad (%)
Geographical mobility - Moved from abroad (%) - White
Geographical mobility - Moved from abroad (%) - Black or African American
Geographical mobility - Moved from abroad (%) - Asian
Geographical mobility - Moved from abroad (%) - Hispanic or Latino
Geographical mobility - Moved from abroad (%) - American Indian and Alaska Native
Geographical mobility - Moved from abroad (%) - Multirace
Geographical mobility - Moved from abroad (%) - Other Race
Place of birth for the foreign-born population - Ireland (%)
Place of birth for the foreign-born population - Denmark (%)
Place of birth for the foreign-born population - Norway (%)
Place of birth for the foreign-born population - Sweden (%)
Place of birth for the foreign-born population - United Kingdom (%)
Place of birth for the foreign-born population - England (%)
Place of birth for the foreign-born population - Scotland (%)
Place of birth for the foreign-born population - Other Northern Europe (%)
Place of birth for the foreign-born population - Austria (%)
Place of birth for the foreign-born population - Belgium (%)
Place of birth for the foreign-born population - France (%)
Place of birth for the foreign-born population - Germany (%)
Place of birth for the foreign-born population - Netherlands (%)
Place of birth for the foreign-born population - Switzerland (%)
Place of birth for the foreign-born population - Other Western Europe (%)
Place of birth for the foreign-born population - Greece (%)
Place of birth for the foreign-born population - Italy (%)
Place of birth for the foreign-born population - Portugal (%)
Place of birth for the foreign-born population - Spain (%)
Place of birth for the foreign-born population - Other Southern Europe (%)
Place of birth for the foreign-born population - Albania (%)
Place of birth for the foreign-born population - Belarus (%)
Place of birth for the foreign-born population - Bosnia and Herzegovina (%)
Place of birth for the foreign-born population - Bulgaria (%)
Place of birth for the foreign-born population - Croatia (%)
Place of birth for the foreign-born population - Czechoslovakia (%)
Place of birth for the foreign-born population - Hungary (%)
Place of birth for the foreign-born population - Latvia (%)
Place of birth for the foreign-born population - Lithuania (%)
Place of birth for the foreign-born population - North Macedonia (Macedonia) (%)
Place of birth for the foreign-born population - Moldova (%)
Place of birth for the foreign-born population - Poland (%)
Place of birth for the foreign-born population - Romania (%)
Place of birth for the foreign-born population - Russia (%)
Place of birth for the foreign-born population - Serbia (%)
Place of birth for the foreign-born population - Ukraine (%)
Place of birth for the foreign-born population - Other Eastern Europe (%)
Place of birth for the foreign-born population - China (%)
Place of birth for the foreign-born population - Hong Kong (%)
Place of birth for the foreign-born population - Taiwan (%)
Place of birth for the foreign-born population - Japan (%)
Place of birth for the foreign-born population - Korea (%)
Place of birth for the foreign-born population - Other Eastern Asia (%)
Place of birth for the foreign-born population - Afghanistan (%)
Place of birth for the foreign-born population - Bangladesh (%)
Place of birth for the foreign-born population - India (%)
Place of birth for the foreign-born population - Iran (%)
Place of birth for the foreign-born population - Kazakhstan (%)
Place of birth for the foreign-born population - Nepal (%)
Place of birth for the foreign-born population - Pakistan (%)
Place of birth for the foreign-born population - Sri Lanka (%)
Place of birth for the foreign-born population - Uzbekistan (%)
Place of birth for the foreign-born population - Other South Central Asia (%)
Place of birth for the foreign-born population - Burma (%)
Place of birth for the foreign-born population - Cambodia (%)
Place of birth for the foreign-born population - Indonesia (%)
Place of birth for the foreign-born population - Laos (%)
Place of birth for the foreign-born population - Malaysia (%)
Place of birth for the foreign-born population - Philippines (%)
Place of birth for the foreign-born population - Singapore (%)
Place of birth for the foreign-born population - Thailand (%)
Place of birth for the foreign-born population - Vietnam (%)
Place of birth for the foreign-born population - Other South Eastern Asia (%)
Place of birth for the foreign-born population - Armenia (%)
Place of birth for the foreign-born population - Iraq (%)
Place of birth for the foreign-born population - Israel (%)
Place of birth for the foreign-born population - Jordan (%)
Place of birth for the foreign-born population - Kuwait (%)
Place of birth for the foreign-born population - Lebanon (%)
Place of birth for the foreign-born population - Saudi Arabia (%)
Place of birth for the foreign-born population - Syria (%)
Place of birth for the foreign-born population - Turkey (%)
Place of birth for the foreign-born population - Yemen (%)
Place of birth for the foreign-born population - Other Western Asia (%)
Place of birth for the foreign-born population - Eritrea (%)
Place of birth for the foreign-born population - Ethiopia (%)
Place of birth for the foreign-born population - Kenya (%)
Place of birth for the foreign-born population - Somalia (%)
Place of birth for the foreign-born population - Uganda (%)
Place of birth for the foreign-born population - Zimbabwe (%)
Place of birth for the foreign-born population - Other Eastern Africa (%)
Place of birth for the foreign-born population - Cameroon (%)
Place of birth for the foreign-born population - Congo (%)
Place of birth for the foreign-born population - Democratic Republic of Congo (Zaire) (%)
Place of birth for the foreign-born population - Other Middle Africa (%)
Place of birth for the foreign-born population - Egypt (%)
Place of birth for the foreign-born population - Morocco (%)
Place of birth for the foreign-born population - Sudan (%)
Place of birth for the foreign-born population - Other Northern Africa (%)
Place of birth for the foreign-born population - South Africa (%)
Place of birth for the foreign-born population - Other Southern Africa (%)
Place of birth for the foreign-born population - Cabo Verde (%)
Place of birth for the foreign-born population - Ghana (%)
Place of birth for the foreign-born population - Liberia (%)
Place of birth for the foreign-born population - Nigeria (%)
Place of birth for the foreign-born population - Senegal (%)
Place of birth for the foreign-born population - Sierra Leone (%)
Place of birth for the foreign-born population - Other Western Africa (%)
Place of birth for the foreign-born population - Australia (%)
Place of birth for the foreign-born population - New Zealand (%)
Place of birth for the foreign-born population - Fiji (%)
Place of birth for the foreign-born population - Micronesia (%)
Place of birth for the foreign-born population - Bahamas (%)
Place of birth for the foreign-born population - Barbados (%)
Place of birth for the foreign-born population - Cuba (%)
Place of birth for the foreign-born population - Dominica (%)
Place of birth for the foreign-born population - Dominican Republic (%)
Place of birth for the foreign-born population - Grenada (%)
Place of birth for the foreign-born population - Haiti (%)
Place of birth for the foreign-born population - Jamaica (%)
Place of birth for the foreign-born population - St. Vincent and the Grenadines (%)
Place of birth for the foreign-born population - Trinidad and Tobago (%)
Place of birth for the foreign-born population - West Indies (%)
Place of birth for the foreign-born population - Other Caribbean (%)
Place of birth for the foreign-born population - Belize (%)
Place of birth for the foreign-born population - Costa Rica (%)
Place of birth for the foreign-born population - El Salvador (%)
Place of birth for the foreign-born population - Guatemala (%)
Place of birth for the foreign-born population - Honduras (%)
Place of birth for the foreign-born population - Mexico (%)
Place of birth for the foreign-born population - Nicaragua (%)
Place of birth for the foreign-born population - Panama (%)
Place of birth for the foreign-born population - Other Central America (%)
Place of birth for the foreign-born population - Argentina (%)
Place of birth for the foreign-born population - Bolivia (%)
Place of birth for the foreign-born population - Brazil (%)
Place of birth for the foreign-born population - Chile (%)
Place of birth for the foreign-born population - Colombia (%)
Place of birth for the foreign-born population - Ecuador (%)
Place of birth for the foreign-born population - Guyana (%)
Place of birth for the foreign-born population - Peru (%)
Place of birth for the foreign-born population - Uruguay (%)
Place of birth for the foreign-born population - Venezuela (%)
Place of birth for the foreign-born population - Other South America (%)
Place of birth for the foreign-born population - Canada (%)
Place of birth for the foreign-born population - Other Northern America (%)
Place of birth for the foreign-born population - Other (%)
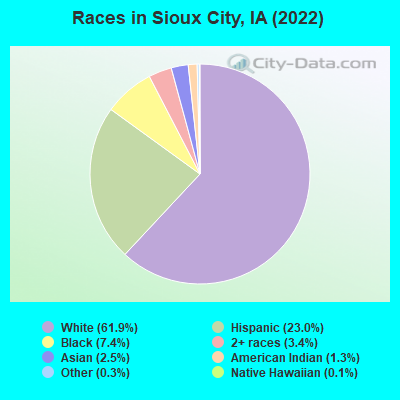
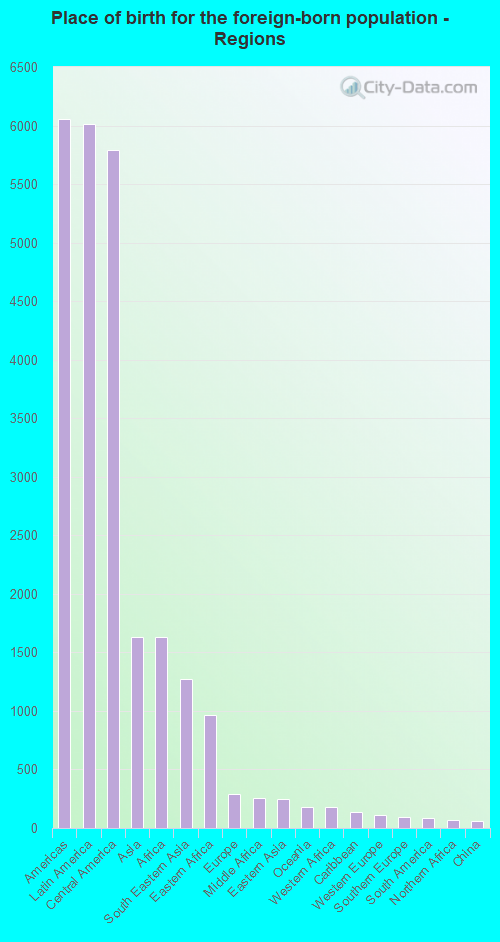
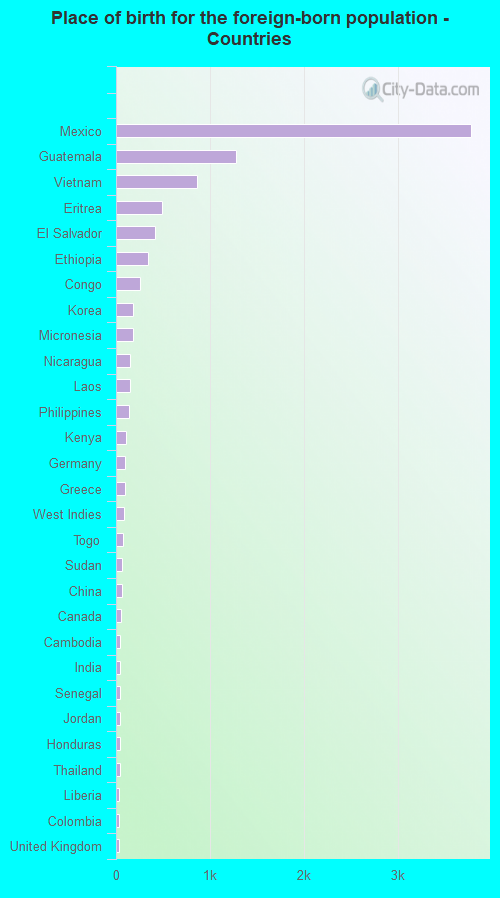
According to 2022 data, the most numerous races in Sioux City, IA are White alone (51,494 residents), Hispanic (19,130 residents), and Black alone (6,191 residents). 79.4% of Sioux City residents speak English at home. 11.4% of Sioux City, IA residents are foreign-born (6.9% born in Latin America, 1.9% born in Asia, 1.9% born in Africa), which is 56.3% greater than the foreign-born rate of 5.0% across the entire state of Iowa.
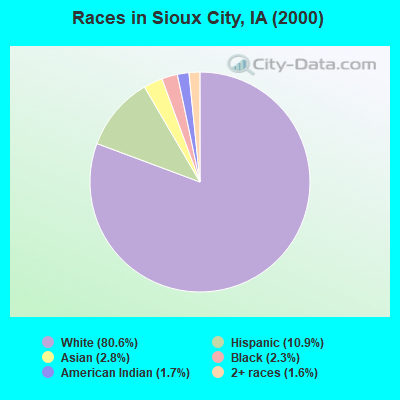
Race distribution in Sioux City
2000 2022
68,521 80.6% White alone 9,257 10.9% Hispanic 2,385 2.8% Asian alone 1,966 2.3% Black alone 1,450 1.7% American Indian alone 1,342 1.6% Two or more races 72 0.08% Other race alone 20 0.02% Native Hawaiian and Other
51,494 61.9% White alone 19,130 23.0% Hispanic 6,191 7.4% Black alone 2,817 3.4% Two or more races 2,118 2.5% Asian alone 1,116 1.3% American Indian alone 244 0.3% Other race alone 105 0.1% Native Hawaiian and Other
2000 2022
2,710,344 92.6% White alone 82,473 2.8% Hispanic 60,744 2.1% Black alone 36,345 1.2% Asian alone 25,472 0.9% Two or more races 7,955 0.3% American Indian alone 2,103 0.07% Other race alone 888 0.03% Native Hawaiian and Other
2,650,110 82.8% White alone 218,024 6.8% Hispanic 119,004 3.7% Black alone 115,286 3.6% Two or more races 74,892 2.3% Asian alone 9,260 0.3% Other race alone 8,595 0.3% Native Hawaiian and Other 5,346 0.2% American Indian alone
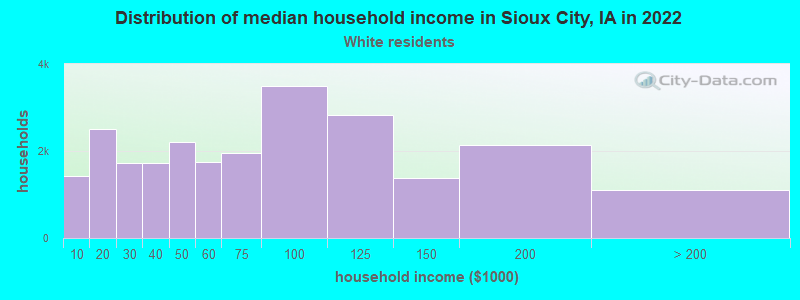
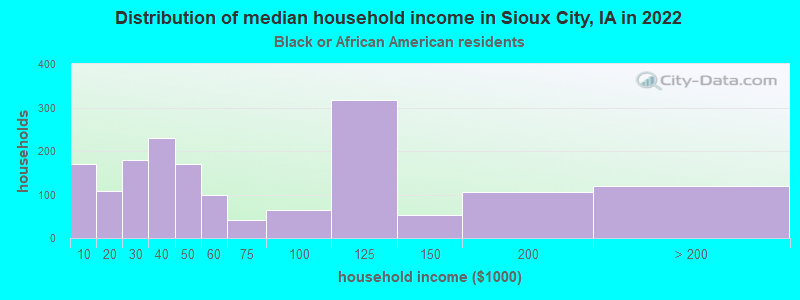
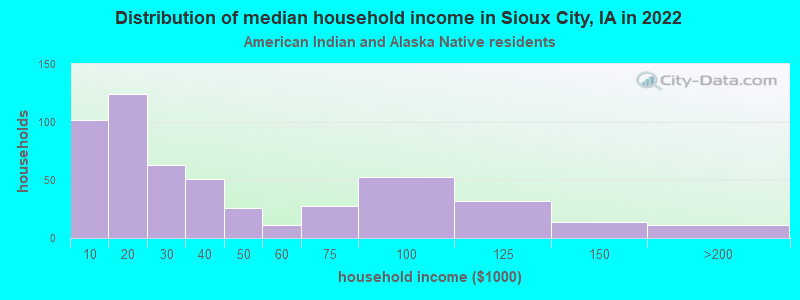
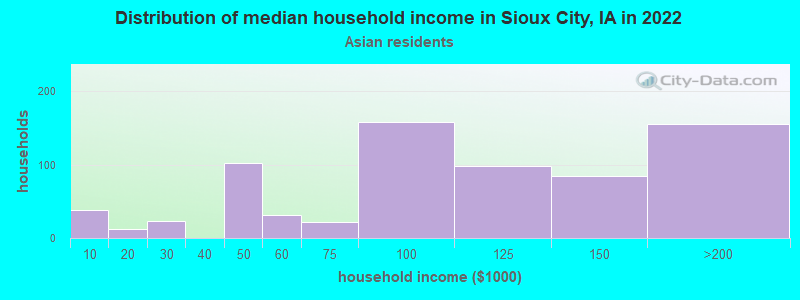
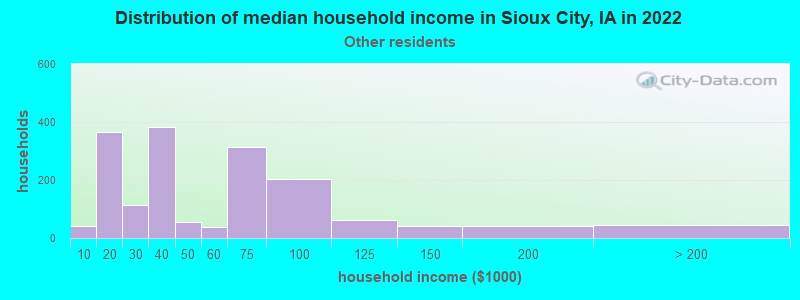
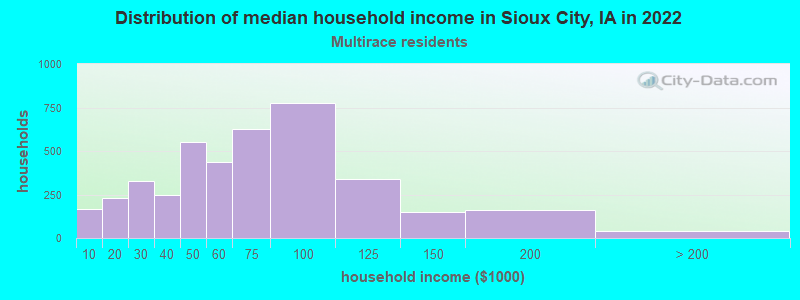
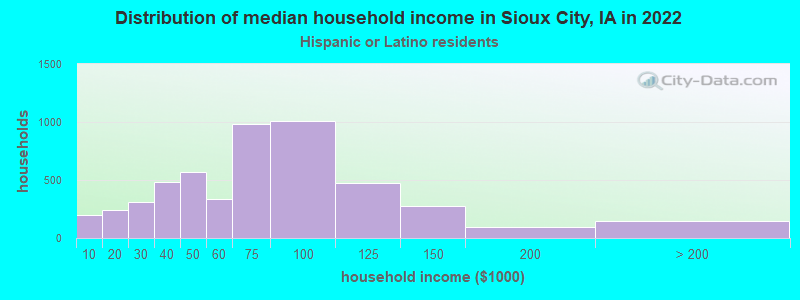
Income and house value in Sioux City Median household income in 2022 $66,325 White non-Hispanic householders$79,198 Black householders$19,992 American Indian and Alaska Native householders$59,707 Asian householders$66,671 Some other race householders$49,613 Two or more races householders$56,037 Hispanic or Latino race householdersMedian 2022 house value $175,897 White Non-Hispanic householders$124,325 Black or African American householders$51,802 American Indian or Alaska Native householders $152,183 Asian householders$125,937 Some other race householders$163,695 Two or more races householders$126,627 Hispanic or Latino householders
Median age by race in Sioux City
42.2 Median age for White residents38.3 44.4 38.1 Median age for Black or African American residents22.5 49.9 27.8 Median age for American Indian / Alaska Native residents27.6 30.3 47.4 Median age for Asian residents47.0 50.1 -666,666,666.0 Median age for Native Hawaiian / Pacific Islander residents-666,666,666.0 -666,666,666.0 29.8 Median age for Other race residents29.2 31.0 20.1 Median age for Two or more races residents20.3 19.8 43.5 Median age for White alone residents41.1 44.6 25.3 Median age for Hispanic or Latino residents22.1 28.1
Owner/renter occupied households by race in Sioux City
House owners and renters - White residents 16,956 70.0% Owner occupied7,275 30.0% Renter occupiedHouse owners and renters - Black or African American residents 765 36.2% Owner occupied1,347 63.8% Renter occupiedHouse owners and renters - American Indian / Alaska Native residents 129 20.6% Owner occupied498 79.4% Renter occupiedHouse owners and renters - Asian residents 566 78.9% Owner occupied151 21.1% Renter occupiedHouse owners and renters - Native Hawaiian / Pacific Islander residents 106 100.0% Renter occupiedHouse owners and renters - Other race residents 970 60.1% Owner occupied645 39.9% Renter occupiedHouse owners and renters - Two or more races residents 1,908 51.9% Owner occupied1,767 48.1% Renter occupiedHouse owners and renters - White alone residents 16,212 69.7% Owner occupied7,056 30.3% Renter occupiedHouse owners and renters - Hispanic or Latino residents 3,222 57.9% Owner occupied2,341 42.1% Renter occupied
Language usage in Sioux City
English speakers - Total 79.4% of residents of Sioux City speak English at home.
16.4% of residents speak Spanish at home 6,817 54.2% Speak English very well5,771 45.8% Speak English less than very well4.3% of residents speak other language at home 1,706 52.2% Speak English very well1,562 47.8% Speak English less than very well
English speakers - Born in the United States 79.8% of residents of Sioux City speak English at home.
17.2% of residents speak Spanish at home 2,565 69.4% Speak English very well1,133 30.6% Speak English less than very well3.0% of residents speak other language at home 324 50.5% Speak English very well317 49.5% Speak English less than very well
All residents speak only English at home
English speakers - Foreign-born 8.0% of residents of Sioux City speak English at home.
62.6% of residents speak Spanish at home 1,007 19.3% Speak English very well4,211 80.7% Speak English less than very well29.5% of residents speak other language at home 1,210 49.3% Speak English very well1,245 50.7% Speak English less than very well
White (Caucasian) - Speak only English Native:
95.0% (48,948)Foreign-born:
13.9% (78)
White (Caucasian) - Speak another language Native:
5.0% (2,561)Foreign-born:
86.1% (484)
Black or African American - Speak only English Native:
87.2% (2,189)Foreign-born:
12.0% (207)
Black or African American - Speak another language Native:
12.7% (319)Foreign-born:
89.7% (1,547)
American Indian / Alaska Native - Speak another language Native:
13.4% (217)Foreign-born:
93.5% (120)
Asian - Speak only English Native:
31.7% (194)Foreign-born:
16.9% (255)
Asian - Speak another language Native:
67.1% (410)Foreign-born:
83.0% (1,251)
Native Hawaiian / Pacific Islander - Speak another language Native:
14.7% (86)Foreign-born:
93.3% (275)
Other race - Speak only English Native:
55.0% (1,421)Foreign-born:
4.5% (69)
Other race - Speak another language Native:
45.0% (1,162)Foreign-born:
95.5% (1,469)
Two or more races - Speak only English Native:
47.2% (3,354)Foreign-born:
3.3% (119)
Two or more races - Speak another language Native:
52.8% (3,747)Foreign-born:
96.7% (3,434)
White alone - Speak only English Native:
98.0% (47,937)Foreign-born:
31.6% (78)
White alone - Speak another language Native:
2.0% (998)Foreign-born:
68.4% (169)
Hispanic or Latino - Speak only English Native:
43.3% (4,999)Foreign-born:
2.3% (124)
Hispanic or Latino - Speak another language Native:
56.7% (6,548)Foreign-born:
97.7% (5,218)
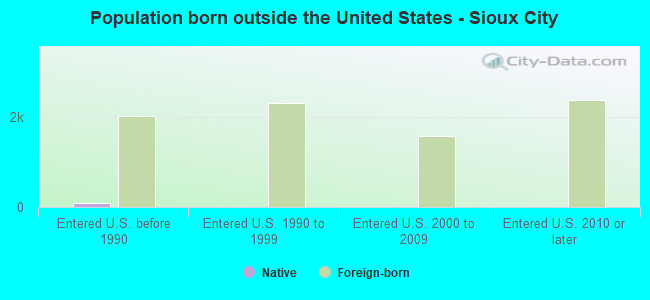
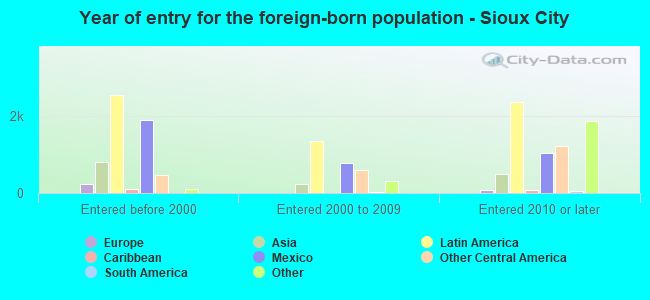
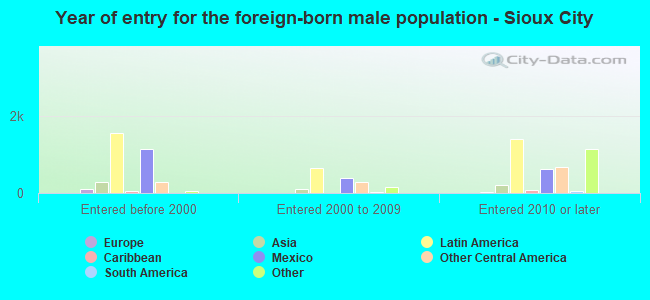
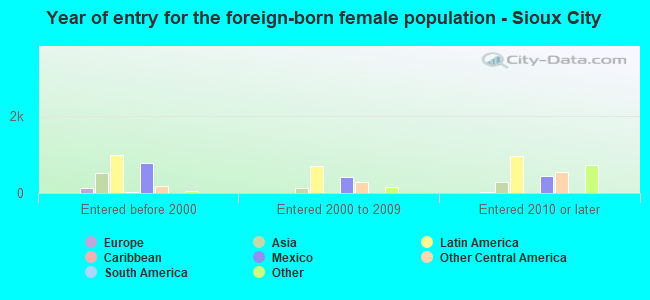
Foreign-born residents in Sioux City 9,796 residents are foreign born (6.9% Latin America , 1.9% Asia , 1.9% Africa ).
Marital status for residents in Sioux City Marital status - White (Caucasian) population 15 years and over
Males 37.9% Never married49.0% Now married0.4% Separated3.0% Widowed9.7% DivorcedFemales 28.7% Never married41.0% Now married1.5% Separated10.2% Widowed18.6% DivorcedWomen who gave birth in the past 12 months Now married:
48.7% (129)Unmarried:
51.3% (136)
Women who did not give birth in the past 12 months Now married:
36.5% (4,212)Unmarried:
63.5% (7,312)
Marital status - Black or African American population 15 years and over
Males 59.2% Never married32.3% Now married2.9% Separated0.3% Widowed5.4% DivorcedFemales 63.5% Never married22.0% Now married5.2% Separated4.8% Widowed4.5% DivorcedWomen who gave birth in the past 12 months Now married:
60.0% (41)Unmarried:
40.0% (27)
Women who did not give birth in the past 12 months Now married:
24.0% (283)Unmarried:
76.0% (897)
Marital status - American Indian / Alaska Native population 15 years and over
Males 69.1% Never married16.8% Now married2.4% Separated8.1% Widowed3.6% DivorcedFemales 58.4% Never married12.1% Now married4.3% Separated6.4% Widowed18.8% DivorcedWomen who gave birth in the past 12 months Now married:
45.2% (15)Unmarried:
54.8% (18)
Women who did not give birth in the past 12 months Now married:
14.9% (63)Unmarried:
85.1% (359)
Marital status - Asian population 15 years and over
Males 45.7% Never married48.5% Now married0.0% Separated1.8% Widowed4.0% DivorcedFemales 21.8% Never married55.9% Now married4.8% Separated10.2% Widowed7.2% DivorcedWomen who gave birth in the past 12 months Now married:
0.0% (0)Unmarried:
100.0% (43)
Women who did not give birth in the past 12 months Now married:
62.4% (327)Unmarried:
37.6% (197)
Marital status - Native Hawaiian / Pacific Islander population 15 years and over
Males 12.0% Never married88.0% Now married0.0% Separated0.0% Widowed0.0% DivorcedFemales 65.9% Never married34.1% Now married0.0% Separated0.0% Widowed0.0% DivorcedWomen who did not give birth in the past 12 months Now married:
33.9% (263)Unmarried:
66.1% (512)
Marital status - Other race population 15 years and over
Males 28.4% Never married56.7% Now married4.8% Separated1.9% Widowed8.2% DivorcedFemales 42.9% Never married40.2% Now married1.7% Separated0.9% Widowed14.2% DivorcedWomen who gave birth in the past 12 months Now married:
100.0% (5)Unmarried:
0.0% (0)
Women who did not give birth in the past 12 months Now married:
46.9% (655)Unmarried:
53.1% (741)
Marital status - Two or more races population 15 years and over
Males 49.3% Never married41.3% Now married3.6% Separated1.0% Widowed4.7% DivorcedFemales 51.9% Never married34.5% Now married3.8% Separated2.5% Widowed7.2% DivorcedWomen who gave birth in the past 12 months Now married:
35.0% (198)Unmarried:
65.0% (368)
Women who did not give birth in the past 12 months Now married:
27.5% (796)Unmarried:
72.5% (2,095)
Marital status - White alone, not Hispanic / Latino population 15 years and over
Males 35.7% Never married51.0% Now married0.4% Separated3.2% Widowed9.6% DivorcedFemales 27.4% Never married41.4% Now married1.6% Separated10.5% Widowed19.1% DivorcedWomen who gave birth in the past 12 months Now married:
47.1% (56)Unmarried:
52.9% (63)
Women who did not give birth in the past 12 months Now married:
37.3% (4,116)Unmarried:
62.7% (6,916)
Marital status - Hispanic or Latino population 15 years and over
Males 46.3% Never married41.7% Now married3.3% Separated1.1% Widowed7.5% DivorcedFemales 45.7% Never married41.1% Now married3.1% Separated1.0% Widowed9.2% DivorcedWomen who gave birth in the past 12 months Now married:
51.8% (566)Unmarried:
48.2% (526)
Women who did not give birth in the past 12 months Now married:
30.1% (1,075)Unmarried:
69.9% (2,497)
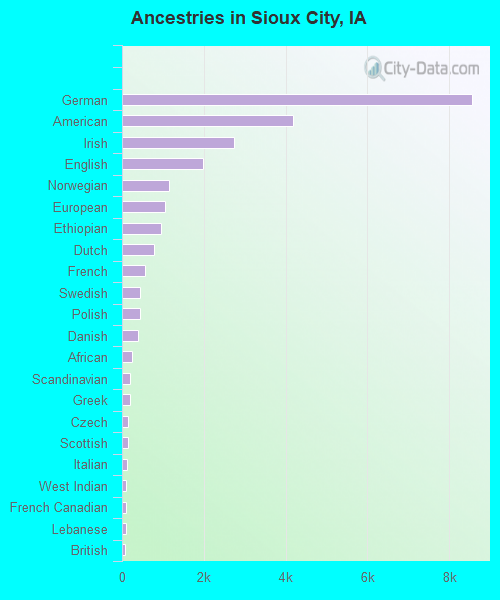
Ancestries in Sioux City
8,550 18.0% German4,176 8.8% American2,738 5.8% Irish1,980 4.2% English1,155 2.4% Norwegian1,064 2.2% European949 2.0% Ethiopian776 1.6% Dutch563 1.2% French448 0.9% Swedish439 0.9% Polish381 0.8% Danish236 0.5% African199 0.4% Scandinavian194 0.4% Greek145 0.3% Czech140 0.3% Scottish133 0.3% Italian108 0.2% West Indian100 0.2% French Canadian94 0.2% Lebanese81 0.2% British67 0.1% Luxembourger63 0.1% Eastern European59 0.1% Somali52 0.1% Russian43 0.09% Senegalese42 0.09% Sudanese33 0.07% Scotch-Irish30 0.06% Northern European27 0.06% Welsh26 0.05% Hungarian25 0.05% Syrian25 0.05% Romanian21 0.04% Lithuanian18 0.04% Jordanian16 0.03% German Russian14 0.03% Pennsylvania German11 0.02% Egyptian11 0.02% Cypriot11 0.02% Iranian11 0.02% Icelander10 0.02% Czechoslovakian8 0.02% Turkish6 0.01% Ukrainian6 0.01% Slovak5 0.01% Arab4 0.01% Cape Verdean
Geographical mobility in Sioux City Same house 1 year ago 50,146 92.2% White (Caucasian)3,724 83.2% Black or African American2,200 94.8% American Indian / Alaska Native1,983 93.0% Asian6 1.0% Native Hawaiian / Pacific Islander3,927 84.7% Other race13,717 94.2% Two or more races47,308 92.1% White alone, not Hispanic / Latino16,863 91.1% Hispanic or LatinoMoved within same county 2,363 4.3% White / Caucasian138 3.1% Black or African American25 1.1% American Indian / Alaska Native36 1.7% Asian204 32.6% Native Hawaiian / Pacific Islander210 4.5% Other race456 3.1% Two or more races2,185 4.3% White alone, not Hispanic / Latino798 4.3% Hispanic or LatinoMoved within same state 535 1.0% White / Caucasian219 4.9% Black or African American29 1.2% American Indian / Alaska Native51 2.4% Asian136 2.9% Other race111 0.8% Two or more races535 1.0% White alone, not Hispanic / Latino484 2.6% Hispanic or LatinoMoved from different state 1,232 2.3% White / Caucasian349 7.8% Black or African American67 2.9% American Indian / Alaska Native35 1.6% Asian303 48.4% Native Hawaiian / Pacific Islander92 2.0% Other race476 3.3% Two or more races1,232 2.4% White alone, not Hispanic / Latino304 1.6% Hispanic or LatinoMoved from abroad 94 0.2% White29 0.6% Black or African American44 2.1% Asian70 11.2% Native Hawaiian / Pacific Islander49 1.1% Other race94 0.2% White alone, not Hispanic / Latino66 0.4% Hispanic or Latino
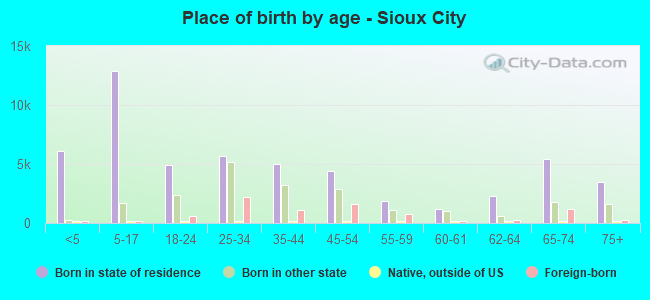
Children Nativity (place of birth) in Sioux City
Children under 6 years - Living with two parents Both parents native 3,012 100.0% NativeBoth parents foreign-born 658 100.0% NativeOne native, one foreign-born parent 590 100.0% NativeChildren under 6 years - Living with one parent Native parent 1,884 100.0% NativeForeign-born parent 722 100.0% NativeChildren 6 to 17 years - Living with two parents Both parents native 7,262 99.8% Native14 0.2% Foreign-bornBoth parents foreign-born 1,119 83.4% Native223 16.6% Foreign-bornOne native, one foreign-born parent 877 100.0% NativeChildren 6 to 17 years - Living with one parent Native parent 3,934 100.0% NativeForeign-born parent 1,025 50.0% Native1,025 50.0% Foreign-born
Grandparents responsible for own grandchildren in Sioux City
Grandparents (30 to 59 years) White / Caucasian 63 14.6% Responsible for grandchildren366 85.4% Not responsible for grandchildrenBlack or African American 7 100.0% Not responsible for grandchildrenAsian 7 60.3% Responsible for grandchildren5 39.7% Not responsible for grandchildrenWhite alone, not Hispanic / Latino 56 17.4% Responsible for grandchildren268 82.6% Not responsible for grandchildrenHispanic or Latino 8 9.1% Responsible for grandchildren78 90.9% Not responsible for grandchildrenGrandparents (60 years and over) White / Caucasian 91 30.5% Responsible for grandchildren207 69.5% Not responsible for grandchildrenBlack or African American 15 100.0% Not responsible for grandchildrenAsian 2 100.0% Not responsible for grandchildrenWhite alone, not Hispanic / Latino 70 29.5% Responsible for grandchildren168 70.5% Not responsible for grandchildrenHispanic or Latino 11 14.1% Responsible for grandchildren67 85.9% Not responsible for grandchildren