Races in Smithfield, North Carolina (NC) Detailed Stats
Data:
Races - White alone (%)
Races - White alone (% change since 2000)
Races - Black alone (%)
Races - Black alone (% change since 2000)
Races - American Indian alone (%)
Races - American Indian alone (% change since 2000)
Races - Asian alone (%)
Races - Asian alone (% change since 2000)
Races - Hispanic (%)
Races - Hispanic (% change since 2000)
Races - Native Hawaiian and Other Pacific Islander alone (%)
Races - Native Hawaiian and Other Pacific Islander alone (% change since 2000)
Races - Two or more races(%)
Races - Two or more races(% change since 2000)
Races - Other race alone (%)
Races - Other race alone (% change since 2000)
Racial diversity
Place of birth - Born in state of residence (%)
Place of birth - Born in state of residence (%) - White
Place of birth - Born in state of residence (%) - Black or African American
Place of birth - Born in state of residence (%) - Asian
Place of birth - Born in state of residence (%) - Hispanic or Latino
Place of birth - Born in state of residence (%) - American Indian and Alaska Native
Place of birth - Born in state of residence (%) - Multirace
Place of birth - Born in state of residence (%) - Other Race
Place of birth - Born in other state (%)
Place of birth - Born in other state (%) - White
Place of birth - Born in other state (%) - Black or African American
Place of birth - Born in other state (%) - Asian
Place of birth - Born in other state (%) - Hispanic or Latino
Place of birth - Born in other state (%) - American Indian and Alaska Native
Place of birth - Born in other state (%) - Multirace
Place of birth - Born in other state (%) - Other Race
Place of birth - Native, outside of US (%)
Place of birth - Native, outside of US (%) - White
Place of birth - Native, outside of US (%) - Black or African American
Place of birth - Native, outside of US (%) - Asian
Place of birth - Native, outside of US (%) - Hispanic or Latino
Place of birth - Native, outside of US (%) - American Indian and Alaska Native
Place of birth - Native, outside of US (%) - Multirace
Place of birth - Native, outside of US (%) - Other Race
Place of birth - Foreign born (%)
Place of birth - Foreign born (%) - White
Place of birth - Foreign born (%) - Black or African American
Place of birth - Foreign born (%) - Asian
Place of birth - Foreign born (%) - Hispanic or Latino
Place of birth - Foreign born (%) - American Indian and Alaska Native
Place of birth - Foreign born (%) - Multirace
Place of birth - Foreign born (%) - Other Race
Residents speaking English at home (%)
Residents speaking English at home - Born in the United States (%)
Residents speaking English at home - Native, born elsewhere (%)
Residents speaking English at home - Foreign born (%)
Residents speaking Spanish at home (%)
Residents speaking Spanish at home - Born in the United States (%)
Residents speaking Spanish at home - Native, born elsewhere (%)
Residents speaking Spanish at home - Foreign born (%)
Residents speaking other language at home (%)
Residents speaking other language at home - Born in the United States (%)
Residents speaking other language at home - Native, born elsewhere (%)
Residents speaking other language at home - Foreign born (%)
Marital status - Never married (%)
Marital status - Now married (%)
Marital status - Separated (%)
Marital status - Widowed (%)
Marital status - Divorced (%)
Ancestries Reported - Arab (%)
Ancestries Reported - Czech (%)
Ancestries Reported - Danish (%)
Ancestries Reported - Dutch (%)
Ancestries Reported - English (%)
Ancestries Reported - French (%)
Ancestries Reported - French Canadian (%)
Ancestries Reported - German (%)
Ancestries Reported - Greek (%)
Ancestries Reported - Hungarian (%)
Ancestries Reported - Irish (%)
Ancestries Reported - Italian (%)
Ancestries Reported - Lithuanian (%)
Ancestries Reported - Norwegian (%)
Ancestries Reported - Polish (%)
Ancestries Reported - Portuguese (%)
Ancestries Reported - Russian (%)
Ancestries Reported - Scotch-Irish (%)
Ancestries Reported - Scottish (%)
Ancestries Reported - Slovak (%)
Ancestries Reported - Subsaharan African (%)
Ancestries Reported - Swedish (%)
Ancestries Reported - Swiss (%)
Ancestries Reported - Ukrainian (%)
Ancestries Reported - United States (%)
Ancestries Reported - Welsh (%)
Ancestries Reported - West Indian (%)
Ancestries Reported - Other (%)
Geographical mobility - Same house 1 year ago (%)
Geographical mobility - Same house 1 year ago (%) - White
Geographical mobility - Same house 1 year ago (%) - Black or African American
Geographical mobility - Same house 1 year ago (%) - Asian
Geographical mobility - Same house 1 year ago (%) - Hispanic or Latino
Geographical mobility - Same house 1 year ago (%) - American Indian and Alaska Native
Geographical mobility - Same house 1 year ago (%) - Multirace
Geographical mobility - Same house 1 year ago (%) - Other Race
Geographical mobility - Moved within same county (%)
Geographical mobility - Moved within same county (%) - White
Geographical mobility - Moved within same county (%) - Black or African American
Geographical mobility - Moved within same county (%) - Asian
Geographical mobility - Moved within same county (%) - Hispanic or Latino
Geographical mobility - Moved within same county (%) - American Indian and Alaska Native
Geographical mobility - Moved within same county (%) - Multirace
Geographical mobility - Moved within same county (%) - Other Race
Geographical mobility - Moved from different county within same state (%)
Geographical mobility - Moved from different county within same state (%) - White
Geographical mobility - Moved from different county within same state (%) - Black or African American
Geographical mobility - Moved from different county within same state (%) - Asian
Geographical mobility - Moved from different county within same state (%) - Hispanic or Latino
Geographical mobility - Moved from different county within same state (%) - American Indian and Alaska Native
Geographical mobility - Moved from different county within same state (%) - Multirace
Geographical mobility - Moved from different county within same state (%) - Other Race
Geographical mobility - Moved from different state (%)
Geographical mobility - Moved from different state (%) - White
Geographical mobility - Moved from different state (%) - Black or African American
Geographical mobility - Moved from different state (%) - Asian
Geographical mobility - Moved from different state (%) - Hispanic or Latino
Geographical mobility - Moved from different state (%) - American Indian and Alaska Native
Geographical mobility - Moved from different state (%) - Multirace
Geographical mobility - Moved from different state (%) - Other Race
Geographical mobility - Moved from abroad (%)
Geographical mobility - Moved from abroad (%) - White
Geographical mobility - Moved from abroad (%) - Black or African American
Geographical mobility - Moved from abroad (%) - Asian
Geographical mobility - Moved from abroad (%) - Hispanic or Latino
Geographical mobility - Moved from abroad (%) - American Indian and Alaska Native
Geographical mobility - Moved from abroad (%) - Multirace
Geographical mobility - Moved from abroad (%) - Other Race
Place of birth for the foreign-born population - Ireland (%)
Place of birth for the foreign-born population - Denmark (%)
Place of birth for the foreign-born population - Norway (%)
Place of birth for the foreign-born population - Sweden (%)
Place of birth for the foreign-born population - United Kingdom (%)
Place of birth for the foreign-born population - England (%)
Place of birth for the foreign-born population - Scotland (%)
Place of birth for the foreign-born population - Other Northern Europe (%)
Place of birth for the foreign-born population - Austria (%)
Place of birth for the foreign-born population - Belgium (%)
Place of birth for the foreign-born population - France (%)
Place of birth for the foreign-born population - Germany (%)
Place of birth for the foreign-born population - Netherlands (%)
Place of birth for the foreign-born population - Switzerland (%)
Place of birth for the foreign-born population - Other Western Europe (%)
Place of birth for the foreign-born population - Greece (%)
Place of birth for the foreign-born population - Italy (%)
Place of birth for the foreign-born population - Portugal (%)
Place of birth for the foreign-born population - Spain (%)
Place of birth for the foreign-born population - Other Southern Europe (%)
Place of birth for the foreign-born population - Albania (%)
Place of birth for the foreign-born population - Belarus (%)
Place of birth for the foreign-born population - Bosnia and Herzegovina (%)
Place of birth for the foreign-born population - Bulgaria (%)
Place of birth for the foreign-born population - Croatia (%)
Place of birth for the foreign-born population - Czechoslovakia (%)
Place of birth for the foreign-born population - Hungary (%)
Place of birth for the foreign-born population - Latvia (%)
Place of birth for the foreign-born population - Lithuania (%)
Place of birth for the foreign-born population - North Macedonia (Macedonia) (%)
Place of birth for the foreign-born population - Moldova (%)
Place of birth for the foreign-born population - Poland (%)
Place of birth for the foreign-born population - Romania (%)
Place of birth for the foreign-born population - Russia (%)
Place of birth for the foreign-born population - Serbia (%)
Place of birth for the foreign-born population - Ukraine (%)
Place of birth for the foreign-born population - Other Eastern Europe (%)
Place of birth for the foreign-born population - China (%)
Place of birth for the foreign-born population - Hong Kong (%)
Place of birth for the foreign-born population - Taiwan (%)
Place of birth for the foreign-born population - Japan (%)
Place of birth for the foreign-born population - Korea (%)
Place of birth for the foreign-born population - Other Eastern Asia (%)
Place of birth for the foreign-born population - Afghanistan (%)
Place of birth for the foreign-born population - Bangladesh (%)
Place of birth for the foreign-born population - India (%)
Place of birth for the foreign-born population - Iran (%)
Place of birth for the foreign-born population - Kazakhstan (%)
Place of birth for the foreign-born population - Nepal (%)
Place of birth for the foreign-born population - Pakistan (%)
Place of birth for the foreign-born population - Sri Lanka (%)
Place of birth for the foreign-born population - Uzbekistan (%)
Place of birth for the foreign-born population - Other South Central Asia (%)
Place of birth for the foreign-born population - Burma (%)
Place of birth for the foreign-born population - Cambodia (%)
Place of birth for the foreign-born population - Indonesia (%)
Place of birth for the foreign-born population - Laos (%)
Place of birth for the foreign-born population - Malaysia (%)
Place of birth for the foreign-born population - Philippines (%)
Place of birth for the foreign-born population - Singapore (%)
Place of birth for the foreign-born population - Thailand (%)
Place of birth for the foreign-born population - Vietnam (%)
Place of birth for the foreign-born population - Other South Eastern Asia (%)
Place of birth for the foreign-born population - Armenia (%)
Place of birth for the foreign-born population - Iraq (%)
Place of birth for the foreign-born population - Israel (%)
Place of birth for the foreign-born population - Jordan (%)
Place of birth for the foreign-born population - Kuwait (%)
Place of birth for the foreign-born population - Lebanon (%)
Place of birth for the foreign-born population - Saudi Arabia (%)
Place of birth for the foreign-born population - Syria (%)
Place of birth for the foreign-born population - Turkey (%)
Place of birth for the foreign-born population - Yemen (%)
Place of birth for the foreign-born population - Other Western Asia (%)
Place of birth for the foreign-born population - Eritrea (%)
Place of birth for the foreign-born population - Ethiopia (%)
Place of birth for the foreign-born population - Kenya (%)
Place of birth for the foreign-born population - Somalia (%)
Place of birth for the foreign-born population - Uganda (%)
Place of birth for the foreign-born population - Zimbabwe (%)
Place of birth for the foreign-born population - Other Eastern Africa (%)
Place of birth for the foreign-born population - Cameroon (%)
Place of birth for the foreign-born population - Congo (%)
Place of birth for the foreign-born population - Democratic Republic of Congo (Zaire) (%)
Place of birth for the foreign-born population - Other Middle Africa (%)
Place of birth for the foreign-born population - Egypt (%)
Place of birth for the foreign-born population - Morocco (%)
Place of birth for the foreign-born population - Sudan (%)
Place of birth for the foreign-born population - Other Northern Africa (%)
Place of birth for the foreign-born population - South Africa (%)
Place of birth for the foreign-born population - Other Southern Africa (%)
Place of birth for the foreign-born population - Cabo Verde (%)
Place of birth for the foreign-born population - Ghana (%)
Place of birth for the foreign-born population - Liberia (%)
Place of birth for the foreign-born population - Nigeria (%)
Place of birth for the foreign-born population - Senegal (%)
Place of birth for the foreign-born population - Sierra Leone (%)
Place of birth for the foreign-born population - Other Western Africa (%)
Place of birth for the foreign-born population - Australia (%)
Place of birth for the foreign-born population - New Zealand (%)
Place of birth for the foreign-born population - Fiji (%)
Place of birth for the foreign-born population - Micronesia (%)
Place of birth for the foreign-born population - Bahamas (%)
Place of birth for the foreign-born population - Barbados (%)
Place of birth for the foreign-born population - Cuba (%)
Place of birth for the foreign-born population - Dominica (%)
Place of birth for the foreign-born population - Dominican Republic (%)
Place of birth for the foreign-born population - Grenada (%)
Place of birth for the foreign-born population - Haiti (%)
Place of birth for the foreign-born population - Jamaica (%)
Place of birth for the foreign-born population - St. Vincent and the Grenadines (%)
Place of birth for the foreign-born population - Trinidad and Tobago (%)
Place of birth for the foreign-born population - West Indies (%)
Place of birth for the foreign-born population - Other Caribbean (%)
Place of birth for the foreign-born population - Belize (%)
Place of birth for the foreign-born population - Costa Rica (%)
Place of birth for the foreign-born population - El Salvador (%)
Place of birth for the foreign-born population - Guatemala (%)
Place of birth for the foreign-born population - Honduras (%)
Place of birth for the foreign-born population - Mexico (%)
Place of birth for the foreign-born population - Nicaragua (%)
Place of birth for the foreign-born population - Panama (%)
Place of birth for the foreign-born population - Other Central America (%)
Place of birth for the foreign-born population - Argentina (%)
Place of birth for the foreign-born population - Bolivia (%)
Place of birth for the foreign-born population - Brazil (%)
Place of birth for the foreign-born population - Chile (%)
Place of birth for the foreign-born population - Colombia (%)
Place of birth for the foreign-born population - Ecuador (%)
Place of birth for the foreign-born population - Guyana (%)
Place of birth for the foreign-born population - Peru (%)
Place of birth for the foreign-born population - Uruguay (%)
Place of birth for the foreign-born population - Venezuela (%)
Place of birth for the foreign-born population - Other South America (%)
Place of birth for the foreign-born population - Canada (%)
Place of birth for the foreign-born population - Other Northern America (%)
Place of birth for the foreign-born population - Other (%)
Latest news about races in Smithfield, NC collected exclusively by city-data.com from local newspapers, TV, and radio stations
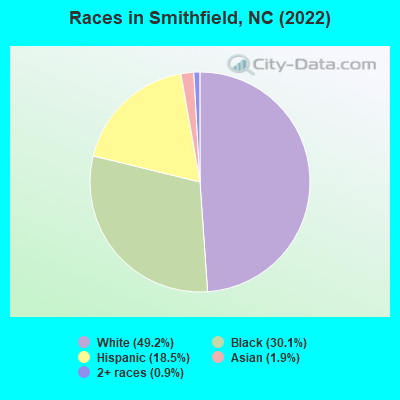
According to 2022 data, the most numerous races in Smithfield, NC are White alone (6,074 residents), Black alone (3,716 residents), and Hispanic (2,289 residents). 85.5% of Smithfield residents speak English at home. 8.9% of Smithfield, NC residents are foreign-born (7.5% born in Latin America, 1.2% born in Asia), which is 10.0% greater than the foreign-born rate of 8.0% across the entire state of North Carolina.
Race distribution in Smithfield
2000 2022
5,647,155 70.2% White alone 1,723,301 21.4% Black alone 378,963 4.7% Hispanic 112,416 1.4% Asian alone 95,333 1.2% American Indian alone 79,965 1.0% Two or more races 9,015 0.1% Other race alone 3,165 0.04% Native Hawaiian and Other
6,497,519 60.7% White alone 2,155,650 20.1% Black alone 1,114,799 10.4% Hispanic 438,061 4.1% Two or more races 341,052 3.2% Asian alone 91,758 0.9% American Indian alone 50,180 0.5% Other race alone 9,954 0.09% Native Hawaiian and Other
Income and house value in Smithfield Median household income in 2022 $48,247 White non-Hispanic householders$25,223 Black householders$71,044 Some other race householders$50,443 Hispanic or Latino race householdersMedian 2022 house value $271,628 White Non-Hispanic householders$165,485 Black or African American householders $229,171 Asian householders$117,721 Some other race householders$370,533 Two or more races householders$154,871 Hispanic or Latino householders
Median age by race in Smithfield
51.1 Median age for White residents46.1 51.0 40.2 Median age for Black or African American residents46.4 34.9 60.0 Median age for American Indian / Alaska Native residents-413,333,332.9 -828,729,280.9 27.0 Median age for Asian residents27.4 7.4 -609,884,331.7 Median age for Native Hawaiian / Pacific Islander residents-611,708,482.1 -666,666,666.0 29.3 Median age for Other race residents30.4 15.8 19.3 Median age for Two or more races residents17.3 17.0 53.0 Median age for White alone residents52.2 54.4 24.0 Median age for Hispanic or Latino residents29.2 17.8
Owner/renter occupied households by race in Smithfield
House owners and renters - White residents 1,822 64.2% Owner occupied1,017 35.8% Renter occupiedHouse owners and renters - Black or African American residents 462 32.2% Owner occupied971 67.8% Renter occupiedHouse owners and renters - American Indian / Alaska Native residents 18 100.0% Owner occupiedHouse owners and renters - Asian residents 10 100.0% Renter occupiedHouse owners and renters - Other race residents 155 36.5% Owner occupied270 63.5% Renter occupiedHouse owners and renters - Two or more races residents 8 48.8% Owner occupied8 51.2% Renter occupiedHouse owners and renters - White alone residents 1,788 63.9% Owner occupied1,012 36.1% Renter occupiedHouse owners and renters - Hispanic or Latino residents 220 49.4% Owner occupied226 50.6% Renter occupied
Language usage in Smithfield
English speakers - Total 85.5% of residents of Smithfield speak English at home.
14.6% of residents speak Spanish at home 1,065 61.6% Speak English very well664 38.4% Speak English less than very well0.2% of residents speak other language at home 8 27.6% Speak English very well21 72.4% Speak English less than very well
English speakers - Born in the United States 93.5% of residents of Smithfield speak English at home.
7.6% of residents speak Spanish at home 146 68.5% Speak English very well67 31.5% Speak English less than very well
English speakers - Native, born elsewhere 57.8% of residents of Smithfield speak English at home.
33.7% of residents speak Spanish at home 22 78.6% Speak English very well6 21.4% Speak English less than very well3.6% of residents speak other language at home 3 100.0% Speak English very well
English speakers - Foreign-born 17.3% of residents of Smithfield speak English at home.
82.9% of residents speak Spanish at home 335 33.0% Speak English very well681 67.0% Speak English less than very well2.4% of residents speak other language at home 4 13.8% Speak English very well25 86.2% Speak English less than very well
White (Caucasian) - Speak only English Native:
93.7% (5,892)Foreign-born:
16.2% (39)
White (Caucasian) - Speak another language Native:
6.5% (406)Foreign-born:
73.8% (177)
Black or African American - Speak only English Native:
100.0% (3,218)Foreign-born:
6.7% (6)
Asian - Speak only English Native:
99.5% (80)Foreign-born:
63.8% (92)
Other race - Speak only English Native:
5.2% (20)Foreign-born:
4.9% (43)
Other race - Speak another language Native:
74.9% (285)Foreign-born:
95.0% (826)
White alone - Speak only English Native:
96.9% (5,718)Foreign-born:
100.0% (32)
Hispanic or Latino - Speak only English Native:
51.7% (533)Foreign-born:
2.0% (21)
Hispanic or Latino - Speak another language Native:
52.7% (543)Foreign-born:
98.6% (1,035)
Foreign-born residents in Smithfield 1,098 residents are foreign born (7.5% Latin America , 1.2% Asia ).
This city:
8.9%North Carolina:
8.3%
Marital status for residents in Smithfield Marital status - White (Caucasian) population 15 years and over
Males 27.5% Never married45.4% Now married0.4% Separated7.0% Widowed19.6% DivorcedFemales 16.7% Never married46.7% Now married5.9% Separated13.2% Widowed17.4% DivorcedWomen who gave birth in the past 12 months Now married:
100.0% (18)Unmarried:
0.0% (0)
Women who did not give birth in the past 12 months Now married:
55.8% (678)Unmarried:
44.2% (536)
Marital status - Black or African American population 15 years and over
Males 57.7% Never married19.4% Now married6.9% Separated0.3% Widowed15.7% DivorcedFemales 46.4% Never married19.4% Now married13.7% Separated10.1% Widowed10.3% DivorcedWomen who did not give birth in the past 12 months Now married:
40.3% (271)Unmarried:
59.7% (401)
Marital status - American Indian / Alaska Native population 15 years and over
Males 75.0% Never married25.0% Now married0.0% Separated0.0% Widowed0.0% DivorcedFemales 100.0% Never married0.0% Now married0.0% Separated0.0% Widowed0.0% DivorcedWomen who did not give birth in the past 12 months Now married:
0.0% (0)Unmarried:
100.0% (5)
Marital status - Asian population 15 years and over
Males 50.7% Never married49.3% Now married0.0% Separated0.0% Widowed0.0% DivorcedFemales 16.1% Never married83.9% Now married0.0% Separated0.0% Widowed0.0% DivorcedWomen who did not give birth in the past 12 months Now married:
68.7% (12)Unmarried:
31.2% (5)
Marital status - Other race population 15 years and over
Males 58.4% Never married41.6% Now married0.0% Separated0.0% Widowed0.0% DivorcedFemales 61.4% Never married26.5% Now married0.0% Separated12.0% Widowed0.0% DivorcedWomen who did not give birth in the past 12 months Now married:
25.8% (93)Unmarried:
74.2% (268)
Marital status - Two or more races population 15 years and over
Males 29.4% Never married0.0% Now married5.9% Separated29.4% Widowed35.3% DivorcedFemales 70.3% Never married16.5% Now married0.0% Separated10.1% Widowed3.2% DivorcedWomen who did not give birth in the past 12 months Now married:
0.0% (0)Unmarried:
100.0% (155)
Marital status - White alone, not Hispanic / Latino population 15 years and over
Males 26.7% Never married45.0% Now married0.5% Separated6.2% Widowed21.6% DivorcedFemales 14.7% Never married47.0% Now married5.0% Separated14.4% Widowed18.9% DivorcedWomen who gave birth in the past 12 months Now married:
100.0% (20)Unmarried:
0.0% (0)
Women who did not give birth in the past 12 months Now married:
53.9% (585)Unmarried:
46.1% (500)
Marital status - Hispanic or Latino population 15 years and over
Males 49.0% Never married43.8% Now married0.0% Separated7.2% Widowed0.0% DivorcedFemales 53.5% Never married35.2% Now married6.7% Separated4.6% Widowed0.0% DivorcedWomen who did not give birth in the past 12 months Now married:
43.9% (291)Unmarried:
56.1% (371)
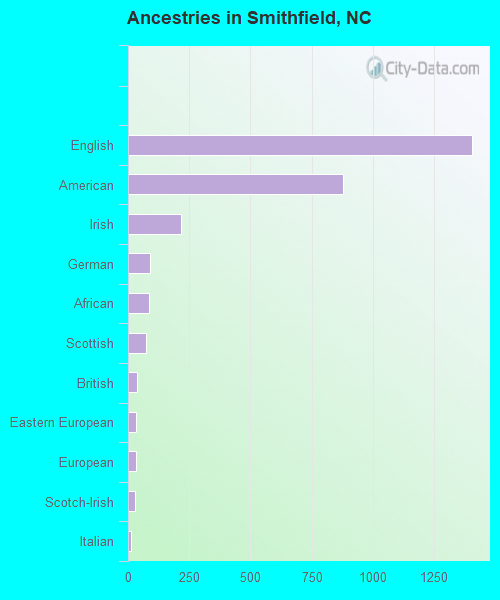
Ancestries in Smithfield
1,405 20.0% English878 12.5% American215 3.1% Irish91 1.3% German87 1.2% African73 1.0% Scottish36 0.5% British34 0.5% Eastern European32 0.5% European28 0.4% Scotch-Irish14 0.2% Italian9 0.1% Belgian8 0.1% French7 0.10% Polish6 0.09% Swedish4 0.06% Barbadian
Geographical mobility in Smithfield Same house 1 year ago 5,804 87.5% White (Caucasian)3,690 98.1% Black or African American22 82.4% American Indian / Alaska Native222 99.6% Asian1,420 100.0% Other race323 99.7% Two or more races5,262 86.9% White alone, not Hispanic / Latino2,171 96.3% Hispanic or LatinoMoved within same county 436 6.6% White / Caucasian65 1.7% Black or African American399 6.6% White alone, not Hispanic / Latino44 1.9% Hispanic or LatinoMoved within same state 232 3.5% White / Caucasian63 1.7% Black or African American4 14.4% American Indian / Alaska Native4 2.0% Asian5 1.6% Two or more races227 3.7% White alone, not Hispanic / Latino10 0.4% Hispanic or LatinoMoved from different state 142 2.1% White / Caucasian13 0.3% Black or African American167 2.8% White alone, not Hispanic / Latino2 0.1% Hispanic or LatinoMoved from abroad 1 0.0% White25 0.7% Black or African American2 0.0% White alone, not Hispanic / Latino
Children Nativity (place of birth) in Smithfield
Children under 6 years - Living with two parents Both parents native 150 100.0% NativeBoth parents foreign-born 59 100.0% NativeOne native, one foreign-born parent 14 100.0% NativeChildren under 6 years - Living with one parent Native parent 40 100.0% NativeForeign-born parent 397 100.0% NativeChildren 6 to 17 years - Living with two parents Both parents native 524 97.3% Native15 2.7% Foreign-bornBoth parents foreign-born 93 44.5% Native116 55.5% Foreign-bornOne native, one foreign-born parent 302 100.0% NativeChildren 6 to 17 years - Living with one parent Native parent 553 100.0% NativeForeign-born parent 419 47.9% Native455 52.1% Foreign-born
Grandparents responsible for own grandchildren in Smithfield
Grandparents (30 to 59 years) White / Caucasian 12 100.0% Not responsible for grandchildrenOther race 47 100.0% Responsible for grandchildrenWhite alone, not Hispanic / Latino 13 100.0% Not responsible for grandchildrenHispanic or Latino 37 100.0% Responsible for grandchildrenGrandparents (60 years and over) White / Caucasian 30 73.5% Responsible for grandchildren11 26.5% Not responsible for grandchildrenOther race 63 100.0% Responsible for grandchildrenWhite alone, not Hispanic / Latino 30 73.6% Responsible for grandchildren11 26.4% Not responsible for grandchildrenHispanic or Latino 43 100.0% Responsible for grandchildren