Races in Smithville, New Jersey (NJ) Detailed Stats
Data:
Races - White alone (%)
Races - White alone (% change since 2000)
Races - Black alone (%)
Races - Black alone (% change since 2000)
Races - American Indian alone (%)
Races - American Indian alone (% change since 2000)
Races - Asian alone (%)
Races - Asian alone (% change since 2000)
Races - Hispanic (%)
Races - Hispanic (% change since 2000)
Races - Native Hawaiian and Other Pacific Islander alone (%)
Races - Native Hawaiian and Other Pacific Islander alone (% change since 2000)
Races - Two or more races(%)
Races - Two or more races(% change since 2000)
Races - Other race alone (%)
Races - Other race alone (% change since 2000)
Racial diversity
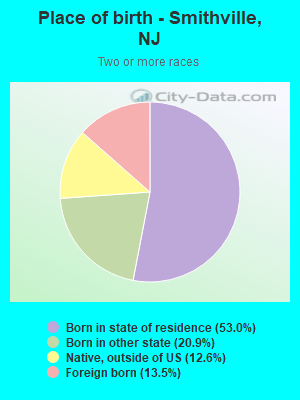
Place of birth - Born in state of residence (%)
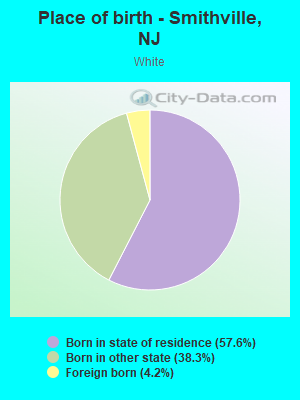
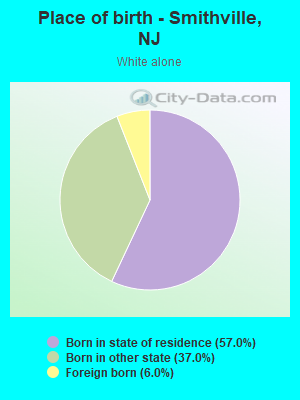
Place of birth - Born in state of residence (%) - White
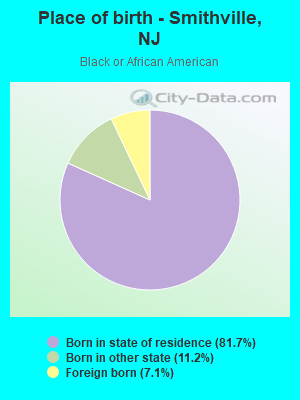
Place of birth - Born in state of residence (%) - Black or African American
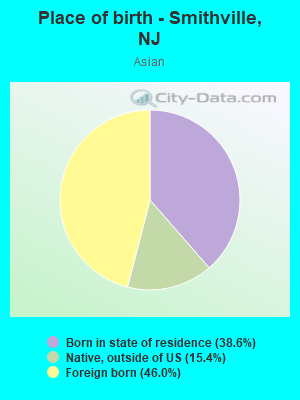
Place of birth - Born in state of residence (%) - Asian
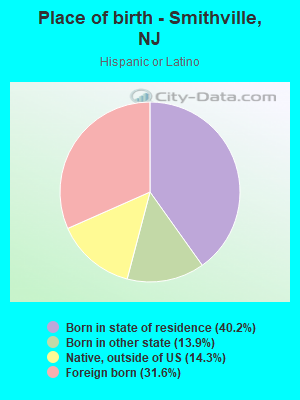
Place of birth - Born in state of residence (%) - Hispanic or Latino
Place of birth - Born in state of residence (%) - American Indian and Alaska Native
Place of birth - Born in state of residence (%) - Multirace
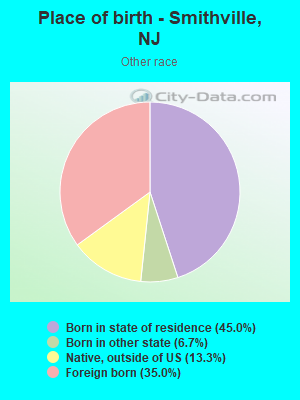
Place of birth - Born in state of residence (%) - Other Race
Place of birth - Born in other state (%)
Place of birth - Born in other state (%) - White
Place of birth - Born in other state (%) - Black or African American
Place of birth - Born in other state (%) - Asian
Place of birth - Born in other state (%) - Hispanic or Latino
Place of birth - Born in other state (%) - American Indian and Alaska Native
Place of birth - Born in other state (%) - Multirace
Place of birth - Born in other state (%) - Other Race
Place of birth - Native, outside of US (%)
Place of birth - Native, outside of US (%) - White
Place of birth - Native, outside of US (%) - Black or African American
Place of birth - Native, outside of US (%) - Asian
Place of birth - Native, outside of US (%) - Hispanic or Latino
Place of birth - Native, outside of US (%) - American Indian and Alaska Native
Place of birth - Native, outside of US (%) - Multirace
Place of birth - Native, outside of US (%) - Other Race
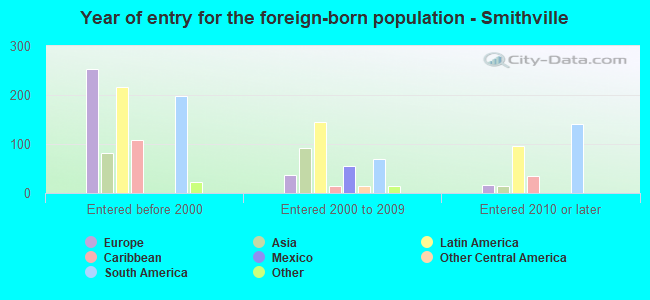
Place of birth - Foreign born (%)
Place of birth - Foreign born (%) - White
Place of birth - Foreign born (%) - Black or African American
Place of birth - Foreign born (%) - Asian
Place of birth - Foreign born (%) - Hispanic or Latino
Place of birth - Foreign born (%) - American Indian and Alaska Native
Place of birth - Foreign born (%) - Multirace
Place of birth - Foreign born (%) - Other Race
Residents speaking English at home (%)
Residents speaking English at home - Born in the United States (%)
Residents speaking English at home - Native, born elsewhere (%)
Residents speaking English at home - Foreign born (%)
Residents speaking Spanish at home (%)
Residents speaking Spanish at home - Born in the United States (%)
Residents speaking Spanish at home - Native, born elsewhere (%)
Residents speaking Spanish at home - Foreign born (%)
Residents speaking other language at home (%)
Residents speaking other language at home - Born in the United States (%)
Residents speaking other language at home - Native, born elsewhere (%)
Residents speaking other language at home - Foreign born (%)
Marital status - Never married (%)
Marital status - Now married (%)
Marital status - Separated (%)
Marital status - Widowed (%)
Marital status - Divorced (%)
Ancestries Reported - Arab (%)
Ancestries Reported - Czech (%)
Ancestries Reported - Danish (%)
Ancestries Reported - Dutch (%)
Ancestries Reported - English (%)
Ancestries Reported - French (%)
Ancestries Reported - French Canadian (%)
Ancestries Reported - German (%)
Ancestries Reported - Greek (%)
Ancestries Reported - Hungarian (%)
Ancestries Reported - Irish (%)
Ancestries Reported - Italian (%)
Ancestries Reported - Lithuanian (%)
Ancestries Reported - Norwegian (%)
Ancestries Reported - Polish (%)
Ancestries Reported - Portuguese (%)
Ancestries Reported - Russian (%)
Ancestries Reported - Scotch-Irish (%)
Ancestries Reported - Scottish (%)
Ancestries Reported - Slovak (%)
Ancestries Reported - Subsaharan African (%)
Ancestries Reported - Swedish (%)
Ancestries Reported - Swiss (%)
Ancestries Reported - Ukrainian (%)
Ancestries Reported - United States (%)
Ancestries Reported - Welsh (%)
Ancestries Reported - West Indian (%)
Ancestries Reported - Other (%)
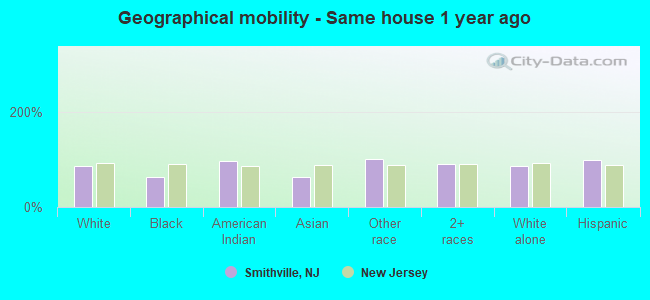
Geographical mobility - Same house 1 year ago (%)
Geographical mobility - Same house 1 year ago (%) - White
Geographical mobility - Same house 1 year ago (%) - Black or African American
Geographical mobility - Same house 1 year ago (%) - Asian
Geographical mobility - Same house 1 year ago (%) - Hispanic or Latino
Geographical mobility - Same house 1 year ago (%) - American Indian and Alaska Native
Geographical mobility - Same house 1 year ago (%) - Multirace
Geographical mobility - Same house 1 year ago (%) - Other Race
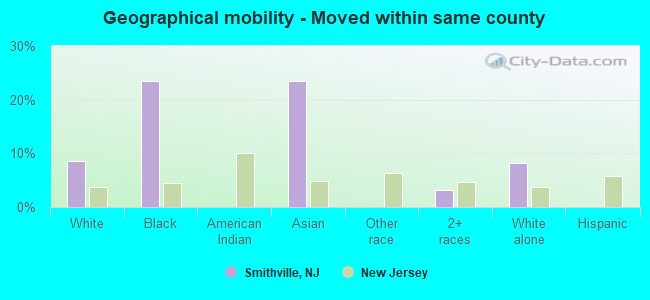
Geographical mobility - Moved within same county (%)
Geographical mobility - Moved within same county (%) - White
Geographical mobility - Moved within same county (%) - Black or African American
Geographical mobility - Moved within same county (%) - Asian
Geographical mobility - Moved within same county (%) - Hispanic or Latino
Geographical mobility - Moved within same county (%) - American Indian and Alaska Native
Geographical mobility - Moved within same county (%) - Multirace
Geographical mobility - Moved within same county (%) - Other Race
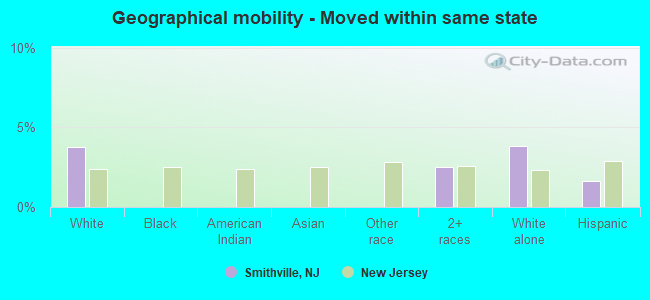
Geographical mobility - Moved from different county within same state (%)
Geographical mobility - Moved from different county within same state (%) - White
Geographical mobility - Moved from different county within same state (%) - Black or African American
Geographical mobility - Moved from different county within same state (%) - Asian
Geographical mobility - Moved from different county within same state (%) - Hispanic or Latino
Geographical mobility - Moved from different county within same state (%) - American Indian and Alaska Native
Geographical mobility - Moved from different county within same state (%) - Multirace
Geographical mobility - Moved from different county within same state (%) - Other Race
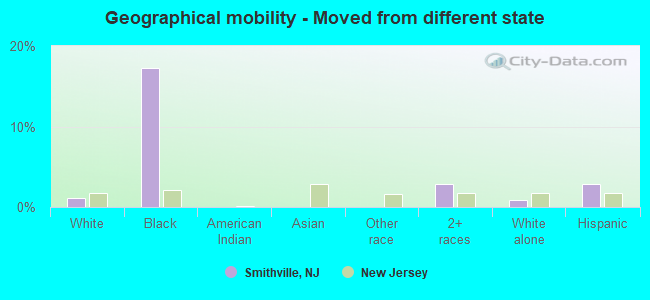
Geographical mobility - Moved from different state (%)
Geographical mobility - Moved from different state (%) - White
Geographical mobility - Moved from different state (%) - Black or African American
Geographical mobility - Moved from different state (%) - Asian
Geographical mobility - Moved from different state (%) - Hispanic or Latino
Geographical mobility - Moved from different state (%) - American Indian and Alaska Native
Geographical mobility - Moved from different state (%) - Multirace
Geographical mobility - Moved from different state (%) - Other Race
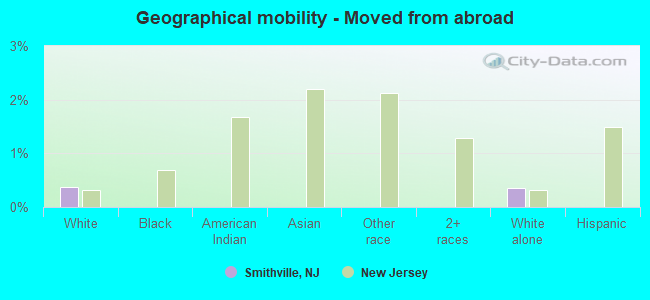
Geographical mobility - Moved from abroad (%)
Geographical mobility - Moved from abroad (%) - White
Geographical mobility - Moved from abroad (%) - Black or African American
Geographical mobility - Moved from abroad (%) - Asian
Geographical mobility - Moved from abroad (%) - Hispanic or Latino
Geographical mobility - Moved from abroad (%) - American Indian and Alaska Native
Geographical mobility - Moved from abroad (%) - Multirace
Geographical mobility - Moved from abroad (%) - Other Race
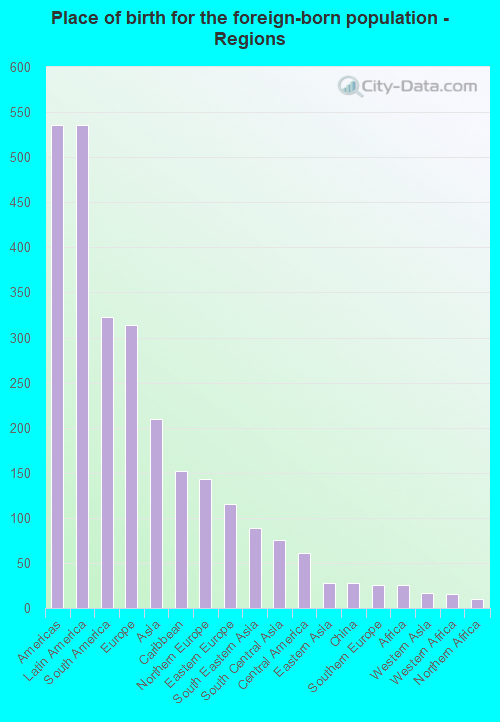
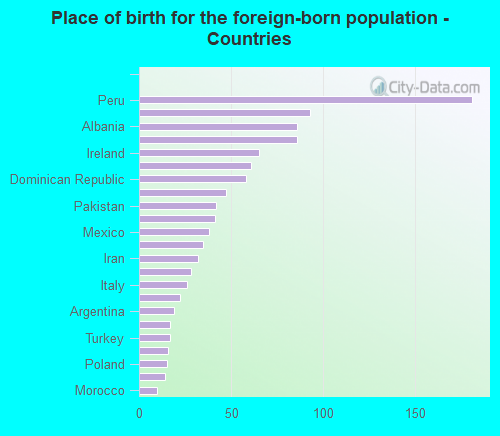
Place of birth for the foreign-born population - Ireland (%)
Place of birth for the foreign-born population - Denmark (%)
Place of birth for the foreign-born population - Norway (%)
Place of birth for the foreign-born population - Sweden (%)
Place of birth for the foreign-born population - United Kingdom (%)
Place of birth for the foreign-born population - England (%)
Place of birth for the foreign-born population - Scotland (%)
Place of birth for the foreign-born population - Other Northern Europe (%)
Place of birth for the foreign-born population - Austria (%)
Place of birth for the foreign-born population - Belgium (%)
Place of birth for the foreign-born population - France (%)
Place of birth for the foreign-born population - Germany (%)
Place of birth for the foreign-born population - Netherlands (%)
Place of birth for the foreign-born population - Switzerland (%)
Place of birth for the foreign-born population - Other Western Europe (%)
Place of birth for the foreign-born population - Greece (%)
Place of birth for the foreign-born population - Italy (%)
Place of birth for the foreign-born population - Portugal (%)
Place of birth for the foreign-born population - Spain (%)
Place of birth for the foreign-born population - Other Southern Europe (%)
Place of birth for the foreign-born population - Albania (%)
Place of birth for the foreign-born population - Belarus (%)
Place of birth for the foreign-born population - Bosnia and Herzegovina (%)
Place of birth for the foreign-born population - Bulgaria (%)
Place of birth for the foreign-born population - Croatia (%)
Place of birth for the foreign-born population - Czechoslovakia (%)
Place of birth for the foreign-born population - Hungary (%)
Place of birth for the foreign-born population - Latvia (%)
Place of birth for the foreign-born population - Lithuania (%)
Place of birth for the foreign-born population - North Macedonia (Macedonia) (%)
Place of birth for the foreign-born population - Moldova (%)
Place of birth for the foreign-born population - Poland (%)
Place of birth for the foreign-born population - Romania (%)
Place of birth for the foreign-born population - Russia (%)
Place of birth for the foreign-born population - Serbia (%)
Place of birth for the foreign-born population - Ukraine (%)
Place of birth for the foreign-born population - Other Eastern Europe (%)
Place of birth for the foreign-born population - China (%)
Place of birth for the foreign-born population - Hong Kong (%)
Place of birth for the foreign-born population - Taiwan (%)
Place of birth for the foreign-born population - Japan (%)
Place of birth for the foreign-born population - Korea (%)
Place of birth for the foreign-born population - Other Eastern Asia (%)
Place of birth for the foreign-born population - Afghanistan (%)
Place of birth for the foreign-born population - Bangladesh (%)
Place of birth for the foreign-born population - India (%)
Place of birth for the foreign-born population - Iran (%)
Place of birth for the foreign-born population - Kazakhstan (%)
Place of birth for the foreign-born population - Nepal (%)
Place of birth for the foreign-born population - Pakistan (%)
Place of birth for the foreign-born population - Sri Lanka (%)
Place of birth for the foreign-born population - Uzbekistan (%)
Place of birth for the foreign-born population - Other South Central Asia (%)
Place of birth for the foreign-born population - Burma (%)
Place of birth for the foreign-born population - Cambodia (%)
Place of birth for the foreign-born population - Indonesia (%)
Place of birth for the foreign-born population - Laos (%)
Place of birth for the foreign-born population - Malaysia (%)
Place of birth for the foreign-born population - Philippines (%)
Place of birth for the foreign-born population - Singapore (%)
Place of birth for the foreign-born population - Thailand (%)
Place of birth for the foreign-born population - Vietnam (%)
Place of birth for the foreign-born population - Other South Eastern Asia (%)
Place of birth for the foreign-born population - Armenia (%)
Place of birth for the foreign-born population - Iraq (%)
Place of birth for the foreign-born population - Israel (%)
Place of birth for the foreign-born population - Jordan (%)
Place of birth for the foreign-born population - Kuwait (%)
Place of birth for the foreign-born population - Lebanon (%)
Place of birth for the foreign-born population - Saudi Arabia (%)
Place of birth for the foreign-born population - Syria (%)
Place of birth for the foreign-born population - Turkey (%)
Place of birth for the foreign-born population - Yemen (%)
Place of birth for the foreign-born population - Other Western Asia (%)
Place of birth for the foreign-born population - Eritrea (%)
Place of birth for the foreign-born population - Ethiopia (%)
Place of birth for the foreign-born population - Kenya (%)
Place of birth for the foreign-born population - Somalia (%)
Place of birth for the foreign-born population - Uganda (%)
Place of birth for the foreign-born population - Zimbabwe (%)
Place of birth for the foreign-born population - Other Eastern Africa (%)
Place of birth for the foreign-born population - Cameroon (%)
Place of birth for the foreign-born population - Congo (%)
Place of birth for the foreign-born population - Democratic Republic of Congo (Zaire) (%)
Place of birth for the foreign-born population - Other Middle Africa (%)
Place of birth for the foreign-born population - Egypt (%)
Place of birth for the foreign-born population - Morocco (%)
Place of birth for the foreign-born population - Sudan (%)
Place of birth for the foreign-born population - Other Northern Africa (%)
Place of birth for the foreign-born population - South Africa (%)
Place of birth for the foreign-born population - Other Southern Africa (%)
Place of birth for the foreign-born population - Cabo Verde (%)
Place of birth for the foreign-born population - Ghana (%)
Place of birth for the foreign-born population - Liberia (%)
Place of birth for the foreign-born population - Nigeria (%)
Place of birth for the foreign-born population - Senegal (%)
Place of birth for the foreign-born population - Sierra Leone (%)
Place of birth for the foreign-born population - Other Western Africa (%)
Place of birth for the foreign-born population - Australia (%)
Place of birth for the foreign-born population - New Zealand (%)
Place of birth for the foreign-born population - Fiji (%)
Place of birth for the foreign-born population - Micronesia (%)
Place of birth for the foreign-born population - Bahamas (%)
Place of birth for the foreign-born population - Barbados (%)
Place of birth for the foreign-born population - Cuba (%)
Place of birth for the foreign-born population - Dominica (%)
Place of birth for the foreign-born population - Dominican Republic (%)
Place of birth for the foreign-born population - Grenada (%)
Place of birth for the foreign-born population - Haiti (%)
Place of birth for the foreign-born population - Jamaica (%)
Place of birth for the foreign-born population - St. Vincent and the Grenadines (%)
Place of birth for the foreign-born population - Trinidad and Tobago (%)
Place of birth for the foreign-born population - West Indies (%)
Place of birth for the foreign-born population - Other Caribbean (%)
Place of birth for the foreign-born population - Belize (%)
Place of birth for the foreign-born population - Costa Rica (%)
Place of birth for the foreign-born population - El Salvador (%)
Place of birth for the foreign-born population - Guatemala (%)
Place of birth for the foreign-born population - Honduras (%)
Place of birth for the foreign-born population - Mexico (%)
Place of birth for the foreign-born population - Nicaragua (%)
Place of birth for the foreign-born population - Panama (%)
Place of birth for the foreign-born population - Other Central America (%)
Place of birth for the foreign-born population - Argentina (%)
Place of birth for the foreign-born population - Bolivia (%)
Place of birth for the foreign-born population - Brazil (%)
Place of birth for the foreign-born population - Chile (%)
Place of birth for the foreign-born population - Colombia (%)
Place of birth for the foreign-born population - Ecuador (%)
Place of birth for the foreign-born population - Guyana (%)
Place of birth for the foreign-born population - Peru (%)
Place of birth for the foreign-born population - Uruguay (%)
Place of birth for the foreign-born population - Venezuela (%)
Place of birth for the foreign-born population - Other South America (%)
Place of birth for the foreign-born population - Canada (%)
Place of birth for the foreign-born population - Other Northern America (%)
Place of birth for the foreign-born population - Other (%)
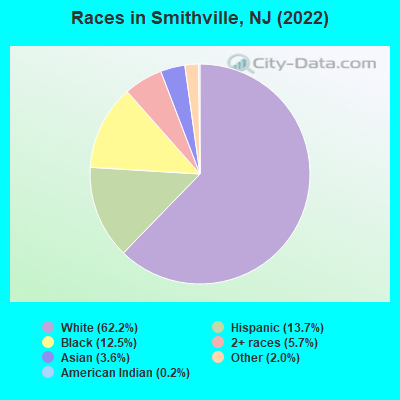
According to 2022 data, the most numerous races in Smithville, NJ are White alone (5,710 residents), Hispanic (1,260 residents), and Black alone (1,149 residents). 81.2% of Smithville residents speak English at home.
Race distribution in Smithville 5,710 62.2% White alone 1,260 13.7% Hispanic 1,149 12.5% Black alone 521 5.7% Two or more races 333 3.6% Asian alone 186 2.0% Other race alone 14 0.2% American Indian alone
2000 2022
5,557,209 66.0% White alone 1,117,191 13.3% Hispanic 1,096,171 13.0% Black alone 477,012 5.7% Asian alone 133,689 1.6% Two or more races 19,565 0.2% Other race alone 11,338 0.1% American Indian alone 2,175 0.03% Native Hawaiian and Other
4,766,476 51.5% White alone 2,028,470 21.9% Hispanic 1,111,632 12.0% Black alone 923,546 10.0% Asian alone 332,237 3.6% Two or more races 89,847 1.0% Other race alone 8,557 0.09% American Indian alone 934 0.01% Native Hawaiian and Other
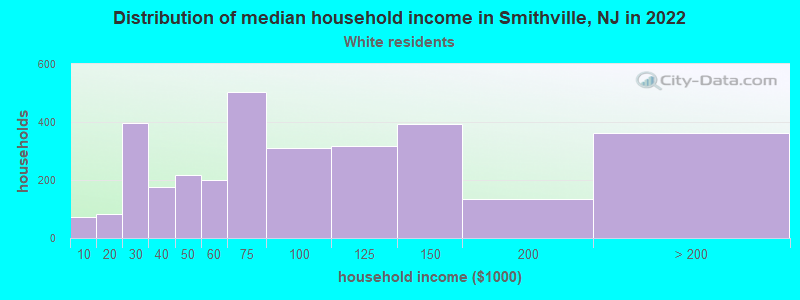
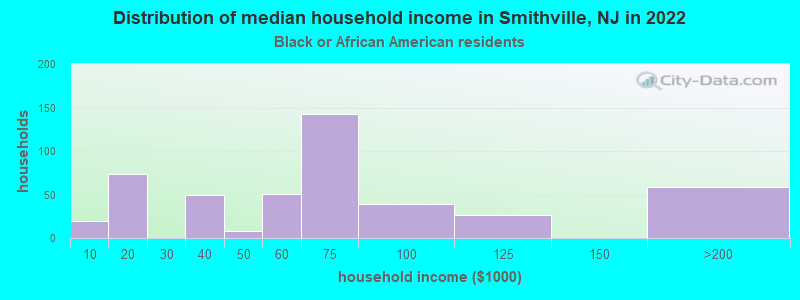
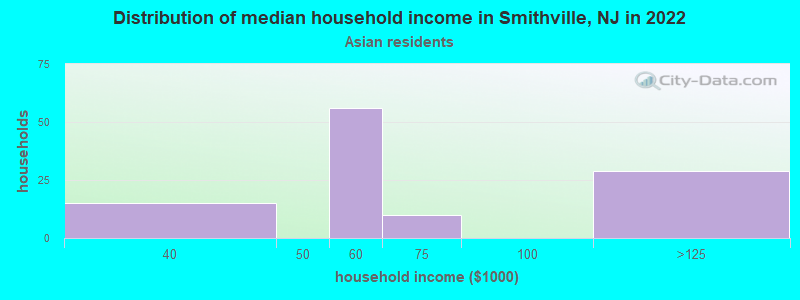
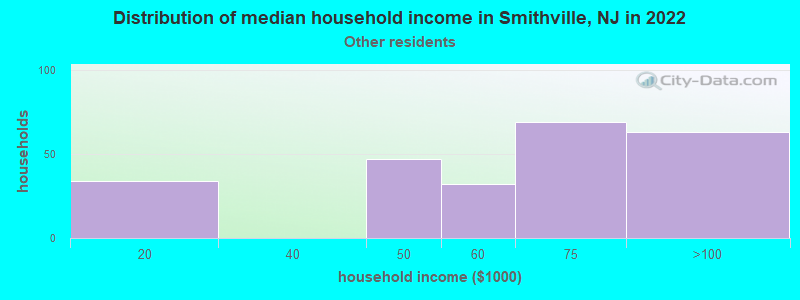
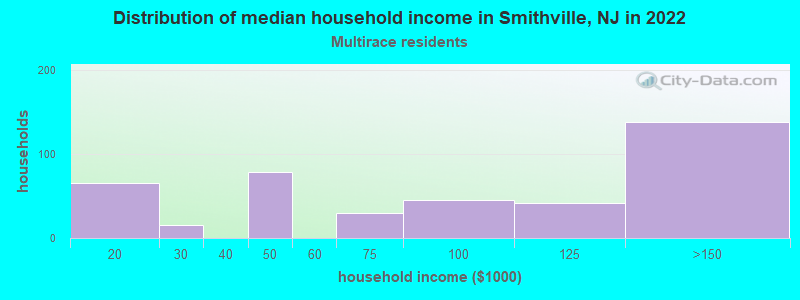
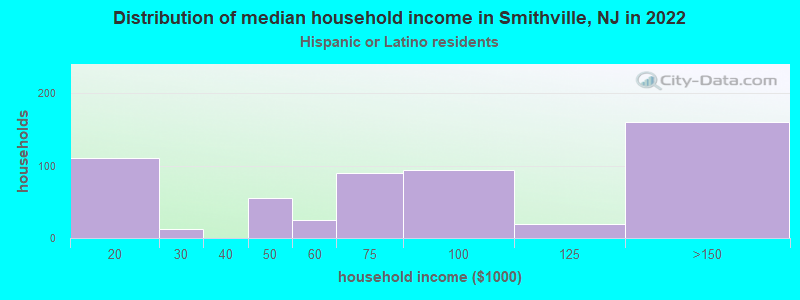
Income and house value in Smithville Median household income in 2022 $72,152 White non-Hispanic householders$68,666 Black householders$52,135 Asian householders$72,644 Some other race householders$104,000 Two or more races householders$76,614 Hispanic or Latino race householders
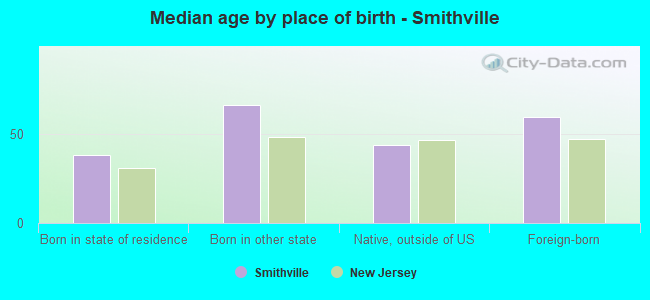
Median age by race in Smithville
62.3 Median age for White residents60.8 63.7 48.1 Median age for Black or African American residents24.4 47.7 -650,046,167.4 Median age for American Indian / Alaska Native residents-590,299,277.0 -877,192,981.6 44.3 Median age for Asian residents40.7 47.4 -804,177,544.9 Median age for Native Hawaiian / Pacific Islander residents-860,335,194.7 -713,070,378.3 41.4 Median age for Other race residents40.8 38.8 40.2 Median age for Two or more races residents47.7 32.6 61.4 Median age for White alone residents60.2 61.9 37.1 Median age for Hispanic or Latino residents42.4 35.0
Owner/renter occupied households by race in Smithville
House owners and renters - White residents 2,898 87.8% Owner occupied402 12.2% Renter occupiedHouse owners and renters - Black or African American residents 153 27.7% Owner occupied400 72.3% Renter occupiedHouse owners and renters - American Indian / Alaska Native residents 19 100.0% Renter occupiedHouse owners and renters - Asian residents 64 61.7% Owner occupied40 38.3% Renter occupiedHouse owners and renters - Other race residents 114 42.4% Owner occupied155 57.6% Renter occupiedHouse owners and renters - Two or more races residents 392 92.2% Owner occupied33 7.8% Renter occupiedHouse owners and renters - White alone residents 2,918 87.2% Owner occupied428 12.8% Renter occupiedHouse owners and renters - Hispanic or Latino residents 397 81.8% Owner occupied88 18.2% Renter occupied
Language usage in Smithville
English speakers - Total 81.2% of residents of Smithville speak English at home.
11.3% of residents speak Spanish at home 608 59.3% Speak English very well418 40.7% Speak English less than very well7.4% of residents speak other language at home 466 69.3% Speak English very well206 30.7% Speak English less than very well
English speakers - Born in the United States 93.6% of residents of Smithville speak English at home.
2.7% of residents speak Spanish at home 69 100.0% Speak English very well3.6% of residents speak other language at home 77 83.7% Speak English very well15 16.3% Speak English less than very well
English speakers - Native, born elsewhere 24.4% of residents of Smithville speak English at home.
72.1% of residents speak Spanish at home 54 29.0% Speak English very well132 71.0% Speak English less than very well8.1% of residents speak other language at home 21 100.0% Speak English very well
English speakers - Foreign-born 28.2% of residents of Smithville speak English at home.
32.5% of residents speak Spanish at home 105 32.7% Speak English very well216 67.3% Speak English less than very well37.5% of residents speak other language at home 218 58.9% Speak English very well152 41.1% Speak English less than very well
White (Caucasian) - Speak only English Native:
99.8% (5,223)Foreign-born:
45.1% (104)
White (Caucasian) - Speak another language Native:
1.8% (96)Foreign-born:
58.7% (135)
Black or African American - Speak only English Native:
87.8% (932)Foreign-born:
79.7% (68)
Black or African American - Speak another language Native:
8.7% (92)Foreign-born:
16.2% (14)
Asian - Speak another language Native:
50.9% (105)Foreign-born:
99.4% (157)
Other race - Speak another language Native:
54.6% (318)Foreign-born:
97.5% (298)
Two or more races - Speak only English Native:
52.5% (536)Foreign-born:
52.0% (87)
Two or more races - Speak another language Native:
50.1% (511)Foreign-born:
63.0% (106)
White alone - Speak only English Native:
97.1% (5,204)Foreign-born:
27.6% (94)
White alone - Speak another language Native:
2.9% (158)Foreign-born:
70.0% (238)
Hispanic or Latino - Speak only English Native:
28.0% (246)Foreign-born:
25.8% (99)
Hispanic or Latino - Speak another language Native:
68.8% (604)Foreign-born:
84.2% (322)
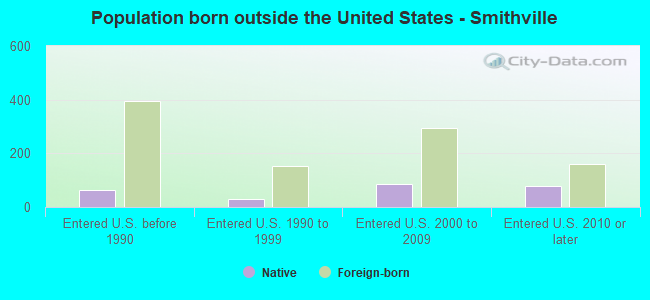
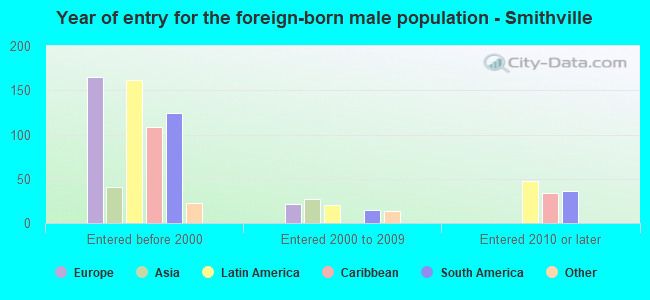
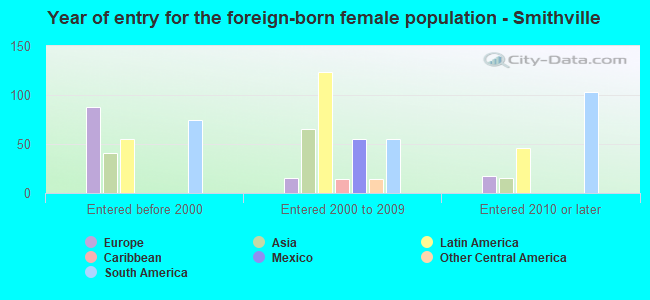
Foreign-born residents in Smithville
Marital status for residents in Smithville Marital status - White (Caucasian) population 15 years and over
Males 32.6% Never married49.3% Now married0.0% Separated6.8% Widowed11.3% DivorcedFemales 26.4% Never married43.5% Now married0.0% Separated16.6% Widowed13.4% DivorcedWomen who gave birth in the past 12 months Now married:
100.0% (18)Unmarried:
0.0% (0)
Women who did not give birth in the past 12 months Now married:
18.7% (163)Unmarried:
81.3% (710)
Marital status - Black or African American population 15 years and over
Males 88.7% Never married7.9% Now married3.4% Separated0.0% Widowed0.0% DivorcedFemales 48.7% Never married20.5% Now married10.6% Separated6.1% Widowed14.1% DivorcedWomen who did not give birth in the past 12 months Now married:
33.9% (97)Unmarried:
66.1% (190)
Marital status - Asian population 15 years and over
Males 43.4% Never married16.8% Now married0.0% Separated0.0% Widowed39.9% DivorcedFemales 17.1% Never married27.6% Now married0.0% Separated28.6% Widowed26.7% DivorcedWomen who did not give birth in the past 12 months Now married:
28.1% (17)Unmarried:
71.9% (42)
Marital status - Other race population 15 years and over
Males 34.1% Never married60.5% Now married0.0% Separated0.0% Widowed5.4% DivorcedFemales 33.7% Never married57.9% Now married0.0% Separated0.0% Widowed8.4% DivorcedWomen who did not give birth in the past 12 months Now married:
40.6% (109)Unmarried:
59.4% (159)
Marital status - Two or more races population 15 years and over
Males 16.8% Never married81.9% Now married0.0% Separated1.4% Widowed0.0% DivorcedFemales 34.3% Never married56.9% Now married0.0% Separated8.9% Widowed0.0% DivorcedWomen who did not give birth in the past 12 months Now married:
49.8% (155)Unmarried:
50.2% (156)
Marital status - White alone, not Hispanic / Latino population 15 years and over
Males 32.6% Never married49.3% Now married0.0% Separated6.8% Widowed11.3% DivorcedFemales 26.1% Never married43.4% Now married0.0% Separated16.8% Widowed13.6% DivorcedWomen who gave birth in the past 12 months Now married:
100.0% (19)Unmarried:
0.0% (0)
Women who did not give birth in the past 12 months Now married:
17.4% (158)Unmarried:
82.6% (749)
Marital status - Hispanic or Latino population 15 years and over
Males 28.1% Never married68.4% Now married0.0% Separated0.0% Widowed3.5% DivorcedFemales 34.9% Never married51.4% Now married0.0% Separated3.8% Widowed9.9% DivorcedWomen who did not give birth in the past 12 months Now married:
43.5% (165)Unmarried:
56.5% (215)
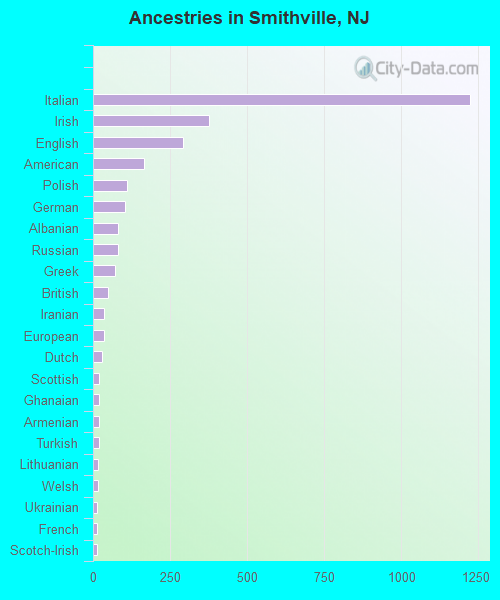
Ancestries in Smithville
1,223 25.7% Italian375 7.9% Irish293 6.2% English164 3.4% American111 2.3% Polish105 2.2% German82 1.7% Albanian81 1.7% Russian71 1.5% Greek50 1.1% British36 0.8% Iranian35 0.7% European28 0.6% Dutch21 0.4% Scottish21 0.4% Ghanaian18 0.4% Armenian18 0.4% Turkish15 0.3% Lithuanian15 0.3% Welsh14 0.3% Ukrainian13 0.3% French12 0.3% Scotch-Irish11 0.2% Moroccan11 0.2% Cajun11 0.2% French Canadian
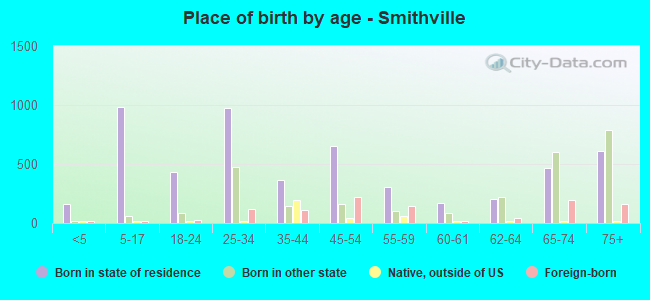
Children Nativity (place of birth) in Smithville
Children under 6 years - Living with two parents Both parents native 47 100.0% NativeChildren under 6 years - Living with one parent Native parent 142 100.0% Native
Children 6 to 17 years - Living with two parents Both parents native 288 100.0% NativeBoth parents foreign-born 67 100.0% NativeOne native, one foreign-born parent 74 100.0% NativeChildren 6 to 17 years - Living with one parent Native parent 563 100.0% Native
Grandparents responsible for own grandchildren in Smithville
Grandparents (30 to 59 years) White / Caucasian 7 100.0% Responsible for grandchildrenWhite alone, not Hispanic / Latino 8 100.0% Responsible for grandchildren
Grandparents (60 years and over) White / Caucasian 9 100.0% Not responsible for grandchildrenWhite alone, not Hispanic / Latino 10 100.0% Not responsible for grandchildren