Races in South Bend, Indiana (IN) Detailed Stats
Data:
Races - White alone (%)
Races - White alone (% change since 2000)
Races - Black alone (%)
Races - Black alone (% change since 2000)
Races - American Indian alone (%)
Races - American Indian alone (% change since 2000)
Races - Asian alone (%)
Races - Asian alone (% change since 2000)
Races - Hispanic (%)
Races - Hispanic (% change since 2000)
Races - Native Hawaiian and Other Pacific Islander alone (%)
Races - Native Hawaiian and Other Pacific Islander alone (% change since 2000)
Races - Two or more races(%)
Races - Two or more races(% change since 2000)
Races - Other race alone (%)
Races - Other race alone (% change since 2000)
Racial diversity
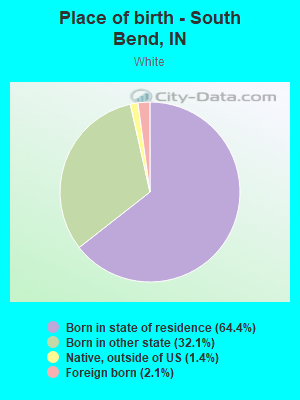
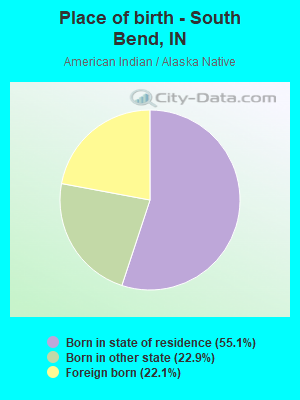
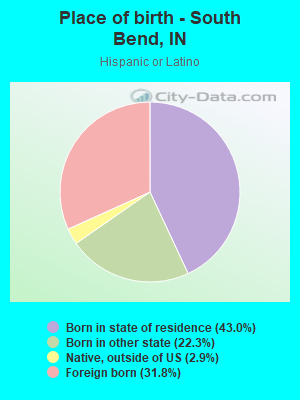
Place of birth - Born in state of residence (%)
Place of birth - Born in state of residence (%) - White
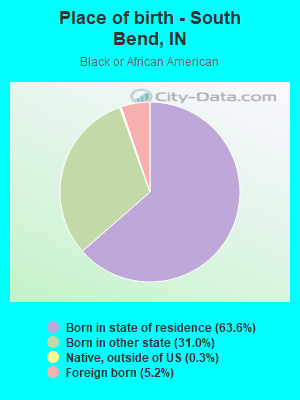
Place of birth - Born in state of residence (%) - Black or African American
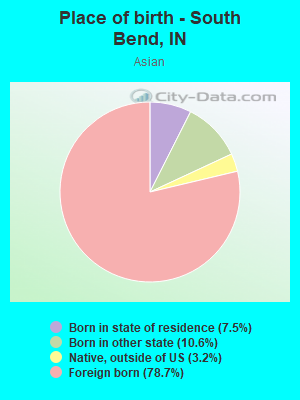
Place of birth - Born in state of residence (%) - Asian
Place of birth - Born in state of residence (%) - Hispanic or Latino
Place of birth - Born in state of residence (%) - American Indian and Alaska Native
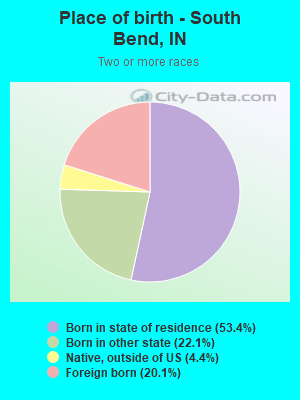
Place of birth - Born in state of residence (%) - Multirace
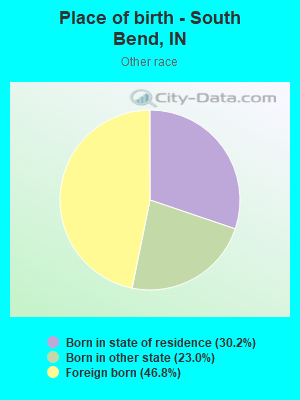
Place of birth - Born in state of residence (%) - Other Race
Place of birth - Born in other state (%)
Place of birth - Born in other state (%) - White
Place of birth - Born in other state (%) - Black or African American
Place of birth - Born in other state (%) - Asian
Place of birth - Born in other state (%) - Hispanic or Latino
Place of birth - Born in other state (%) - American Indian and Alaska Native
Place of birth - Born in other state (%) - Multirace
Place of birth - Born in other state (%) - Other Race
Place of birth - Native, outside of US (%)
Place of birth - Native, outside of US (%) - White
Place of birth - Native, outside of US (%) - Black or African American
Place of birth - Native, outside of US (%) - Asian
Place of birth - Native, outside of US (%) - Hispanic or Latino
Place of birth - Native, outside of US (%) - American Indian and Alaska Native
Place of birth - Native, outside of US (%) - Multirace
Place of birth - Native, outside of US (%) - Other Race
Place of birth - Foreign born (%)
Place of birth - Foreign born (%) - White
Place of birth - Foreign born (%) - Black or African American
Place of birth - Foreign born (%) - Asian
Place of birth - Foreign born (%) - Hispanic or Latino
Place of birth - Foreign born (%) - American Indian and Alaska Native
Place of birth - Foreign born (%) - Multirace
Place of birth - Foreign born (%) - Other Race
Residents speaking English at home (%)
Residents speaking English at home - Born in the United States (%)
Residents speaking English at home - Native, born elsewhere (%)
Residents speaking English at home - Foreign born (%)
Residents speaking Spanish at home (%)
Residents speaking Spanish at home - Born in the United States (%)
Residents speaking Spanish at home - Native, born elsewhere (%)
Residents speaking Spanish at home - Foreign born (%)
Residents speaking other language at home (%)
Residents speaking other language at home - Born in the United States (%)
Residents speaking other language at home - Native, born elsewhere (%)
Residents speaking other language at home - Foreign born (%)
Marital status - Never married (%)
Marital status - Now married (%)
Marital status - Separated (%)
Marital status - Widowed (%)
Marital status - Divorced (%)
Ancestries Reported - Arab (%)
Ancestries Reported - Czech (%)
Ancestries Reported - Danish (%)
Ancestries Reported - Dutch (%)
Ancestries Reported - English (%)
Ancestries Reported - French (%)
Ancestries Reported - French Canadian (%)
Ancestries Reported - German (%)
Ancestries Reported - Greek (%)
Ancestries Reported - Hungarian (%)
Ancestries Reported - Irish (%)
Ancestries Reported - Italian (%)
Ancestries Reported - Lithuanian (%)
Ancestries Reported - Norwegian (%)
Ancestries Reported - Polish (%)
Ancestries Reported - Portuguese (%)
Ancestries Reported - Russian (%)
Ancestries Reported - Scotch-Irish (%)
Ancestries Reported - Scottish (%)
Ancestries Reported - Slovak (%)
Ancestries Reported - Subsaharan African (%)
Ancestries Reported - Swedish (%)
Ancestries Reported - Swiss (%)
Ancestries Reported - Ukrainian (%)
Ancestries Reported - United States (%)
Ancestries Reported - Welsh (%)
Ancestries Reported - West Indian (%)
Ancestries Reported - Other (%)
Geographical mobility - Same house 1 year ago (%)
Geographical mobility - Same house 1 year ago (%) - White
Geographical mobility - Same house 1 year ago (%) - Black or African American
Geographical mobility - Same house 1 year ago (%) - Asian
Geographical mobility - Same house 1 year ago (%) - Hispanic or Latino
Geographical mobility - Same house 1 year ago (%) - American Indian and Alaska Native
Geographical mobility - Same house 1 year ago (%) - Multirace
Geographical mobility - Same house 1 year ago (%) - Other Race
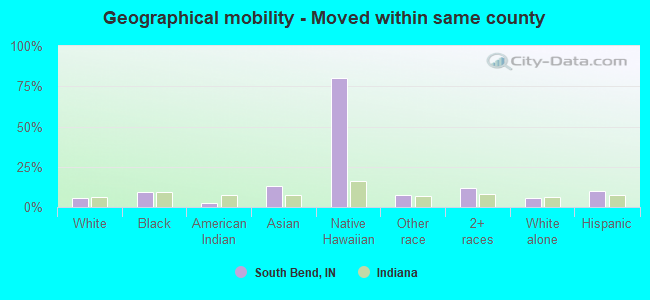
Geographical mobility - Moved within same county (%)
Geographical mobility - Moved within same county (%) - White
Geographical mobility - Moved within same county (%) - Black or African American
Geographical mobility - Moved within same county (%) - Asian
Geographical mobility - Moved within same county (%) - Hispanic or Latino
Geographical mobility - Moved within same county (%) - American Indian and Alaska Native
Geographical mobility - Moved within same county (%) - Multirace
Geographical mobility - Moved within same county (%) - Other Race
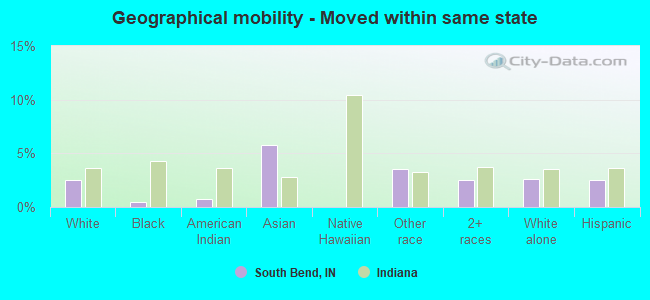
Geographical mobility - Moved from different county within same state (%)
Geographical mobility - Moved from different county within same state (%) - White
Geographical mobility - Moved from different county within same state (%) - Black or African American
Geographical mobility - Moved from different county within same state (%) - Asian
Geographical mobility - Moved from different county within same state (%) - Hispanic or Latino
Geographical mobility - Moved from different county within same state (%) - American Indian and Alaska Native
Geographical mobility - Moved from different county within same state (%) - Multirace
Geographical mobility - Moved from different county within same state (%) - Other Race
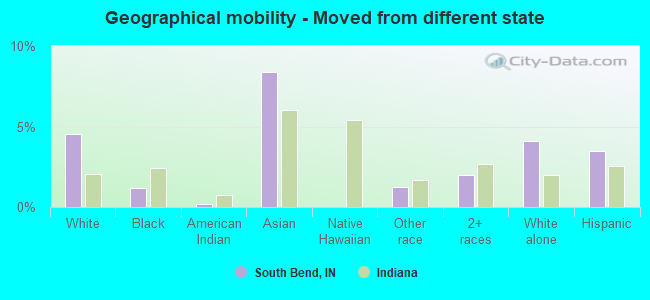
Geographical mobility - Moved from different state (%)
Geographical mobility - Moved from different state (%) - White
Geographical mobility - Moved from different state (%) - Black or African American
Geographical mobility - Moved from different state (%) - Asian
Geographical mobility - Moved from different state (%) - Hispanic or Latino
Geographical mobility - Moved from different state (%) - American Indian and Alaska Native
Geographical mobility - Moved from different state (%) - Multirace
Geographical mobility - Moved from different state (%) - Other Race
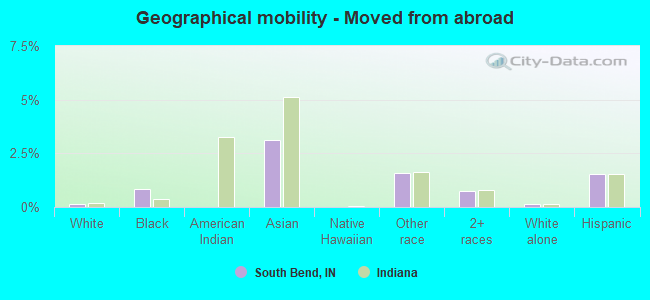
Geographical mobility - Moved from abroad (%)
Geographical mobility - Moved from abroad (%) - White
Geographical mobility - Moved from abroad (%) - Black or African American
Geographical mobility - Moved from abroad (%) - Asian
Geographical mobility - Moved from abroad (%) - Hispanic or Latino
Geographical mobility - Moved from abroad (%) - American Indian and Alaska Native
Geographical mobility - Moved from abroad (%) - Multirace
Geographical mobility - Moved from abroad (%) - Other Race
Place of birth for the foreign-born population - Ireland (%)
Place of birth for the foreign-born population - Denmark (%)
Place of birth for the foreign-born population - Norway (%)
Place of birth for the foreign-born population - Sweden (%)
Place of birth for the foreign-born population - United Kingdom (%)
Place of birth for the foreign-born population - England (%)
Place of birth for the foreign-born population - Scotland (%)
Place of birth for the foreign-born population - Other Northern Europe (%)
Place of birth for the foreign-born population - Austria (%)
Place of birth for the foreign-born population - Belgium (%)
Place of birth for the foreign-born population - France (%)
Place of birth for the foreign-born population - Germany (%)
Place of birth for the foreign-born population - Netherlands (%)
Place of birth for the foreign-born population - Switzerland (%)
Place of birth for the foreign-born population - Other Western Europe (%)
Place of birth for the foreign-born population - Greece (%)
Place of birth for the foreign-born population - Italy (%)
Place of birth for the foreign-born population - Portugal (%)
Place of birth for the foreign-born population - Spain (%)
Place of birth for the foreign-born population - Other Southern Europe (%)
Place of birth for the foreign-born population - Albania (%)
Place of birth for the foreign-born population - Belarus (%)
Place of birth for the foreign-born population - Bosnia and Herzegovina (%)
Place of birth for the foreign-born population - Bulgaria (%)
Place of birth for the foreign-born population - Croatia (%)
Place of birth for the foreign-born population - Czechoslovakia (%)
Place of birth for the foreign-born population - Hungary (%)
Place of birth for the foreign-born population - Latvia (%)
Place of birth for the foreign-born population - Lithuania (%)
Place of birth for the foreign-born population - North Macedonia (Macedonia) (%)
Place of birth for the foreign-born population - Moldova (%)
Place of birth for the foreign-born population - Poland (%)
Place of birth for the foreign-born population - Romania (%)
Place of birth for the foreign-born population - Russia (%)
Place of birth for the foreign-born population - Serbia (%)
Place of birth for the foreign-born population - Ukraine (%)
Place of birth for the foreign-born population - Other Eastern Europe (%)
Place of birth for the foreign-born population - China (%)
Place of birth for the foreign-born population - Hong Kong (%)
Place of birth for the foreign-born population - Taiwan (%)
Place of birth for the foreign-born population - Japan (%)
Place of birth for the foreign-born population - Korea (%)
Place of birth for the foreign-born population - Other Eastern Asia (%)
Place of birth for the foreign-born population - Afghanistan (%)
Place of birth for the foreign-born population - Bangladesh (%)
Place of birth for the foreign-born population - India (%)
Place of birth for the foreign-born population - Iran (%)
Place of birth for the foreign-born population - Kazakhstan (%)
Place of birth for the foreign-born population - Nepal (%)
Place of birth for the foreign-born population - Pakistan (%)
Place of birth for the foreign-born population - Sri Lanka (%)
Place of birth for the foreign-born population - Uzbekistan (%)
Place of birth for the foreign-born population - Other South Central Asia (%)
Place of birth for the foreign-born population - Burma (%)
Place of birth for the foreign-born population - Cambodia (%)
Place of birth for the foreign-born population - Indonesia (%)
Place of birth for the foreign-born population - Laos (%)
Place of birth for the foreign-born population - Malaysia (%)
Place of birth for the foreign-born population - Philippines (%)
Place of birth for the foreign-born population - Singapore (%)
Place of birth for the foreign-born population - Thailand (%)
Place of birth for the foreign-born population - Vietnam (%)
Place of birth for the foreign-born population - Other South Eastern Asia (%)
Place of birth for the foreign-born population - Armenia (%)
Place of birth for the foreign-born population - Iraq (%)
Place of birth for the foreign-born population - Israel (%)
Place of birth for the foreign-born population - Jordan (%)
Place of birth for the foreign-born population - Kuwait (%)
Place of birth for the foreign-born population - Lebanon (%)
Place of birth for the foreign-born population - Saudi Arabia (%)
Place of birth for the foreign-born population - Syria (%)
Place of birth for the foreign-born population - Turkey (%)
Place of birth for the foreign-born population - Yemen (%)
Place of birth for the foreign-born population - Other Western Asia (%)
Place of birth for the foreign-born population - Eritrea (%)
Place of birth for the foreign-born population - Ethiopia (%)
Place of birth for the foreign-born population - Kenya (%)
Place of birth for the foreign-born population - Somalia (%)
Place of birth for the foreign-born population - Uganda (%)
Place of birth for the foreign-born population - Zimbabwe (%)
Place of birth for the foreign-born population - Other Eastern Africa (%)
Place of birth for the foreign-born population - Cameroon (%)
Place of birth for the foreign-born population - Congo (%)
Place of birth for the foreign-born population - Democratic Republic of Congo (Zaire) (%)
Place of birth for the foreign-born population - Other Middle Africa (%)
Place of birth for the foreign-born population - Egypt (%)
Place of birth for the foreign-born population - Morocco (%)
Place of birth for the foreign-born population - Sudan (%)
Place of birth for the foreign-born population - Other Northern Africa (%)
Place of birth for the foreign-born population - South Africa (%)
Place of birth for the foreign-born population - Other Southern Africa (%)
Place of birth for the foreign-born population - Cabo Verde (%)
Place of birth for the foreign-born population - Ghana (%)
Place of birth for the foreign-born population - Liberia (%)
Place of birth for the foreign-born population - Nigeria (%)
Place of birth for the foreign-born population - Senegal (%)
Place of birth for the foreign-born population - Sierra Leone (%)
Place of birth for the foreign-born population - Other Western Africa (%)
Place of birth for the foreign-born population - Australia (%)
Place of birth for the foreign-born population - New Zealand (%)
Place of birth for the foreign-born population - Fiji (%)
Place of birth for the foreign-born population - Micronesia (%)
Place of birth for the foreign-born population - Bahamas (%)
Place of birth for the foreign-born population - Barbados (%)
Place of birth for the foreign-born population - Cuba (%)
Place of birth for the foreign-born population - Dominica (%)
Place of birth for the foreign-born population - Dominican Republic (%)
Place of birth for the foreign-born population - Grenada (%)
Place of birth for the foreign-born population - Haiti (%)
Place of birth for the foreign-born population - Jamaica (%)
Place of birth for the foreign-born population - St. Vincent and the Grenadines (%)
Place of birth for the foreign-born population - Trinidad and Tobago (%)
Place of birth for the foreign-born population - West Indies (%)
Place of birth for the foreign-born population - Other Caribbean (%)
Place of birth for the foreign-born population - Belize (%)
Place of birth for the foreign-born population - Costa Rica (%)
Place of birth for the foreign-born population - El Salvador (%)
Place of birth for the foreign-born population - Guatemala (%)
Place of birth for the foreign-born population - Honduras (%)
Place of birth for the foreign-born population - Mexico (%)
Place of birth for the foreign-born population - Nicaragua (%)
Place of birth for the foreign-born population - Panama (%)
Place of birth for the foreign-born population - Other Central America (%)
Place of birth for the foreign-born population - Argentina (%)
Place of birth for the foreign-born population - Bolivia (%)
Place of birth for the foreign-born population - Brazil (%)
Place of birth for the foreign-born population - Chile (%)
Place of birth for the foreign-born population - Colombia (%)
Place of birth for the foreign-born population - Ecuador (%)
Place of birth for the foreign-born population - Guyana (%)
Place of birth for the foreign-born population - Peru (%)
Place of birth for the foreign-born population - Uruguay (%)
Place of birth for the foreign-born population - Venezuela (%)
Place of birth for the foreign-born population - Other South America (%)
Place of birth for the foreign-born population - Canada (%)
Place of birth for the foreign-born population - Other Northern America (%)
Place of birth for the foreign-born population - Other (%)
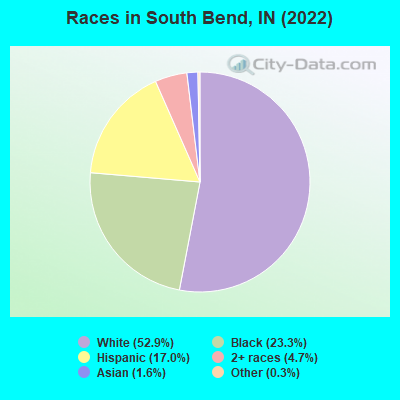
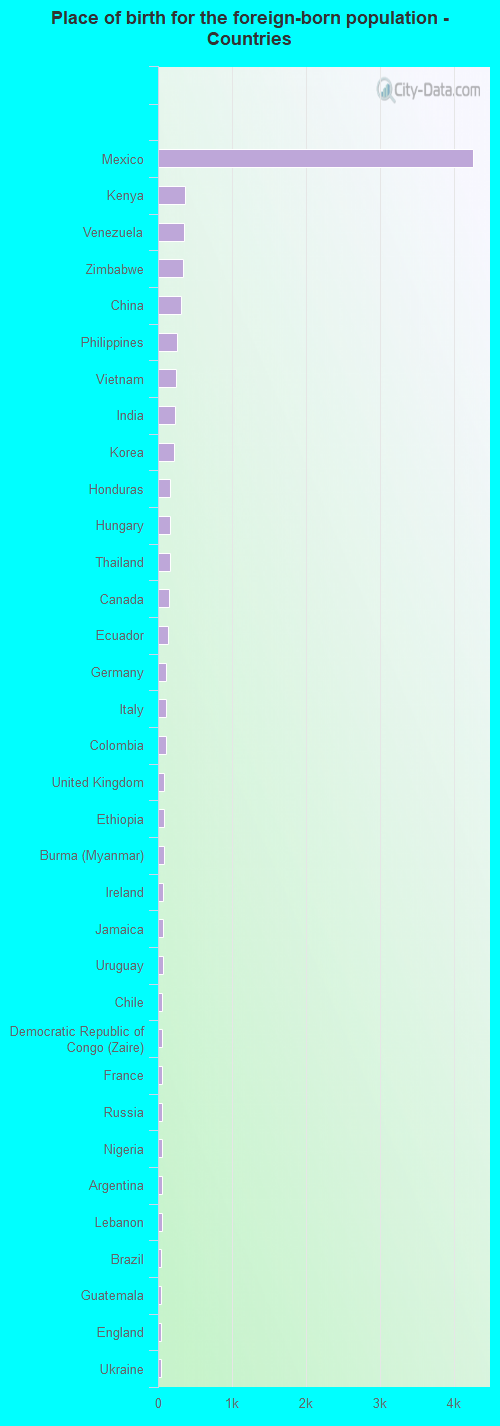
According to 2022 data, the most numerous races in South Bend, IN are White alone (56,080 residents), Black alone (24,746 residents), and Hispanic (17,987 residents). 82.9% of South Bend residents speak English at home. 9.3% of South Bend, IN residents are foreign-born (4.9% born in Latin America, 1.5% born in Asia, 1.1% born in Africa), which is 35.8% greater than the foreign-born rate of 6.0% across the entire state of Indiana.
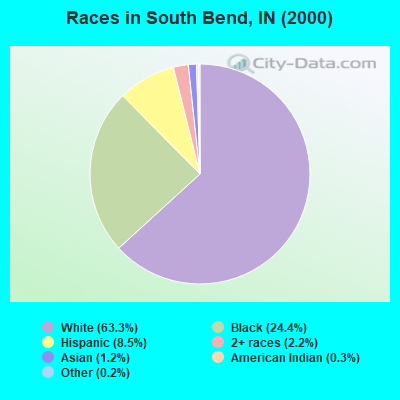
Race distribution in South Bend
2000 2022
68,202 63.3% White alone 26,259 24.4% Black alone 9,110 8.5% Hispanic 2,372 2.2% Two or more races 1,271 1.2% Asian alone 338 0.3% American Indian alone 188 0.2% Other race alone 49 0.05% Native Hawaiian and Other
56,080 52.9% White alone 24,746 23.3% Black alone 17,987 17.0% Hispanic 5,009 4.7% Two or more races 1,710 1.6% Asian alone 347 0.3% Other race alone 72 0.07% Native Hawaiian and Other 33 0.03% American Indian alone
2000 2022
5,219,373 85.8% White alone 505,462 8.3% Black alone 214,536 3.5% Hispanic 61,115 1.0% Two or more races 58,424 1.0% Asian alone 13,654 0.2% American Indian alone 6,348 0.1% Other race alone 1,573 0.03% Native Hawaiian and Other
5,192,455 76.0% White alone 628,054 9.2% Black alone 534,528 7.8% Hispanic 263,242 3.9% Two or more races 172,880 2.5% Asian alone 33,467 0.5% Other race alone 5,866 0.09% American Indian alone 2,545 0.04% Native Hawaiian and Other
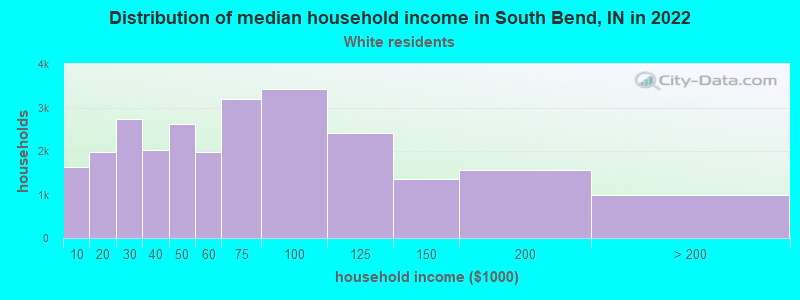
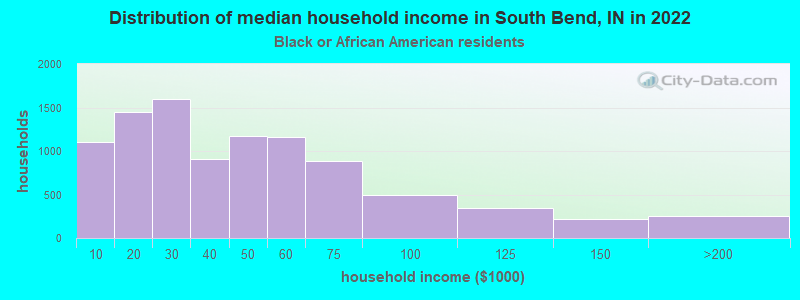
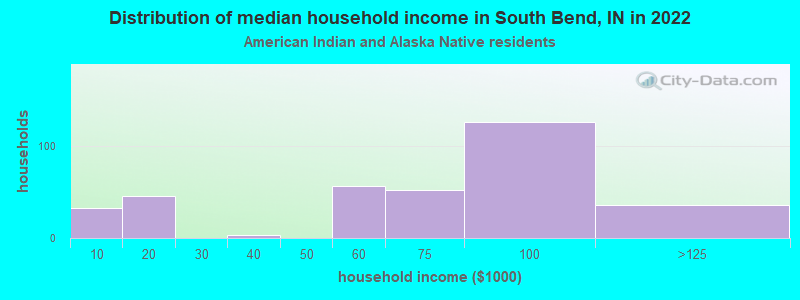
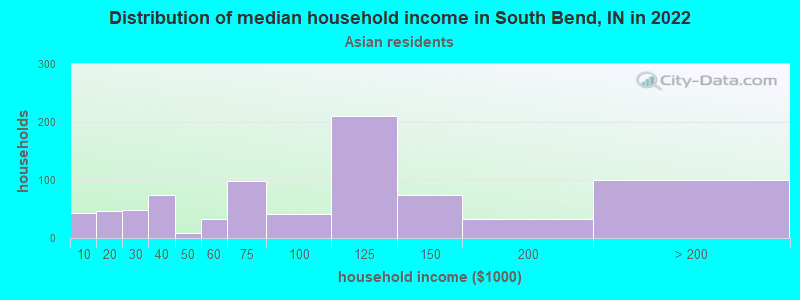
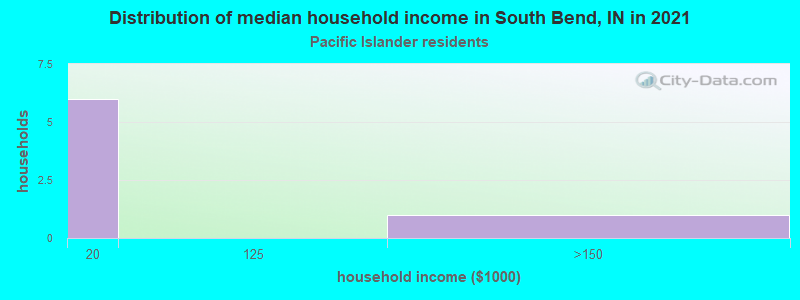
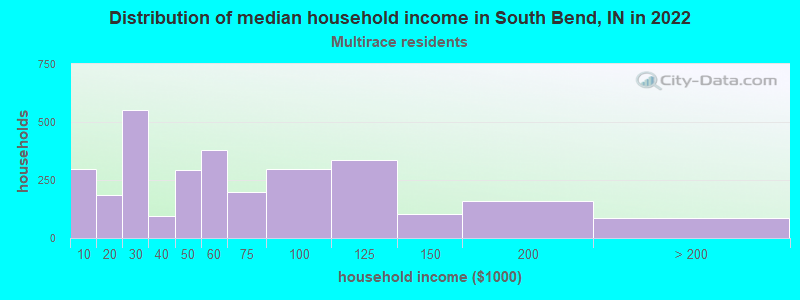
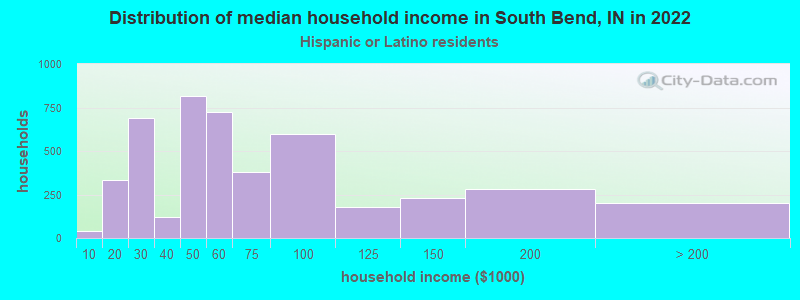
Income and house value in South Bend Median household income in 2022 $60,380 White non-Hispanic householders$36,498 Black householders$75,900 American Indian and Alaska Native householders$70,189 Asian householders$60,134 Some other race householders$53,184 Two or more races householders$54,032 Hispanic or Latino race householdersMedian 2022 house value $150,253 White Non-Hispanic householders$113,711 Black or African American householders$146,384 American Indian or Alaska Native householders $179,487 Asian householders$118,225 Native Hawaiian and other Pacific Islander householders$104,897 Some other race householders$134,991 Two or more races householders$111,776 Hispanic or Latino householders
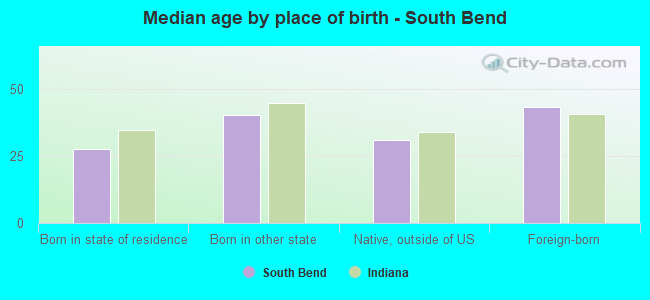
Median age by race in South Bend
39.2 Median age for White residents35.5 40.0 30.2 Median age for Black or African American residents27.4 32.4 22.7 Median age for American Indian / Alaska Native residents18.8 -666,666,666.0 41.9 Median age for Asian residents57.1 29.8 -666,666,666.0 Median age for Native Hawaiian / Pacific Islander residents-666,666,666.0 -666,666,666.0 32.7 Median age for Other race residents40.1 27.9 22.8 Median age for Two or more races residents22.5 23.3 40.0 Median age for White alone residents37.7 41.8 24.7 Median age for Hispanic or Latino residents24.0 25.4
Owner/renter occupied households by race in South Bend
House owners and renters - White residents 16,874 65.1% Owner occupied9,057 34.9% Renter occupiedHouse owners and renters - Black or African American residents 3,341 34.8% Owner occupied6,253 65.2% Renter occupiedHouse owners and renters - American Indian / Alaska Native residents 219 61.6% Owner occupied137 38.4% Renter occupiedHouse owners and renters - Asian residents 431 68.8% Owner occupied195 31.2% Renter occupiedHouse owners and renters - Native Hawaiian / Pacific Islander residents 12 100.0% Owner occupiedHouse owners and renters - Other race residents 826 53.7% Owner occupied712 46.3% Renter occupiedHouse owners and renters - Two or more races residents 2,257 61.9% Owner occupied1,391 38.1% Renter occupiedHouse owners and renters - White alone residents 16,577 65.2% Owner occupied8,842 34.8% Renter occupiedHouse owners and renters - Hispanic or Latino residents 2,969 64.6% Owner occupied1,630 35.4% Renter occupied
Language usage in South Bend
English speakers - Total 82.9% of residents of South Bend speak English at home.
12.8% of residents speak Spanish at home 7,323 58.3% Speak English very well5,234 41.7% Speak English less than very well4.3% of residents speak other language at home 3,381 80.0% Speak English very well847 20.0% Speak English less than very well
English speakers - Born in the United States 88.3% of residents of South Bend speak English at home.
10.5% of residents speak Spanish at home 2,653 84.1% Speak English very well502 15.9% Speak English less than very well1.3% of residents speak other language at home 377 100.0% Speak English very well
English speakers - Native, born elsewhere 62.9% of residents of South Bend speak English at home.
26.9% of residents speak Spanish at home 396 100.0% Speak English very well10.2% of residents speak other language at home 150 100.0% Speak English very well
English speakers - Foreign-born 11.5% of residents of South Bend speak English at home.
59.9% of residents speak Spanish at home 1,133 20.5% Speak English very well4,401 79.5% Speak English less than very well28.6% of residents speak other language at home 1,865 70.7% Speak English very well772 29.3% Speak English less than very well
White (Caucasian) - Speak only English Native:
95.2% (51,516)Foreign-born:
38.9% (493)
White (Caucasian) - Speak another language Native:
4.8% (2,623)Foreign-born:
61.1% (775)
Black or African American - Speak only English Native:
96.6% (21,287)Foreign-born:
13.5% (176)
Black or African American - Speak another language Native:
3.4% (752)Foreign-born:
86.5% (1,126)
American Indian / Alaska Native - Speak another language Native:
71.6% (426)Foreign-born:
100.0% (170)
Asian - Speak only English Native:
55.4% (228)Foreign-born:
38.5% (580)
Asian - Speak another language Native:
40.5% (167)Foreign-born:
66.0% (996)
Other race - Speak only English Native:
40.6% (968)Foreign-born:
7.6% (176)
Other race - Speak another language Native:
59.4% (1,415)Foreign-born:
92.4% (2,130)
Two or more races - Speak only English Native:
67.0% (6,420)Foreign-born:
2.6% (75)
Two or more races - Speak another language Native:
33.0% (3,159)Foreign-born:
97.4% (2,835)
White alone - Speak only English Native:
96.5% (50,727)Foreign-born:
53.9% (492)
White alone - Speak another language Native:
3.5% (1,819)Foreign-born:
46.1% (420)
Hispanic or Latino - Speak only English Native:
47.8% (4,831)Foreign-born:
3.1% (178)
Hispanic or Latino - Speak another language Native:
52.2% (5,266)Foreign-born:
96.9% (5,534)
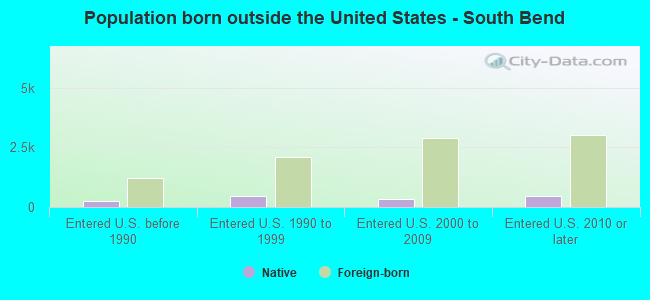
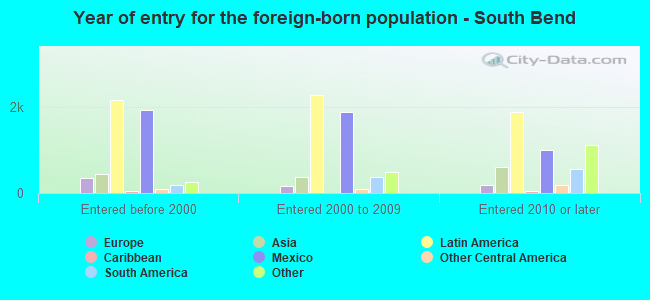
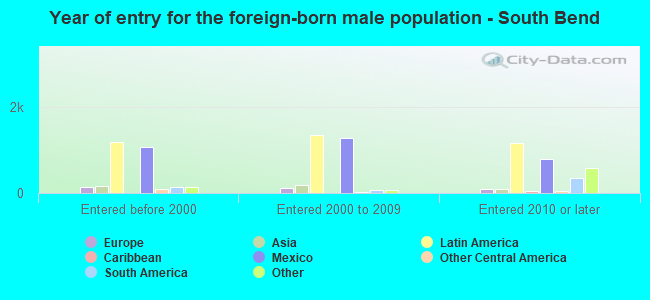
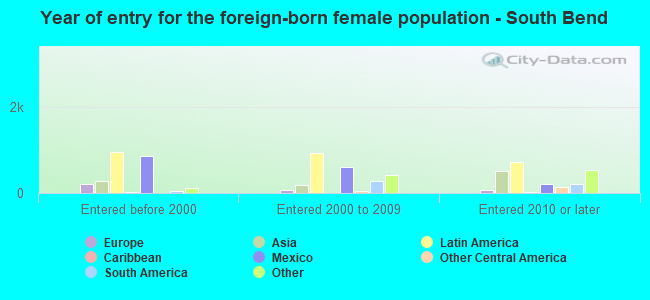
Foreign-born residents in South Bend 9,630 residents are foreign born (4.9% Latin America , 1.5% Asia , 1.1% Africa ).
This city:
9.3%Indiana:
5.6%
Marital status for residents in South Bend Marital status - White (Caucasian) population 15 years and over
Males 39.5% Never married46.2% Now married0.7% Separated4.1% Widowed9.4% DivorcedFemales 37.0% Never married41.3% Now married0.3% Separated8.7% Widowed12.8% DivorcedWomen who gave birth in the past 12 months Now married:
81.9% (569)Unmarried:
18.1% (126)
Women who did not give birth in the past 12 months Now married:
34.0% (4,731)Unmarried:
66.0% (9,174)
Marital status - Black or African American population 15 years and over
Males 60.6% Never married25.1% Now married0.5% Separated2.7% Widowed11.1% DivorcedFemales 47.7% Never married21.4% Now married3.7% Separated8.0% Widowed19.3% DivorcedWomen who gave birth in the past 12 months Now married:
55.3% (78)Unmarried:
44.7% (63)
Women who did not give birth in the past 12 months Now married:
19.8% (1,260)Unmarried:
80.2% (5,117)
Marital status - American Indian / Alaska Native population 15 years and over
Males 52.0% Never married26.2% Now married9.6% Separated3.1% Widowed9.2% DivorcedFemales 14.7% Never married47.8% Now married0.0% Separated0.0% Widowed37.5% DivorcedWomen who did not give birth in the past 12 months Now married:
75.3% (144)Unmarried:
24.7% (47)
Marital status - Asian population 15 years and over
Males 44.2% Never married47.4% Now married0.0% Separated1.5% Widowed6.8% DivorcedFemales 39.0% Never married42.4% Now married2.2% Separated2.2% Widowed14.1% DivorcedWomen who did not give birth in the past 12 months Now married:
40.8% (363)Unmarried:
59.2% (527)
Marital status - Other race population 15 years and over
Males 58.0% Never married31.3% Now married3.4% Separated0.0% Widowed7.2% DivorcedFemales 50.6% Never married33.7% Now married5.5% Separated0.7% Widowed9.6% DivorcedWomen who gave birth in the past 12 months Now married:
70.7% (35)Unmarried:
29.3% (15)
Women who did not give birth in the past 12 months Now married:
35.8% (690)Unmarried:
64.2% (1,239)
Marital status - Two or more races population 15 years and over
Males 60.2% Never married28.1% Now married2.3% Separated0.0% Widowed9.4% DivorcedFemales 48.2% Never married33.0% Now married2.4% Separated3.3% Widowed13.1% DivorcedWomen who gave birth in the past 12 months Now married:
100.0% (120)Unmarried:
0.0% (0)
Women who did not give birth in the past 12 months Now married:
27.8% (789)Unmarried:
72.2% (2,051)
Marital status - White alone, not Hispanic / Latino population 15 years and over
Males 38.7% Never married46.7% Now married0.7% Separated4.2% Widowed9.7% DivorcedFemales 36.5% Never married41.3% Now married0.3% Separated8.9% Widowed13.0% DivorcedWomen who gave birth in the past 12 months Now married:
80.7% (526)Unmarried:
19.3% (126)
Women who did not give birth in the past 12 months Now married:
34.7% (4,680)Unmarried:
65.3% (8,824)
Marital status - Hispanic or Latino population 15 years and over
Males 50.8% Never married32.7% Now married5.3% Separated0.0% Widowed11.2% DivorcedFemales 41.0% Never married41.0% Now married3.8% Separated2.8% Widowed11.4% DivorcedWomen who gave birth in the past 12 months Now married:
100.0% (125)Unmarried:
0.0% (0)
Women who did not give birth in the past 12 months Now married:
37.4% (1,490)Unmarried:
62.6% (2,490)
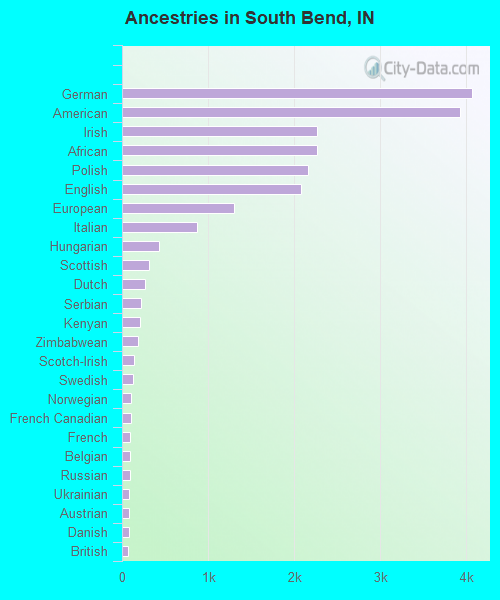
Ancestries in South Bend
4,060 7.9% German3,922 7.6% American2,264 4.4% Irish2,263 4.4% African2,166 4.2% Polish2,083 4.0% English1,303 2.5% European875 1.7% Italian425 0.8% Hungarian318 0.6% Scottish268 0.5% Dutch226 0.4% Serbian208 0.4% Kenyan181 0.4% Zimbabwean134 0.3% Scotch-Irish126 0.2% Swedish109 0.2% Norwegian105 0.2% French Canadian93 0.2% French91 0.2% Belgian91 0.2% Russian86 0.2% Ukrainian80 0.2% Austrian77 0.1% Danish72 0.1% British72 0.1% Eastern European72 0.1% Greek69 0.1% Scandinavian64 0.1% Ethiopian62 0.1% Ghanaian59 0.1% Liberian54 0.1% Northern European54 0.1% Jamaican51 0.10% Lithuanian40 0.08% Canadian40 0.08% Welsh39 0.08% Pennsylvania German39 0.08% Haitian37 0.07% Swiss37 0.07% Nigerian36 0.07% Croatian34 0.07% Assyrian29 0.06% Yugoslavian28 0.05% Guyanese22 0.04% Lebanese19 0.04% Iranian17 0.03% Cajun16 0.03% Sierra Leonean14 0.03% Slavic13 0.03% Czech11 0.02% Luxembourger10 0.02% Cape Verdean9 0.02% Brazilian9 0.02% Palestinian8 0.02% Finnish6 0.01% Maltese5 0.01% Armenian5 0.01% Syrian5 0.01% Carpatho Rusyn
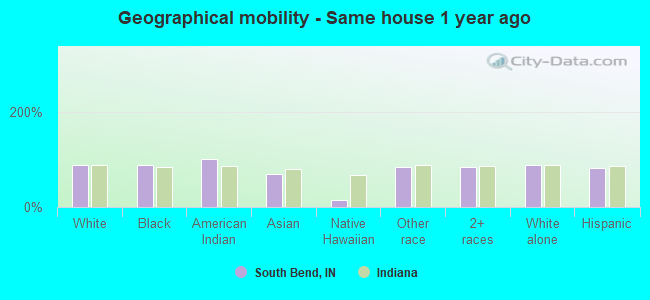
Geographical mobility in South Bend Same house 1 year ago 51,046 87.3% White (Caucasian)22,061 88.2% Black or African American902 100.0% American Indian / Alaska Native1,331 69.3% Asian10 15.2% Native Hawaiian / Pacific Islander4,721 84.2% Other race11,791 82.8% Two or more races48,685 87.4% White alone, not Hispanic / Latino14,371 82.4% Hispanic or LatinoMoved within same county 3,238 5.5% White / Caucasian2,325 9.3% Black or African American23 2.6% American Indian / Alaska Native253 13.2% Asian51 80.4% Native Hawaiian / Pacific Islander401 7.2% Other race1,696 11.9% Two or more races3,238 5.8% White alone, not Hispanic / Latino1,754 10.1% Hispanic or LatinoMoved within same state 1,456 2.5% White / Caucasian108 0.4% Black or African American6 0.7% American Indian / Alaska Native112 5.8% Asian198 3.5% Other race361 2.5% Two or more races1,436 2.6% White alone, not Hispanic / Latino437 2.5% Hispanic or LatinoMoved from different state 2,640 4.5% White / Caucasian302 1.2% Black or African American2 0.2% American Indian / Alaska Native161 8.4% Asian69 1.2% Other race287 2.0% Two or more races2,288 4.1% White alone, not Hispanic / Latino611 3.5% Hispanic or LatinoMoved from abroad 69 0.1% White214 0.9% Black or African American60 3.1% Asian88 1.6% Other race106 0.7% Two or more races68 0.1% White alone, not Hispanic / Latino268 1.5% Hispanic or Latino
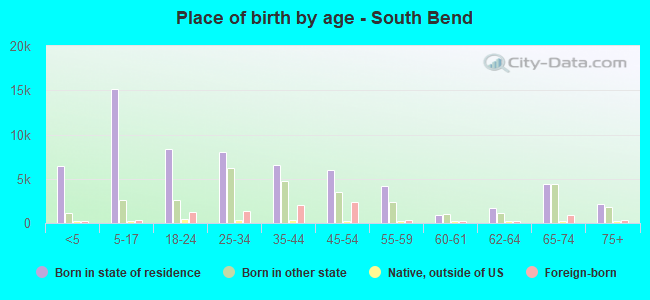
Children Nativity (place of birth) in South Bend
Children under 6 years - Living with two parents Both parents native 4,386 100.0% NativeBoth parents foreign-born 379 89.6% Native44 10.4% Foreign-bornOne native, one foreign-born parent 588 100.0% NativeChildren under 6 years - Living with one parent Native parent 3,478 100.0% NativeForeign-born parent 498 100.0% NativeChildren 6 to 17 years - Living with two parents Both parents native 6,071 99.0% Native62 1.0% Foreign-bornBoth parents foreign-born 954 89.2% Native115 10.8% Foreign-bornOne native, one foreign-born parent 499 87.9% Native69 12.1% Foreign-bornChildren 6 to 17 years - Living with one parent Native parent 6,938 100.0% NativeForeign-born parent 614 50.0% Native614 50.0% Foreign-born
Grandparents responsible for own grandchildren in South Bend
Grandparents (30 to 59 years) White / Caucasian 296 59.1% Responsible for grandchildren205 40.9% Not responsible for grandchildrenBlack or African American 251 60.4% Responsible for grandchildren165 39.6% Not responsible for grandchildrenOther race 40 100.0% Not responsible for grandchildrenTwo or more races 107 99.0% Responsible for grandchildren1 1.0% Not responsible for grandchildrenWhite alone, not Hispanic / Latino 276 67.2% Responsible for grandchildren135 32.8% Not responsible for grandchildrenHispanic or Latino 57 53.2% Responsible for grandchildren50 46.8% Not responsible for grandchildrenGrandparents (60 years and over) White / Caucasian 123 100.0% Not responsible for grandchildrenBlack or African American 41 29.5% Responsible for grandchildren97 70.5% Not responsible for grandchildrenOther race 4 6.2% Responsible for grandchildren66 93.8% Not responsible for grandchildrenTwo or more races 2 3.2% Responsible for grandchildren61 96.8% Not responsible for grandchildrenWhite alone, not Hispanic / Latino 48 30.5% Responsible for grandchildren110 69.5% Not responsible for grandchildrenHispanic or Latino 8 5.7% Responsible for grandchildren138 94.3% Not responsible for grandchildren