Races in South Orange, New Jersey (NJ) Detailed Stats
Ancestries, Foreign-born residents, place of birth

Recent posts about races in South Orange, New Jersey on our local forum with over 2,400,000 registered users:
 | Maplewood right next to Irvington - is this house worth it?? (23 replies) |
| Looking to Move from South Orange (15 replies) |
| Surviving homelessness in North Jersey (72 replies) |
| Majority Black middle class suburbs (98 replies) |
| South Orange vs. Morris Township vs. Bernardsville (11 replies) |
| How to find a rental a house in Montclair NJ area? (6 replies) |
16.9% of South Orange, NJ residents are foreign-born (7.8% born in Latin America, 3.9% born in Europe, 2.5% born in Asia, 2.0% born in Africa), which is 36.0% less than the foreign-born rate of 23.0% across the entire state of New Jersey.
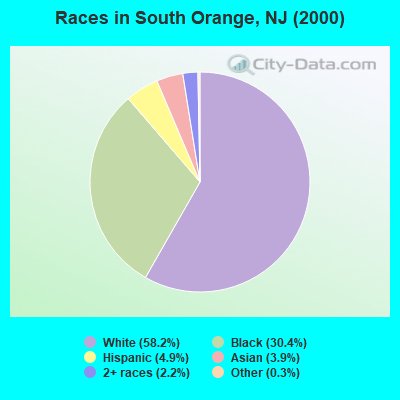
Race distribution in South Orange

- 9,87158.2%White alone
- 5,15030.4%Black alone
- 8374.9%Hispanic
- 6593.9%Asian alone
- 3752.2%Two or more races
- 510.3%Other race alone
- 160.09%American Indian alone
- 50.03%Native Hawaiian and Other
Pacific Islander alone
2000
2022
-
- 5,557,20966.0%White alone
- 1,117,19113.3%Hispanic
- 1,096,17113.0%Black alone
- 477,0125.7%Asian alone
- 133,6891.6%Two or more races
- 19,5650.2%Other race alone
- 11,3380.1%American Indian alone
- 2,1750.03%Native Hawaiian and Other
Pacific Islander alone

-
- 4,766,47651.5%White alone
- 2,028,47021.9%Hispanic
- 1,111,63212.0%Black alone
- 923,54610.0%Asian alone
- 332,2373.6%Two or more races
- 89,8471.0%Other race alone
- 8,5570.09%American Indian alone
- 9340.01%Native Hawaiian and Other
Pacific Islander alone

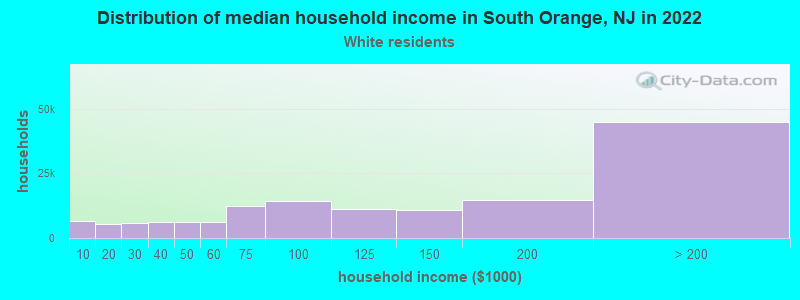
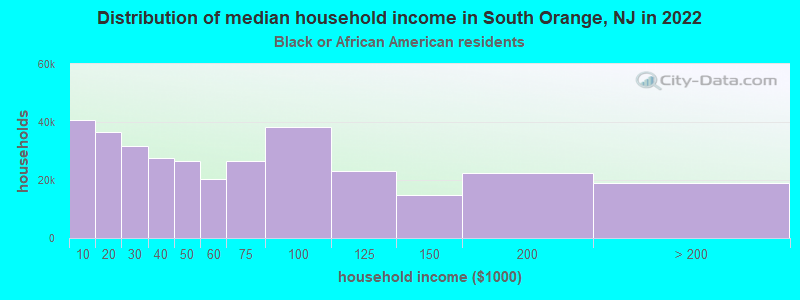
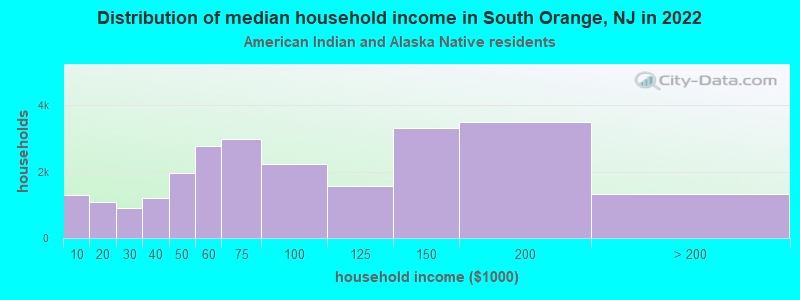
Income and house value in South Orange
- Median household income in 2022
- $151,953White non-Hispanic householders
- $137,503Black householders
- $129,537American Indian and Alaska Native householders
- $179,054Asian householders
- $129,923Some other race householders
- $149,489Two or more races householders
- $142,611Hispanic or Latino race householders
- Median 2022 house value
- $812,485White Non-Hispanic householders
- $549,961Black or African American householders
- $295,043American Indian or Alaska Native householders
- $578,285Asian householders
- $519,801Some other race householders
- $491,739Two or more races householders
- $691,320Hispanic or Latino householders
Household income for White non-Hispanic householders
Household income for Black householders
Household income for American Indian and Alaska Native householders
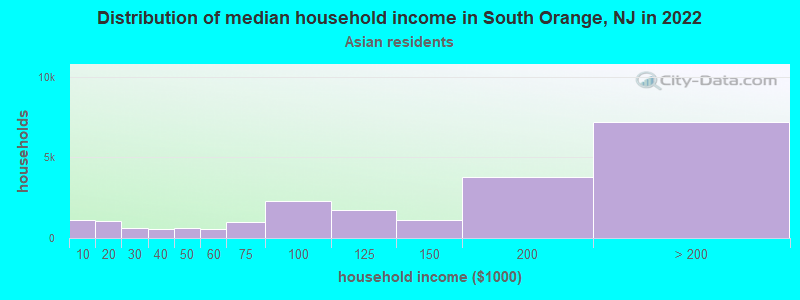
Household income for Asian householders
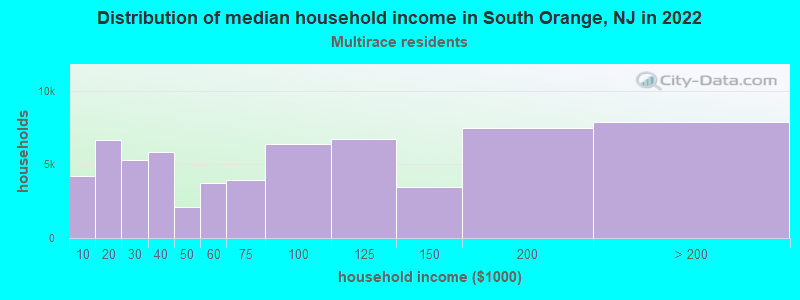
Household income for Two or more races householders
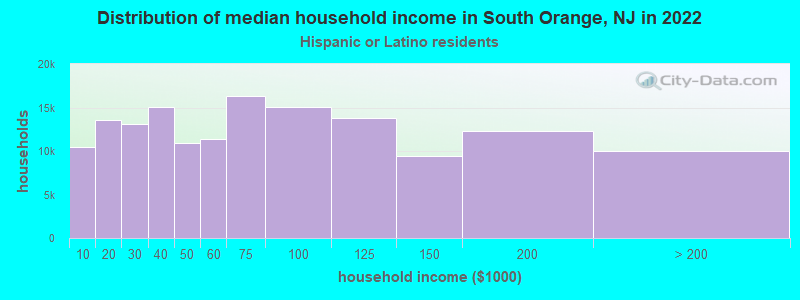
Household income for Hispanic or Latino race householders
Foreign-born residents in South Orange
2,869 residents are foreign born (7.8% Latin America, 3.9% Europe, 2.5% Asia, 2.0% Africa).
| This city: | 16.9% |
| New Jersey: | 17.5% |
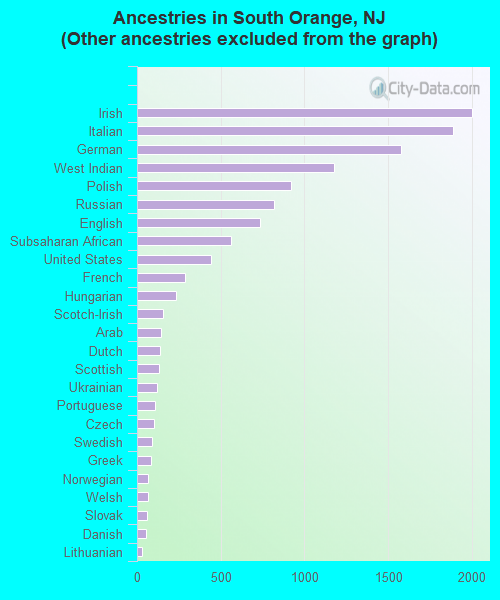
Ancestries in South Orange

- 6,51835.1%Other
- 2,00310.8%Irish
- 1,88710.2%Italian
- 1,5808.5%German
- 1,1776.3%West Indian
- 9215.0%Polish
- 8194.4%Russian
- 7364.0%English
- 5603.0%Subsaharan African
- 4422.4%United States
- 2851.5%French
- 2351.3%Hungarian
- 1540.8%Scotch-Irish
- 1450.8%Arab
- 1400.8%Dutch
- 1320.7%Scottish
- 1200.6%Ukrainian
- 1100.6%Portuguese
- 1000.5%Czech
- 920.5%Swedish
- 810.4%Greek
- 670.4%Norwegian
- 630.3%Welsh
- 580.3%Slovak
- 530.3%Danish
- 270.1%Lithuanian
- 210.1%Swiss
- 190.1%French Canadian
Zip codes: 07079.