Races in Spring, Texas (TX) Detailed Stats
Data:
Races - White alone (%)
Races - White alone (% change since 2000)
Races - Black alone (%)
Races - Black alone (% change since 2000)
Races - American Indian alone (%)
Races - American Indian alone (% change since 2000)
Races - Asian alone (%)
Races - Asian alone (% change since 2000)
Races - Hispanic (%)
Races - Hispanic (% change since 2000)
Races - Native Hawaiian and Other Pacific Islander alone (%)
Races - Native Hawaiian and Other Pacific Islander alone (% change since 2000)
Races - Two or more races(%)
Races - Two or more races(% change since 2000)
Races - Other race alone (%)
Races - Other race alone (% change since 2000)
Racial diversity
Place of birth - Born in state of residence (%)
Place of birth - Born in state of residence (%) - White
Place of birth - Born in state of residence (%) - Black or African American
Place of birth - Born in state of residence (%) - Asian
Place of birth - Born in state of residence (%) - Hispanic or Latino
Place of birth - Born in state of residence (%) - American Indian and Alaska Native
Place of birth - Born in state of residence (%) - Multirace
Place of birth - Born in state of residence (%) - Other Race
Place of birth - Born in other state (%)
Place of birth - Born in other state (%) - White
Place of birth - Born in other state (%) - Black or African American
Place of birth - Born in other state (%) - Asian
Place of birth - Born in other state (%) - Hispanic or Latino
Place of birth - Born in other state (%) - American Indian and Alaska Native
Place of birth - Born in other state (%) - Multirace
Place of birth - Born in other state (%) - Other Race
Place of birth - Native, outside of US (%)
Place of birth - Native, outside of US (%) - White
Place of birth - Native, outside of US (%) - Black or African American
Place of birth - Native, outside of US (%) - Asian
Place of birth - Native, outside of US (%) - Hispanic or Latino
Place of birth - Native, outside of US (%) - American Indian and Alaska Native
Place of birth - Native, outside of US (%) - Multirace
Place of birth - Native, outside of US (%) - Other Race
Place of birth - Foreign born (%)
Place of birth - Foreign born (%) - White
Place of birth - Foreign born (%) - Black or African American
Place of birth - Foreign born (%) - Asian
Place of birth - Foreign born (%) - Hispanic or Latino
Place of birth - Foreign born (%) - American Indian and Alaska Native
Place of birth - Foreign born (%) - Multirace
Place of birth - Foreign born (%) - Other Race
Residents speaking English at home (%)
Residents speaking English at home - Born in the United States (%)
Residents speaking English at home - Native, born elsewhere (%)
Residents speaking English at home - Foreign born (%)
Residents speaking Spanish at home (%)
Residents speaking Spanish at home - Born in the United States (%)
Residents speaking Spanish at home - Native, born elsewhere (%)
Residents speaking Spanish at home - Foreign born (%)
Residents speaking other language at home (%)
Residents speaking other language at home - Born in the United States (%)
Residents speaking other language at home - Native, born elsewhere (%)
Residents speaking other language at home - Foreign born (%)
Marital status - Never married (%)
Marital status - Now married (%)
Marital status - Separated (%)
Marital status - Widowed (%)
Marital status - Divorced (%)
Ancestries Reported - Arab (%)
Ancestries Reported - Czech (%)
Ancestries Reported - Danish (%)
Ancestries Reported - Dutch (%)
Ancestries Reported - English (%)
Ancestries Reported - French (%)
Ancestries Reported - French Canadian (%)
Ancestries Reported - German (%)
Ancestries Reported - Greek (%)
Ancestries Reported - Hungarian (%)
Ancestries Reported - Irish (%)
Ancestries Reported - Italian (%)
Ancestries Reported - Lithuanian (%)
Ancestries Reported - Norwegian (%)
Ancestries Reported - Polish (%)
Ancestries Reported - Portuguese (%)
Ancestries Reported - Russian (%)
Ancestries Reported - Scotch-Irish (%)
Ancestries Reported - Scottish (%)
Ancestries Reported - Slovak (%)
Ancestries Reported - Subsaharan African (%)
Ancestries Reported - Swedish (%)
Ancestries Reported - Swiss (%)
Ancestries Reported - Ukrainian (%)
Ancestries Reported - United States (%)
Ancestries Reported - Welsh (%)
Ancestries Reported - West Indian (%)
Ancestries Reported - Other (%)
Geographical mobility - Same house 1 year ago (%)
Geographical mobility - Same house 1 year ago (%) - White
Geographical mobility - Same house 1 year ago (%) - Black or African American
Geographical mobility - Same house 1 year ago (%) - Asian
Geographical mobility - Same house 1 year ago (%) - Hispanic or Latino
Geographical mobility - Same house 1 year ago (%) - American Indian and Alaska Native
Geographical mobility - Same house 1 year ago (%) - Multirace
Geographical mobility - Same house 1 year ago (%) - Other Race
Geographical mobility - Moved within same county (%)
Geographical mobility - Moved within same county (%) - White
Geographical mobility - Moved within same county (%) - Black or African American
Geographical mobility - Moved within same county (%) - Asian
Geographical mobility - Moved within same county (%) - Hispanic or Latino
Geographical mobility - Moved within same county (%) - American Indian and Alaska Native
Geographical mobility - Moved within same county (%) - Multirace
Geographical mobility - Moved within same county (%) - Other Race
Geographical mobility - Moved from different county within same state (%)
Geographical mobility - Moved from different county within same state (%) - White
Geographical mobility - Moved from different county within same state (%) - Black or African American
Geographical mobility - Moved from different county within same state (%) - Asian
Geographical mobility - Moved from different county within same state (%) - Hispanic or Latino
Geographical mobility - Moved from different county within same state (%) - American Indian and Alaska Native
Geographical mobility - Moved from different county within same state (%) - Multirace
Geographical mobility - Moved from different county within same state (%) - Other Race
Geographical mobility - Moved from different state (%)
Geographical mobility - Moved from different state (%) - White
Geographical mobility - Moved from different state (%) - Black or African American
Geographical mobility - Moved from different state (%) - Asian
Geographical mobility - Moved from different state (%) - Hispanic or Latino
Geographical mobility - Moved from different state (%) - American Indian and Alaska Native
Geographical mobility - Moved from different state (%) - Multirace
Geographical mobility - Moved from different state (%) - Other Race
Geographical mobility - Moved from abroad (%)
Geographical mobility - Moved from abroad (%) - White
Geographical mobility - Moved from abroad (%) - Black or African American
Geographical mobility - Moved from abroad (%) - Asian
Geographical mobility - Moved from abroad (%) - Hispanic or Latino
Geographical mobility - Moved from abroad (%) - American Indian and Alaska Native
Geographical mobility - Moved from abroad (%) - Multirace
Geographical mobility - Moved from abroad (%) - Other Race
Place of birth for the foreign-born population - Ireland (%)
Place of birth for the foreign-born population - Denmark (%)
Place of birth for the foreign-born population - Norway (%)
Place of birth for the foreign-born population - Sweden (%)
Place of birth for the foreign-born population - United Kingdom (%)
Place of birth for the foreign-born population - England (%)
Place of birth for the foreign-born population - Scotland (%)
Place of birth for the foreign-born population - Other Northern Europe (%)
Place of birth for the foreign-born population - Austria (%)
Place of birth for the foreign-born population - Belgium (%)
Place of birth for the foreign-born population - France (%)
Place of birth for the foreign-born population - Germany (%)
Place of birth for the foreign-born population - Netherlands (%)
Place of birth for the foreign-born population - Switzerland (%)
Place of birth for the foreign-born population - Other Western Europe (%)
Place of birth for the foreign-born population - Greece (%)
Place of birth for the foreign-born population - Italy (%)
Place of birth for the foreign-born population - Portugal (%)
Place of birth for the foreign-born population - Spain (%)
Place of birth for the foreign-born population - Other Southern Europe (%)
Place of birth for the foreign-born population - Albania (%)
Place of birth for the foreign-born population - Belarus (%)
Place of birth for the foreign-born population - Bosnia and Herzegovina (%)
Place of birth for the foreign-born population - Bulgaria (%)
Place of birth for the foreign-born population - Croatia (%)
Place of birth for the foreign-born population - Czechoslovakia (%)
Place of birth for the foreign-born population - Hungary (%)
Place of birth for the foreign-born population - Latvia (%)
Place of birth for the foreign-born population - Lithuania (%)
Place of birth for the foreign-born population - North Macedonia (Macedonia) (%)
Place of birth for the foreign-born population - Moldova (%)
Place of birth for the foreign-born population - Poland (%)
Place of birth for the foreign-born population - Romania (%)
Place of birth for the foreign-born population - Russia (%)
Place of birth for the foreign-born population - Serbia (%)
Place of birth for the foreign-born population - Ukraine (%)
Place of birth for the foreign-born population - Other Eastern Europe (%)
Place of birth for the foreign-born population - China (%)
Place of birth for the foreign-born population - Hong Kong (%)
Place of birth for the foreign-born population - Taiwan (%)
Place of birth for the foreign-born population - Japan (%)
Place of birth for the foreign-born population - Korea (%)
Place of birth for the foreign-born population - Other Eastern Asia (%)
Place of birth for the foreign-born population - Afghanistan (%)
Place of birth for the foreign-born population - Bangladesh (%)
Place of birth for the foreign-born population - India (%)
Place of birth for the foreign-born population - Iran (%)
Place of birth for the foreign-born population - Kazakhstan (%)
Place of birth for the foreign-born population - Nepal (%)
Place of birth for the foreign-born population - Pakistan (%)
Place of birth for the foreign-born population - Sri Lanka (%)
Place of birth for the foreign-born population - Uzbekistan (%)
Place of birth for the foreign-born population - Other South Central Asia (%)
Place of birth for the foreign-born population - Burma (%)
Place of birth for the foreign-born population - Cambodia (%)
Place of birth for the foreign-born population - Indonesia (%)
Place of birth for the foreign-born population - Laos (%)
Place of birth for the foreign-born population - Malaysia (%)
Place of birth for the foreign-born population - Philippines (%)
Place of birth for the foreign-born population - Singapore (%)
Place of birth for the foreign-born population - Thailand (%)
Place of birth for the foreign-born population - Vietnam (%)
Place of birth for the foreign-born population - Other South Eastern Asia (%)
Place of birth for the foreign-born population - Armenia (%)
Place of birth for the foreign-born population - Iraq (%)
Place of birth for the foreign-born population - Israel (%)
Place of birth for the foreign-born population - Jordan (%)
Place of birth for the foreign-born population - Kuwait (%)
Place of birth for the foreign-born population - Lebanon (%)
Place of birth for the foreign-born population - Saudi Arabia (%)
Place of birth for the foreign-born population - Syria (%)
Place of birth for the foreign-born population - Turkey (%)
Place of birth for the foreign-born population - Yemen (%)
Place of birth for the foreign-born population - Other Western Asia (%)
Place of birth for the foreign-born population - Eritrea (%)
Place of birth for the foreign-born population - Ethiopia (%)
Place of birth for the foreign-born population - Kenya (%)
Place of birth for the foreign-born population - Somalia (%)
Place of birth for the foreign-born population - Uganda (%)
Place of birth for the foreign-born population - Zimbabwe (%)
Place of birth for the foreign-born population - Other Eastern Africa (%)
Place of birth for the foreign-born population - Cameroon (%)
Place of birth for the foreign-born population - Congo (%)
Place of birth for the foreign-born population - Democratic Republic of Congo (Zaire) (%)
Place of birth for the foreign-born population - Other Middle Africa (%)
Place of birth for the foreign-born population - Egypt (%)
Place of birth for the foreign-born population - Morocco (%)
Place of birth for the foreign-born population - Sudan (%)
Place of birth for the foreign-born population - Other Northern Africa (%)
Place of birth for the foreign-born population - South Africa (%)
Place of birth for the foreign-born population - Other Southern Africa (%)
Place of birth for the foreign-born population - Cabo Verde (%)
Place of birth for the foreign-born population - Ghana (%)
Place of birth for the foreign-born population - Liberia (%)
Place of birth for the foreign-born population - Nigeria (%)
Place of birth for the foreign-born population - Senegal (%)
Place of birth for the foreign-born population - Sierra Leone (%)
Place of birth for the foreign-born population - Other Western Africa (%)
Place of birth for the foreign-born population - Australia (%)
Place of birth for the foreign-born population - New Zealand (%)
Place of birth for the foreign-born population - Fiji (%)
Place of birth for the foreign-born population - Micronesia (%)
Place of birth for the foreign-born population - Bahamas (%)
Place of birth for the foreign-born population - Barbados (%)
Place of birth for the foreign-born population - Cuba (%)
Place of birth for the foreign-born population - Dominica (%)
Place of birth for the foreign-born population - Dominican Republic (%)
Place of birth for the foreign-born population - Grenada (%)
Place of birth for the foreign-born population - Haiti (%)
Place of birth for the foreign-born population - Jamaica (%)
Place of birth for the foreign-born population - St. Vincent and the Grenadines (%)
Place of birth for the foreign-born population - Trinidad and Tobago (%)
Place of birth for the foreign-born population - West Indies (%)
Place of birth for the foreign-born population - Other Caribbean (%)
Place of birth for the foreign-born population - Belize (%)
Place of birth for the foreign-born population - Costa Rica (%)
Place of birth for the foreign-born population - El Salvador (%)
Place of birth for the foreign-born population - Guatemala (%)
Place of birth for the foreign-born population - Honduras (%)
Place of birth for the foreign-born population - Mexico (%)
Place of birth for the foreign-born population - Nicaragua (%)
Place of birth for the foreign-born population - Panama (%)
Place of birth for the foreign-born population - Other Central America (%)
Place of birth for the foreign-born population - Argentina (%)
Place of birth for the foreign-born population - Bolivia (%)
Place of birth for the foreign-born population - Brazil (%)
Place of birth for the foreign-born population - Chile (%)
Place of birth for the foreign-born population - Colombia (%)
Place of birth for the foreign-born population - Ecuador (%)
Place of birth for the foreign-born population - Guyana (%)
Place of birth for the foreign-born population - Peru (%)
Place of birth for the foreign-born population - Uruguay (%)
Place of birth for the foreign-born population - Venezuela (%)
Place of birth for the foreign-born population - Other South America (%)
Place of birth for the foreign-born population - Canada (%)
Place of birth for the foreign-born population - Other Northern America (%)
Place of birth for the foreign-born population - Other (%)
Latest news about races in Spring, TX collected exclusively by city-data.com from local newspapers, TV, and radio stations
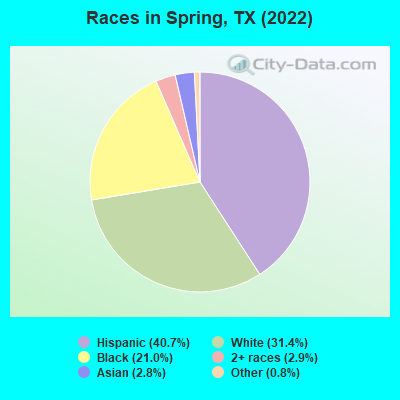
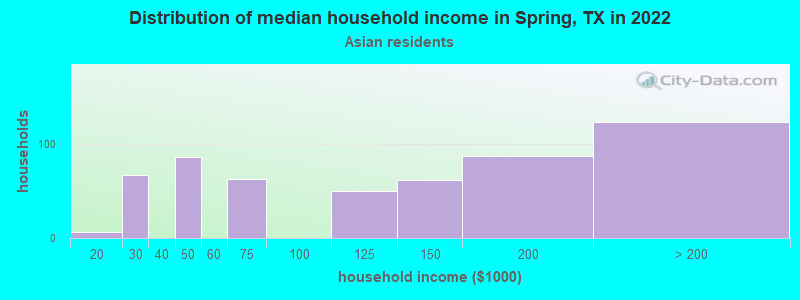
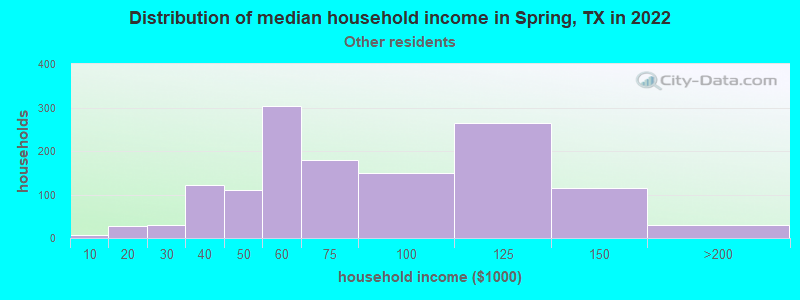
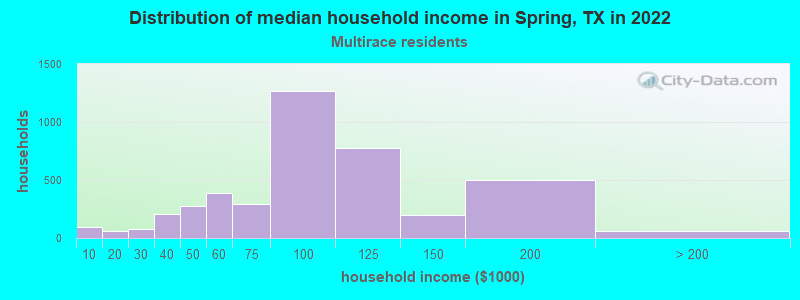
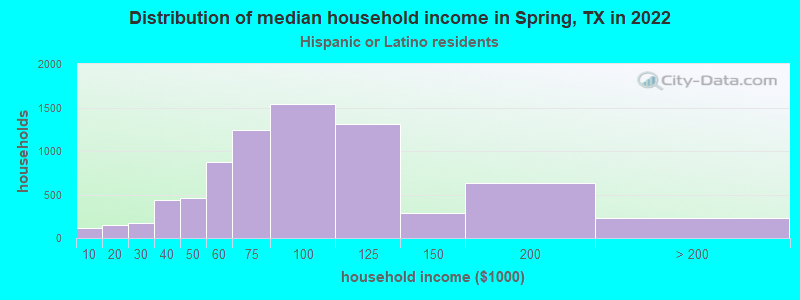
According to 2022 data, the most numerous races in Spring, TX are Hispanic (26,296 residents), White alone (20,324 residents), and Black alone (13,588 residents). 63.1% of Spring residents speak English at home. 16.3% of Spring, TX residents are foreign-born (12.6% born in Latin America, 1.8% born in Asia), which is 4.5% less than the foreign-born rate of 17.0% across the entire state of Texas.
Race distribution in Spring
2000 2022
10,933,313 52.4% White alone 6,669,666 32.0% Hispanic 2,364,255 11.3% Black alone 554,445 2.7% Asian alone 230,567 1.1% Two or more races 68,859 0.3% American Indian alone 19,958 0.10% Other race alone 10,757 0.05% Native Hawaiian and Other
12,070,642 40.2% Hispanic 11,683,430 38.9% White alone 3,508,706 11.7% Black alone 1,608,173 5.4% Asian alone 956,560 3.2% Two or more races 125,763 0.4% Other race alone 47,023 0.2% American Indian alone 29,275 0.10% Native Hawaiian and Other
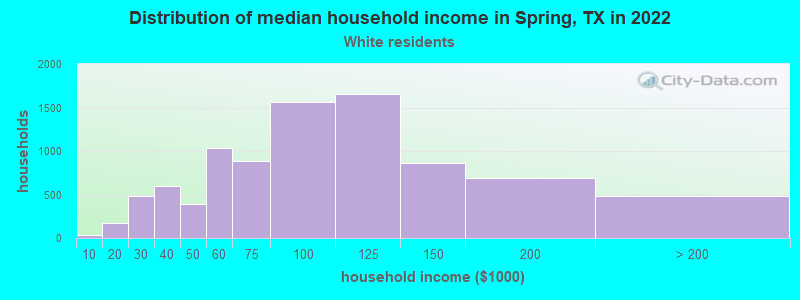
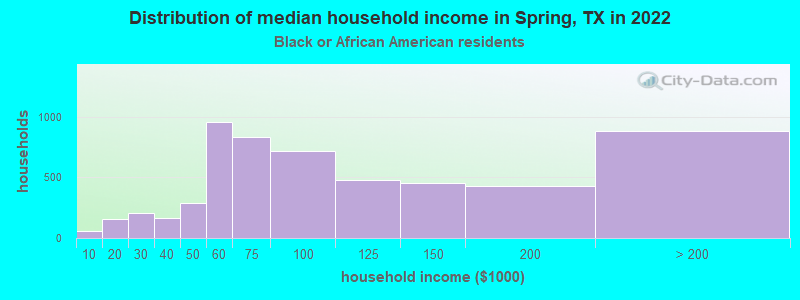
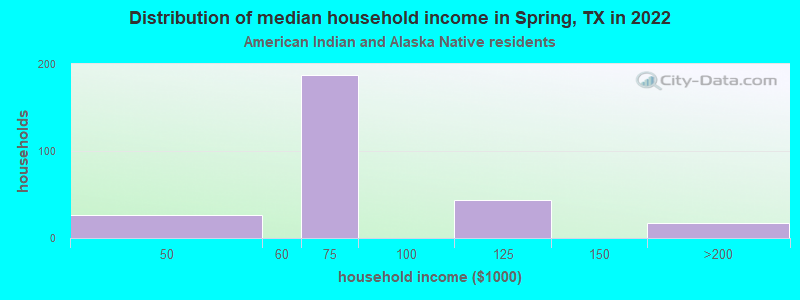
Income and house value in Spring Median household income in 2022 $95,910 White non-Hispanic householders$74,509 Black householders$151,968 Asian householders$80,115 Some other race householders$81,413 Two or more races householders$80,663 Hispanic or Latino race householdersMedian 2022 house value $226,029 White Non-Hispanic householders$214,516 Black or African American householders$201,184 American Indian or Alaska Native householders $191,792 Asian householders$37,873 Native Hawaiian and other Pacific Islander householders$206,032 Some other race householders$200,275 Two or more races householders$210,880 Hispanic or Latino householders
Median age by race in Spring
32.3 Median age for White residents29.6 34.8 35.8 Median age for Black or African American residents38.1 33.8 28.1 Median age for American Indian / Alaska Native residents-666,666,666.0 -666,666,666.0 39.9 Median age for Asian residents49.9 37.2 -666,666,666.0 Median age for Native Hawaiian / Pacific Islander residents-666,666,666.0 -666,666,666.0 43.4 Median age for Other race residents28.9 45.9 27.5 Median age for Two or more races residents27.1 28.4 40.4 Median age for White alone residents37.5 42.4 28.6 Median age for Hispanic or Latino residents27.7 31.7
Owner/renter occupied households by race in Spring
House owners and renters - White residents 7,399 83.4% Owner occupied1,470 16.6% Renter occupiedHouse owners and renters - Black or African American residents 5,327 66.2% Owner occupied2,719 33.8% Renter occupiedHouse owners and renters - American Indian / Alaska Native residents 291 100.0% Owner occupiedHouse owners and renters - Asian residents 466 83.5% Owner occupied92 16.5% Renter occupiedHouse owners and renters - Native Hawaiian / Pacific Islander residents 97 100.0% Owner occupiedHouse owners and renters - Other race residents 1,665 89.6% Owner occupied194 10.4% Renter occupiedHouse owners and renters - Two or more races residents 3,356 82.3% Owner occupied723 17.7% Renter occupiedHouse owners and renters - White alone residents 5,010 82.0% Owner occupied1,102 18.0% Renter occupiedHouse owners and renters - Hispanic or Latino residents 7,888 86.4% Owner occupied1,239 13.6% Renter occupied
Language usage in Spring
English speakers - Total 63.1% of residents of Spring speak English at home.
30.2% of residents speak Spanish at home 14,471 71.7% Speak English very well5,710 28.3% Speak English less than very well6.7% of residents speak other language at home 3,498 78.1% Speak English very well979 21.9% Speak English less than very well
English speakers - Born in the United States 81.3% of residents of Spring speak English at home.
16.9% of residents speak Spanish at home 2,165 76.1% Speak English very well680 23.9% Speak English less than very well1.8% of residents speak other language at home 304 100.0% Speak English very well
English speakers - Native, born elsewhere 62.0% of residents of Spring speak English at home.
36.4% of residents speak Spanish at home 772 90.0% Speak English very well86 10.0% Speak English less than very well1.6% of residents speak other language at home 37 100.0% Speak English very well
English speakers - Foreign-born 19.6% of residents of Spring speak English at home.
59.2% of residents speak Spanish at home 4,889 53.0% Speak English very well4,341 47.0% Speak English less than very well21.2% of residents speak other language at home 2,331 70.4% Speak English very well979 29.6% Speak English less than very well
White (Caucasian) - Speak only English Native:
78.4% (15,482)Foreign-born:
30.2% (965)
White (Caucasian) - Speak another language Native:
21.6% (4,255)Foreign-born:
69.8% (2,229)
Black or African American - Speak only English Native:
96.1% (12,321)Foreign-born:
48.1% (322)
Black or African American - Speak another language Native:
3.8% (490)Foreign-born:
48.7% (326)
American Indian / Alaska Native - Speak another language Native:
53.3% (70)Foreign-born:
98.9% (350)
Asian - Speak another language Native:
50.3% (442)Foreign-born:
100.0% (2,122)
Other race - Speak only English Native:
29.3% (1,126)Foreign-born:
5.5% (121)
Other race - Speak another language Native:
70.7% (2,714)Foreign-born:
94.5% (2,068)
Two or more races - Speak only English Native:
41.4% (3,330)Foreign-born:
13.5% (696)
Two or more races - Speak another language Native:
58.6% (4,707)Foreign-born:
86.5% (4,476)
White alone - Speak only English Native:
96.8% (17,707)Foreign-born:
30.2% (182)
White alone - Speak another language Native:
3.1% (566)Foreign-born:
69.5% (419)
Hispanic or Latino - Speak only English Native:
30.3% (4,740)Foreign-born:
12.5% (1,305)
Hispanic or Latino - Speak another language Native:
69.7% (10,899)Foreign-born:
87.5% (9,149)
Foreign-born residents in Spring 10,520 residents are foreign born (12.6% Latin America , 1.8% Asia ).
This city:
16.3%Texas:
17.1%
Marital status for residents in Spring Marital status - White (Caucasian) population 15 years and over
Males 38.9% Never married51.8% Now married0.0% Separated2.7% Widowed6.5% DivorcedFemales 22.1% Never married56.4% Now married0.5% Separated7.8% Widowed13.1% DivorcedWomen who gave birth in the past 12 months Now married:
100.0% (533)Unmarried:
0.0% (0)
Women who did not give birth in the past 12 months Now married:
52.7% (2,855)Unmarried:
47.3% (2,562)
Marital status - Black or African American population 15 years and over
Males 24.8% Never married64.6% Now married6.1% Separated0.0% Widowed4.5% DivorcedFemales 41.2% Never married44.5% Now married0.0% Separated1.6% Widowed12.7% DivorcedWomen who gave birth in the past 12 months Now married:
59.5% (50)Unmarried:
40.5% (34)
Women who did not give birth in the past 12 months Now married:
46.6% (1,707)Unmarried:
53.4% (1,956)
Marital status - American Indian / Alaska Native population 15 years and over
Males 13.4% Never married76.4% Now married0.0% Separated0.0% Widowed10.2% DivorcedFemales 10.6% Never married89.4% Now married0.0% Separated0.0% Widowed0.0% DivorcedWomen who did not give birth in the past 12 months Now married:
85.0% (156)Unmarried:
15.0% (28)
Marital status - Asian population 15 years and over
Males 40.5% Never married54.4% Now married0.0% Separated0.0% Widowed5.1% DivorcedFemales 38.0% Never married47.1% Now married0.0% Separated4.4% Widowed10.6% DivorcedWomen who gave birth in the past 12 months Now married:
100.0% (14)Unmarried:
0.0% (0)
Women who did not give birth in the past 12 months Now married:
40.5% (241)Unmarried:
59.5% (354)
Marital status - Other race population 15 years and over
Males 33.7% Never married58.8% Now married0.0% Separated0.0% Widowed7.5% DivorcedFemales 30.2% Never married37.9% Now married0.0% Separated10.9% Widowed21.0% DivorcedWomen who gave birth in the past 12 months Now married:
0.0% (0)Unmarried:
100.0% (62)
Women who did not give birth in the past 12 months Now married:
45.0% (580)Unmarried:
55.0% (709)
Marital status - Two or more races population 15 years and over
Males 41.3% Never married52.5% Now married1.5% Separated0.0% Widowed4.8% DivorcedFemales 22.5% Never married57.7% Now married1.7% Separated11.9% Widowed6.2% DivorcedWomen who gave birth in the past 12 months Now married:
79.8% (406)Unmarried:
20.2% (103)
Women who did not give birth in the past 12 months Now married:
19.5% (445)Unmarried:
80.5% (1,839)
Marital status - White alone, not Hispanic / Latino population 15 years and over
Males 40.2% Never married46.3% Now married0.0% Separated4.0% Widowed9.5% DivorcedFemales 23.5% Never married51.1% Now married0.0% Separated10.1% Widowed15.2% DivorcedWomen who gave birth in the past 12 months Now married:
100.0% (124)Unmarried:
0.0% (0)
Women who did not give birth in the past 12 months Now married:
47.4% (2,402)Unmarried:
52.6% (2,666)
Marital status - Hispanic or Latino population 15 years and over
Males 46.4% Never married48.6% Now married2.3% Separated0.0% Widowed2.7% DivorcedFemales 27.7% Never married51.9% Now married1.4% Separated5.9% Widowed13.1% DivorcedWomen who gave birth in the past 12 months Now married:
66.5% (696)Unmarried:
33.5% (350)
Women who did not give birth in the past 12 months Now married:
46.8% (2,536)Unmarried:
53.2% (2,881)
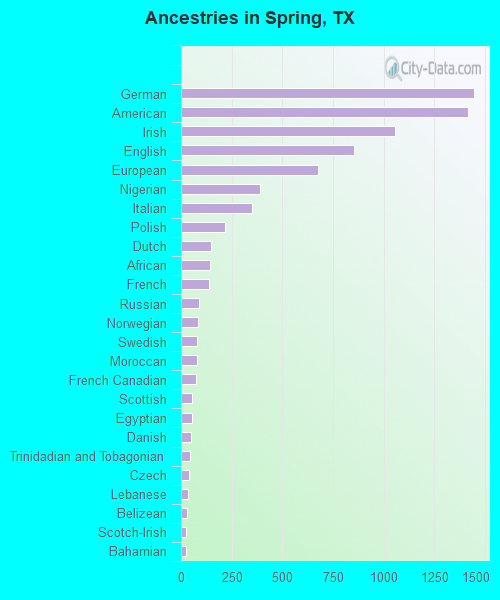
Ancestries in Spring
1,448 4.3% German1,417 4.2% American1,056 3.1% Irish855 2.5% English677 2.0% European391 1.2% Nigerian350 1.0% Italian217 0.6% Polish148 0.4% Dutch145 0.4% African138 0.4% French87 0.3% Russian83 0.2% Norwegian78 0.2% Swedish77 0.2% Moroccan72 0.2% French Canadian54 0.2% Scottish53 0.2% Egyptian48 0.1% Danish46 0.1% Trinidadian and Tobagonian39 0.1% Czech34 0.1% Lebanese30 0.09% Belizean25 0.07% Scotch-Irish24 0.07% Bahamian23 0.07% Palestinian22 0.06% Romanian22 0.06% British21 0.06% Jamaican19 0.06% Greek18 0.05% Slavic17 0.05% Iranian16 0.05% Assyrian12 0.04% Finnish11 0.03% Northern European9 0.03% Portuguese9 0.03% Brazilian2 0.01% Lithuanian
Geographical mobility in Spring Same house 1 year ago 21,908 91.4% White (Caucasian)11,871 85.7% Black or African American574 100.0% American Indian / Alaska Native1,654 91.0% Asian54 98.2% Native Hawaiian / Pacific Islander4,886 93.7% Other race13,744 82.4% Two or more races18,837 93.8% White alone, not Hispanic / Latino22,540 86.7% Hispanic or LatinoMoved within same county 1,229 5.1% White / Caucasian1,355 9.8% Black or African American20 1.1% Asian228 4.4% Other race2,079 12.5% Two or more races907 4.5% White alone, not Hispanic / Latino2,302 8.9% Hispanic or LatinoMoved within same state 178 0.7% White / Caucasian279 2.0% Black or African American39 2.1% Asian14 0.3% Other race400 2.4% Two or more races97 0.5% White alone, not Hispanic / Latino331 1.3% Hispanic or LatinoMoved from different state 773 3.2% White / Caucasian294 2.1% Black or African American93 5.1% Asian20 0.4% Other race63 0.4% Two or more races287 1.4% White alone, not Hispanic / Latino676 2.6% Hispanic or LatinoMoved from abroad 20 0.1% White33 0.2% Black or African American14 0.8% Asian229 1.4% Two or more races24 0.1% White alone, not Hispanic / Latino156 0.6% Hispanic or Latino
Children Nativity (place of birth) in Spring
Children under 6 years - Living with two parents Both parents native 2,876 100.0% NativeBoth parents foreign-born 1,377 100.0% NativeOne native, one foreign-born parent 801 100.0% NativeChildren under 6 years - Living with one parent Native parent 566 73.0% Native209 27.0% Foreign-bornForeign-born parent 757 100.0% NativeChildren 6 to 17 years - Living with two parents Both parents native 4,543 100.0% NativeBoth parents foreign-born 1,651 67.6% Native790 32.4% Foreign-bornOne native, one foreign-born parent 1,741 100.0% NativeChildren 6 to 17 years - Living with one parent Native parent 1,701 77.0% Native509 23.0% Foreign-bornForeign-born parent 969 80.8% Native230 19.2% Foreign-born
Grandparents responsible for own grandchildren in Spring
Grandparents (30 to 59 years) White / Caucasian 44 45.8% Responsible for grandchildren52 54.2% Not responsible for grandchildrenBlack or African American 90 41.8% Responsible for grandchildren125 58.2% Not responsible for grandchildrenOther race 90 100.0% Not responsible for grandchildrenTwo or more races 155 100.0% Not responsible for grandchildrenWhite alone, not Hispanic / Latino 46 35.7% Responsible for grandchildren83 64.3% Not responsible for grandchildrenHispanic or Latino 26 12.0% Responsible for grandchildren190 88.0% Not responsible for grandchildrenGrandparents (60 years and over) White / Caucasian 22 10.5% Responsible for grandchildren185 89.5% Not responsible for grandchildrenBlack or African American 40 73.7% Responsible for grandchildren14 26.3% Not responsible for grandchildrenOther race 51 33.6% Responsible for grandchildren101 66.4% Not responsible for grandchildrenTwo or more races 6 1.4% Responsible for grandchildren437 98.6% Not responsible for grandchildrenWhite alone, not Hispanic / Latino 30 12.9% Responsible for grandchildren201 87.1% Not responsible for grandchildrenHispanic or Latino 5 1.2% Responsible for grandchildren431 98.8% Not responsible for grandchildren