Races in St. Louis Park, Minnesota (MN) Detailed Stats
Data:
Races - White alone (%)
Races - White alone (% change since 2000)
Races - Black alone (%)
Races - Black alone (% change since 2000)
Races - American Indian alone (%)
Races - American Indian alone (% change since 2000)
Races - Asian alone (%)
Races - Asian alone (% change since 2000)
Races - Hispanic (%)
Races - Hispanic (% change since 2000)
Races - Native Hawaiian and Other Pacific Islander alone (%)
Races - Native Hawaiian and Other Pacific Islander alone (% change since 2000)
Races - Two or more races(%)
Races - Two or more races(% change since 2000)
Races - Other race alone (%)
Races - Other race alone (% change since 2000)
Racial diversity
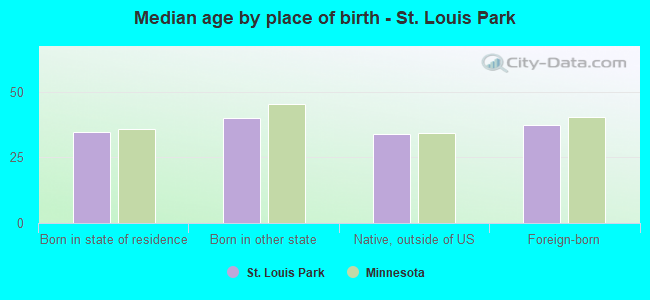
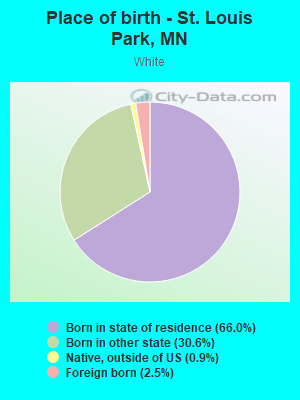
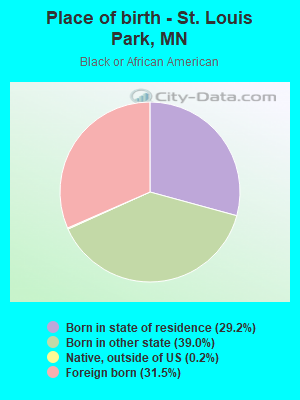
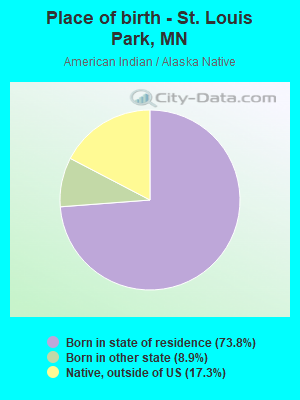
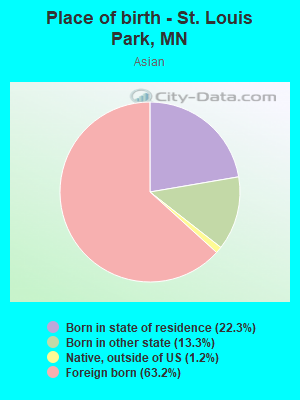
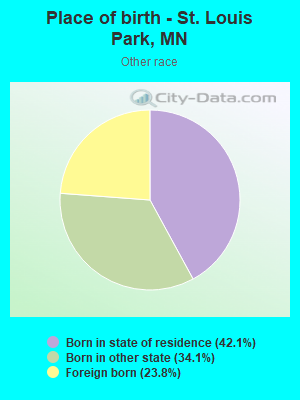
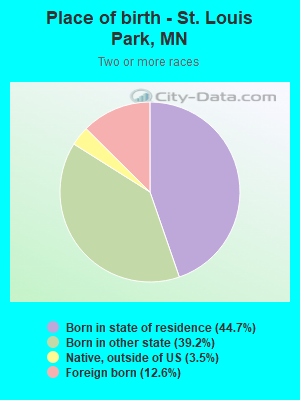
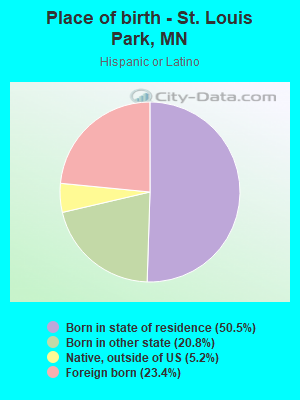
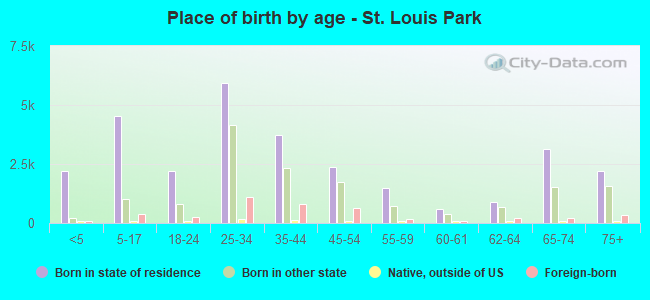
Place of birth - Born in state of residence (%)
Place of birth - Born in state of residence (%) - White
Place of birth - Born in state of residence (%) - Black or African American
Place of birth - Born in state of residence (%) - Asian
Place of birth - Born in state of residence (%) - Hispanic or Latino
Place of birth - Born in state of residence (%) - American Indian and Alaska Native
Place of birth - Born in state of residence (%) - Multirace
Place of birth - Born in state of residence (%) - Other Race
Place of birth - Born in other state (%)
Place of birth - Born in other state (%) - White
Place of birth - Born in other state (%) - Black or African American
Place of birth - Born in other state (%) - Asian
Place of birth - Born in other state (%) - Hispanic or Latino
Place of birth - Born in other state (%) - American Indian and Alaska Native
Place of birth - Born in other state (%) - Multirace
Place of birth - Born in other state (%) - Other Race
Place of birth - Native, outside of US (%)
Place of birth - Native, outside of US (%) - White
Place of birth - Native, outside of US (%) - Black or African American
Place of birth - Native, outside of US (%) - Asian
Place of birth - Native, outside of US (%) - Hispanic or Latino
Place of birth - Native, outside of US (%) - American Indian and Alaska Native
Place of birth - Native, outside of US (%) - Multirace
Place of birth - Native, outside of US (%) - Other Race
Place of birth - Foreign born (%)
Place of birth - Foreign born (%) - White
Place of birth - Foreign born (%) - Black or African American
Place of birth - Foreign born (%) - Asian
Place of birth - Foreign born (%) - Hispanic or Latino
Place of birth - Foreign born (%) - American Indian and Alaska Native
Place of birth - Foreign born (%) - Multirace
Place of birth - Foreign born (%) - Other Race
Residents speaking English at home (%)
Residents speaking English at home - Born in the United States (%)
Residents speaking English at home - Native, born elsewhere (%)
Residents speaking English at home - Foreign born (%)
Residents speaking Spanish at home (%)
Residents speaking Spanish at home - Born in the United States (%)
Residents speaking Spanish at home - Native, born elsewhere (%)
Residents speaking Spanish at home - Foreign born (%)
Residents speaking other language at home (%)
Residents speaking other language at home - Born in the United States (%)
Residents speaking other language at home - Native, born elsewhere (%)
Residents speaking other language at home - Foreign born (%)
Marital status - Never married (%)
Marital status - Now married (%)
Marital status - Separated (%)
Marital status - Widowed (%)
Marital status - Divorced (%)
Ancestries Reported - Arab (%)
Ancestries Reported - Czech (%)
Ancestries Reported - Danish (%)
Ancestries Reported - Dutch (%)
Ancestries Reported - English (%)
Ancestries Reported - French (%)
Ancestries Reported - French Canadian (%)
Ancestries Reported - German (%)
Ancestries Reported - Greek (%)
Ancestries Reported - Hungarian (%)
Ancestries Reported - Irish (%)
Ancestries Reported - Italian (%)
Ancestries Reported - Lithuanian (%)
Ancestries Reported - Norwegian (%)
Ancestries Reported - Polish (%)
Ancestries Reported - Portuguese (%)
Ancestries Reported - Russian (%)
Ancestries Reported - Scotch-Irish (%)
Ancestries Reported - Scottish (%)
Ancestries Reported - Slovak (%)
Ancestries Reported - Subsaharan African (%)
Ancestries Reported - Swedish (%)
Ancestries Reported - Swiss (%)
Ancestries Reported - Ukrainian (%)
Ancestries Reported - United States (%)
Ancestries Reported - Welsh (%)
Ancestries Reported - West Indian (%)
Ancestries Reported - Other (%)
Geographical mobility - Same house 1 year ago (%)
Geographical mobility - Same house 1 year ago (%) - White
Geographical mobility - Same house 1 year ago (%) - Black or African American
Geographical mobility - Same house 1 year ago (%) - Asian
Geographical mobility - Same house 1 year ago (%) - Hispanic or Latino
Geographical mobility - Same house 1 year ago (%) - American Indian and Alaska Native
Geographical mobility - Same house 1 year ago (%) - Multirace
Geographical mobility - Same house 1 year ago (%) - Other Race
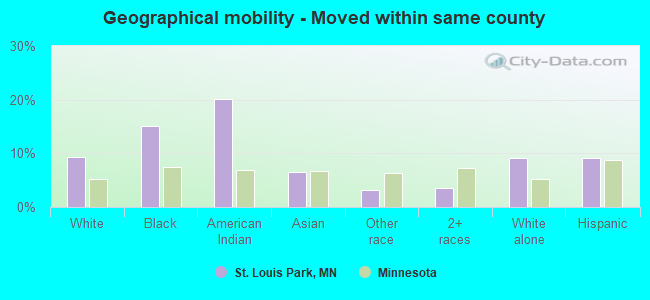
Geographical mobility - Moved within same county (%)
Geographical mobility - Moved within same county (%) - White
Geographical mobility - Moved within same county (%) - Black or African American
Geographical mobility - Moved within same county (%) - Asian
Geographical mobility - Moved within same county (%) - Hispanic or Latino
Geographical mobility - Moved within same county (%) - American Indian and Alaska Native
Geographical mobility - Moved within same county (%) - Multirace
Geographical mobility - Moved within same county (%) - Other Race
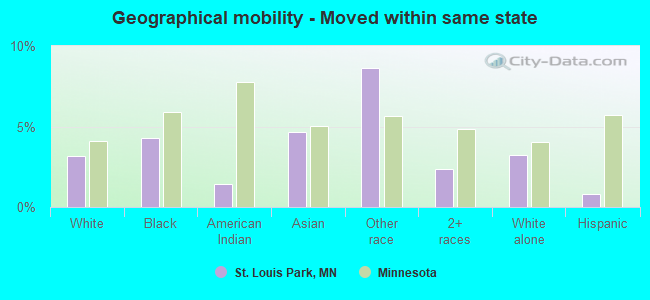
Geographical mobility - Moved from different county within same state (%)
Geographical mobility - Moved from different county within same state (%) - White
Geographical mobility - Moved from different county within same state (%) - Black or African American
Geographical mobility - Moved from different county within same state (%) - Asian
Geographical mobility - Moved from different county within same state (%) - Hispanic or Latino
Geographical mobility - Moved from different county within same state (%) - American Indian and Alaska Native
Geographical mobility - Moved from different county within same state (%) - Multirace
Geographical mobility - Moved from different county within same state (%) - Other Race
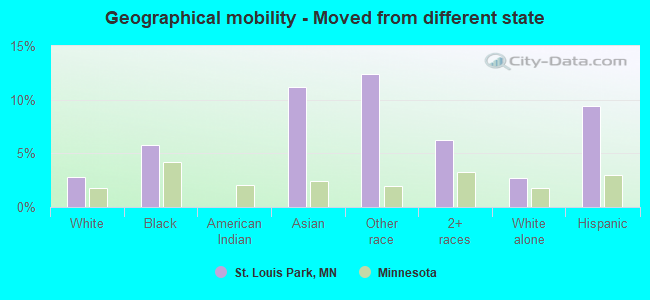
Geographical mobility - Moved from different state (%)
Geographical mobility - Moved from different state (%) - White
Geographical mobility - Moved from different state (%) - Black or African American
Geographical mobility - Moved from different state (%) - Asian
Geographical mobility - Moved from different state (%) - Hispanic or Latino
Geographical mobility - Moved from different state (%) - American Indian and Alaska Native
Geographical mobility - Moved from different state (%) - Multirace
Geographical mobility - Moved from different state (%) - Other Race
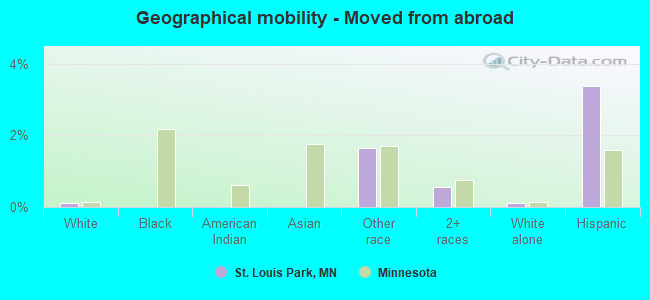
Geographical mobility - Moved from abroad (%)
Geographical mobility - Moved from abroad (%) - White
Geographical mobility - Moved from abroad (%) - Black or African American
Geographical mobility - Moved from abroad (%) - Asian
Geographical mobility - Moved from abroad (%) - Hispanic or Latino
Geographical mobility - Moved from abroad (%) - American Indian and Alaska Native
Geographical mobility - Moved from abroad (%) - Multirace
Geographical mobility - Moved from abroad (%) - Other Race
Place of birth for the foreign-born population - Ireland (%)
Place of birth for the foreign-born population - Denmark (%)
Place of birth for the foreign-born population - Norway (%)
Place of birth for the foreign-born population - Sweden (%)
Place of birth for the foreign-born population - United Kingdom (%)
Place of birth for the foreign-born population - England (%)
Place of birth for the foreign-born population - Scotland (%)
Place of birth for the foreign-born population - Other Northern Europe (%)
Place of birth for the foreign-born population - Austria (%)
Place of birth for the foreign-born population - Belgium (%)
Place of birth for the foreign-born population - France (%)
Place of birth for the foreign-born population - Germany (%)
Place of birth for the foreign-born population - Netherlands (%)
Place of birth for the foreign-born population - Switzerland (%)
Place of birth for the foreign-born population - Other Western Europe (%)
Place of birth for the foreign-born population - Greece (%)
Place of birth for the foreign-born population - Italy (%)
Place of birth for the foreign-born population - Portugal (%)
Place of birth for the foreign-born population - Spain (%)
Place of birth for the foreign-born population - Other Southern Europe (%)
Place of birth for the foreign-born population - Albania (%)
Place of birth for the foreign-born population - Belarus (%)
Place of birth for the foreign-born population - Bosnia and Herzegovina (%)
Place of birth for the foreign-born population - Bulgaria (%)
Place of birth for the foreign-born population - Croatia (%)
Place of birth for the foreign-born population - Czechoslovakia (%)
Place of birth for the foreign-born population - Hungary (%)
Place of birth for the foreign-born population - Latvia (%)
Place of birth for the foreign-born population - Lithuania (%)
Place of birth for the foreign-born population - North Macedonia (Macedonia) (%)
Place of birth for the foreign-born population - Moldova (%)
Place of birth for the foreign-born population - Poland (%)
Place of birth for the foreign-born population - Romania (%)
Place of birth for the foreign-born population - Russia (%)
Place of birth for the foreign-born population - Serbia (%)
Place of birth for the foreign-born population - Ukraine (%)
Place of birth for the foreign-born population - Other Eastern Europe (%)
Place of birth for the foreign-born population - China (%)
Place of birth for the foreign-born population - Hong Kong (%)
Place of birth for the foreign-born population - Taiwan (%)
Place of birth for the foreign-born population - Japan (%)
Place of birth for the foreign-born population - Korea (%)
Place of birth for the foreign-born population - Other Eastern Asia (%)
Place of birth for the foreign-born population - Afghanistan (%)
Place of birth for the foreign-born population - Bangladesh (%)
Place of birth for the foreign-born population - India (%)
Place of birth for the foreign-born population - Iran (%)
Place of birth for the foreign-born population - Kazakhstan (%)
Place of birth for the foreign-born population - Nepal (%)
Place of birth for the foreign-born population - Pakistan (%)
Place of birth for the foreign-born population - Sri Lanka (%)
Place of birth for the foreign-born population - Uzbekistan (%)
Place of birth for the foreign-born population - Other South Central Asia (%)
Place of birth for the foreign-born population - Burma (%)
Place of birth for the foreign-born population - Cambodia (%)
Place of birth for the foreign-born population - Indonesia (%)
Place of birth for the foreign-born population - Laos (%)
Place of birth for the foreign-born population - Malaysia (%)
Place of birth for the foreign-born population - Philippines (%)
Place of birth for the foreign-born population - Singapore (%)
Place of birth for the foreign-born population - Thailand (%)
Place of birth for the foreign-born population - Vietnam (%)
Place of birth for the foreign-born population - Other South Eastern Asia (%)
Place of birth for the foreign-born population - Armenia (%)
Place of birth for the foreign-born population - Iraq (%)
Place of birth for the foreign-born population - Israel (%)
Place of birth for the foreign-born population - Jordan (%)
Place of birth for the foreign-born population - Kuwait (%)
Place of birth for the foreign-born population - Lebanon (%)
Place of birth for the foreign-born population - Saudi Arabia (%)
Place of birth for the foreign-born population - Syria (%)
Place of birth for the foreign-born population - Turkey (%)
Place of birth for the foreign-born population - Yemen (%)
Place of birth for the foreign-born population - Other Western Asia (%)
Place of birth for the foreign-born population - Eritrea (%)
Place of birth for the foreign-born population - Ethiopia (%)
Place of birth for the foreign-born population - Kenya (%)
Place of birth for the foreign-born population - Somalia (%)
Place of birth for the foreign-born population - Uganda (%)
Place of birth for the foreign-born population - Zimbabwe (%)
Place of birth for the foreign-born population - Other Eastern Africa (%)
Place of birth for the foreign-born population - Cameroon (%)
Place of birth for the foreign-born population - Congo (%)
Place of birth for the foreign-born population - Democratic Republic of Congo (Zaire) (%)
Place of birth for the foreign-born population - Other Middle Africa (%)
Place of birth for the foreign-born population - Egypt (%)
Place of birth for the foreign-born population - Morocco (%)
Place of birth for the foreign-born population - Sudan (%)
Place of birth for the foreign-born population - Other Northern Africa (%)
Place of birth for the foreign-born population - South Africa (%)
Place of birth for the foreign-born population - Other Southern Africa (%)
Place of birth for the foreign-born population - Cabo Verde (%)
Place of birth for the foreign-born population - Ghana (%)
Place of birth for the foreign-born population - Liberia (%)
Place of birth for the foreign-born population - Nigeria (%)
Place of birth for the foreign-born population - Senegal (%)
Place of birth for the foreign-born population - Sierra Leone (%)
Place of birth for the foreign-born population - Other Western Africa (%)
Place of birth for the foreign-born population - Australia (%)
Place of birth for the foreign-born population - New Zealand (%)
Place of birth for the foreign-born population - Fiji (%)
Place of birth for the foreign-born population - Micronesia (%)
Place of birth for the foreign-born population - Bahamas (%)
Place of birth for the foreign-born population - Barbados (%)
Place of birth for the foreign-born population - Cuba (%)
Place of birth for the foreign-born population - Dominica (%)
Place of birth for the foreign-born population - Dominican Republic (%)
Place of birth for the foreign-born population - Grenada (%)
Place of birth for the foreign-born population - Haiti (%)
Place of birth for the foreign-born population - Jamaica (%)
Place of birth for the foreign-born population - St. Vincent and the Grenadines (%)
Place of birth for the foreign-born population - Trinidad and Tobago (%)
Place of birth for the foreign-born population - West Indies (%)
Place of birth for the foreign-born population - Other Caribbean (%)
Place of birth for the foreign-born population - Belize (%)
Place of birth for the foreign-born population - Costa Rica (%)
Place of birth for the foreign-born population - El Salvador (%)
Place of birth for the foreign-born population - Guatemala (%)
Place of birth for the foreign-born population - Honduras (%)
Place of birth for the foreign-born population - Mexico (%)
Place of birth for the foreign-born population - Nicaragua (%)
Place of birth for the foreign-born population - Panama (%)
Place of birth for the foreign-born population - Other Central America (%)
Place of birth for the foreign-born population - Argentina (%)
Place of birth for the foreign-born population - Bolivia (%)
Place of birth for the foreign-born population - Brazil (%)
Place of birth for the foreign-born population - Chile (%)
Place of birth for the foreign-born population - Colombia (%)
Place of birth for the foreign-born population - Ecuador (%)
Place of birth for the foreign-born population - Guyana (%)
Place of birth for the foreign-born population - Peru (%)
Place of birth for the foreign-born population - Uruguay (%)
Place of birth for the foreign-born population - Venezuela (%)
Place of birth for the foreign-born population - Other South America (%)
Place of birth for the foreign-born population - Canada (%)
Place of birth for the foreign-born population - Other Northern America (%)
Place of birth for the foreign-born population - Other (%)
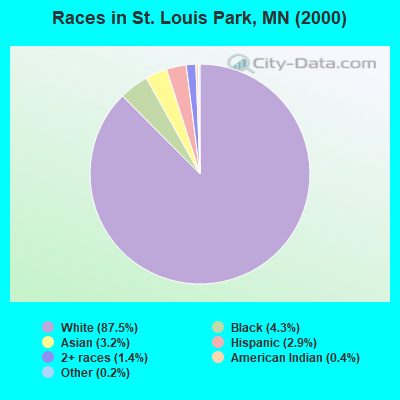
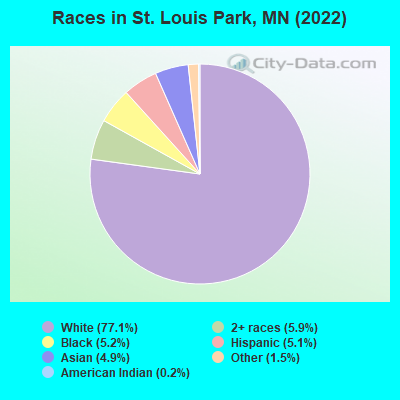
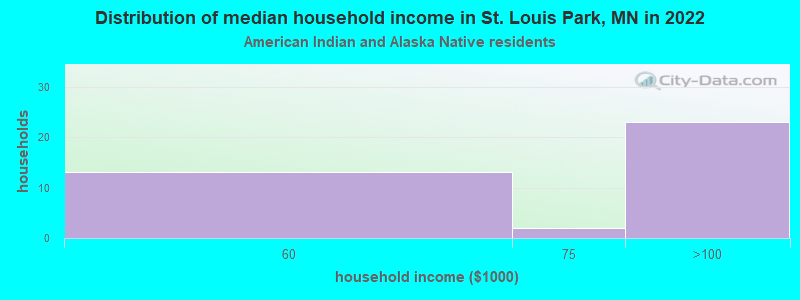
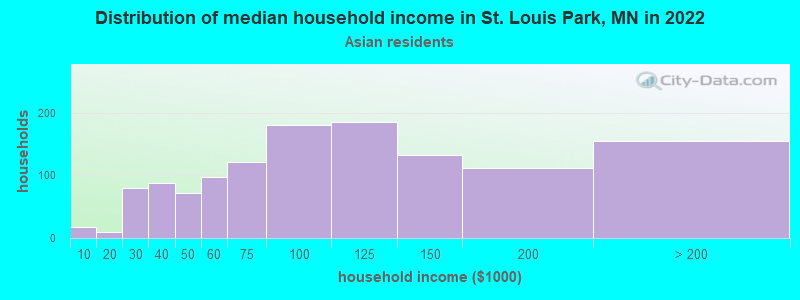
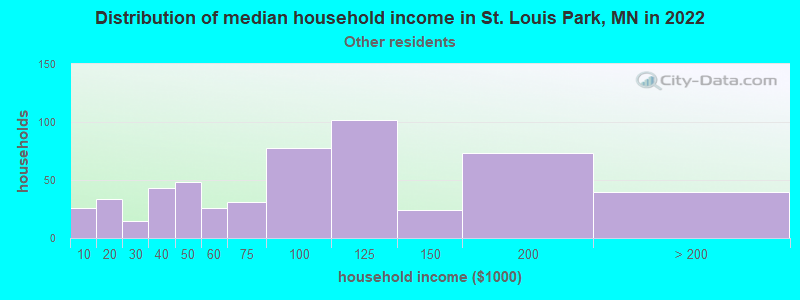
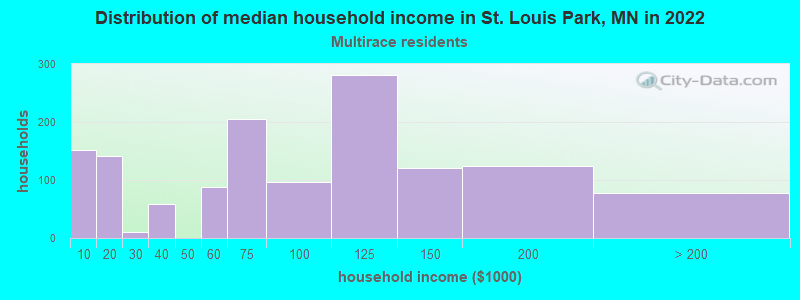
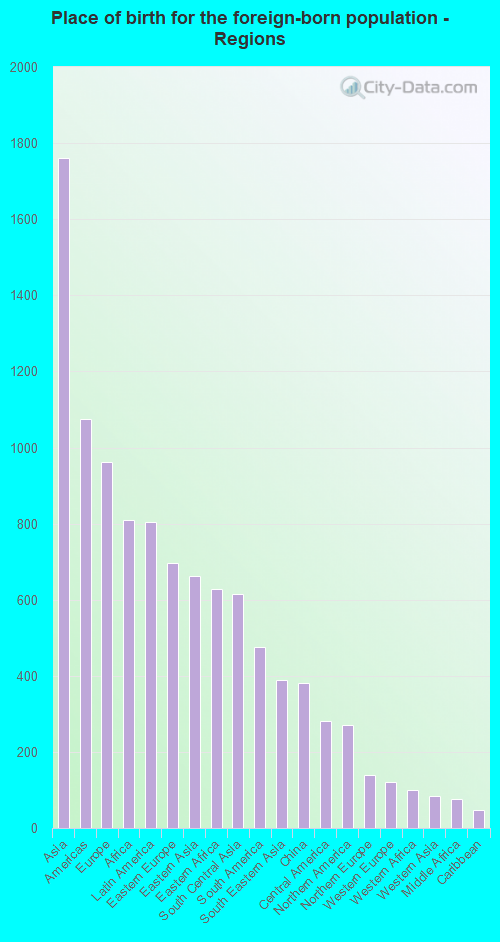
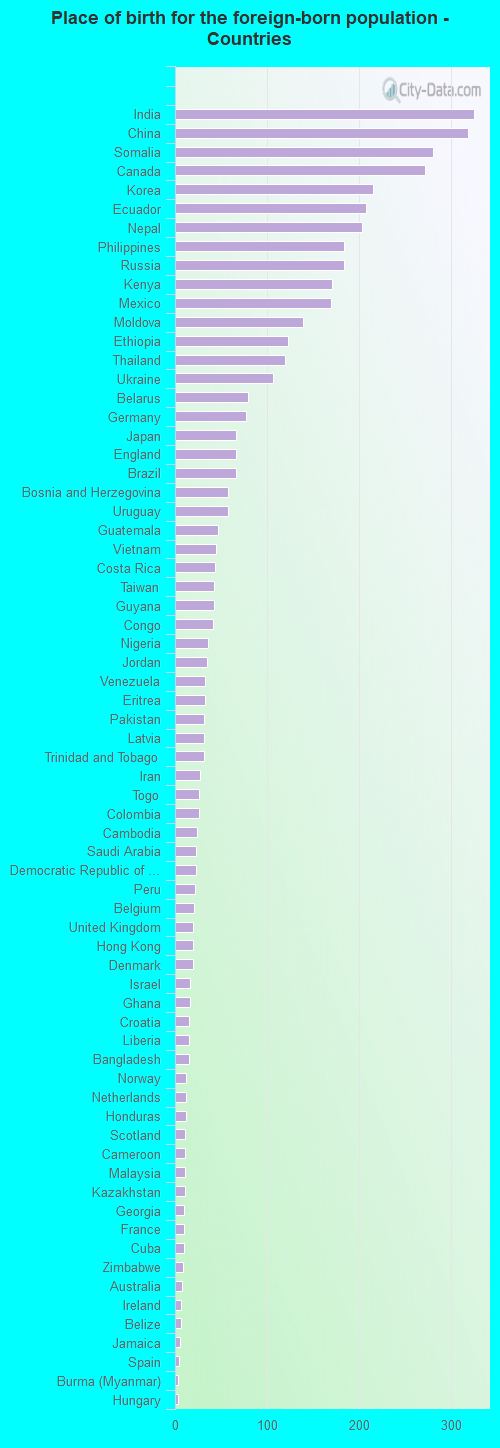
According to 2022 data, the most numerous races in St. Louis Park, MN are White alone (37,868 residents), Black alone (2,543 residents), and Hispanic (2,482 residents). 88.0% of St. Louis Park residents speak English at home. 9.4% of St. Louis Park, MN residents are foreign-born (3.4% born in Asia, 1.9% born in Europe, 1.6% born in Africa, 1.6% born in Latin America), which is 15.0% greater than the foreign-born rate of 8.0% across the entire state of Minnesota.
Race distribution in St. Louis Park
2000 2022
4,337,143 88.2% White alone 168,813 3.4% Black alone 143,382 2.9% Hispanic 141,083 2.9% Asian alone 70,304 1.4% Two or more races 52,009 1.1% American Indian alone 5,031 0.1% Other race alone 1,714 0.03% Native Hawaiian and Other
4,356,347 76.2% White alone 395,179 6.9% Black alone 333,830 5.8% Hispanic 294,800 5.2% Asian alone 259,649 4.5% Two or more races 42,125 0.7% American Indian alone 32,976 0.6% Other race alone 2,278 0.04% Native Hawaiian and Other
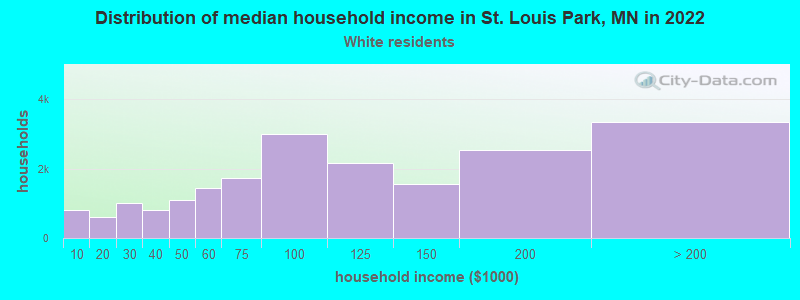
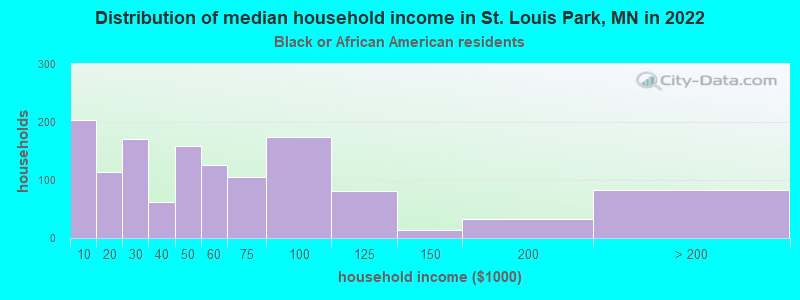
Income and house value in St. Louis Park Median household income in 2022 $94,158 White non-Hispanic householders$47,691 Black householders$97,558 American Indian and Alaska Native householders$95,680 Asian householders$86,614 Some other race householders$78,173 Two or more races householders$75,607 Hispanic or Latino race householdersMedian 2022 house value $388,427 White Non-Hispanic householders$362,132 Black or African American householders$271,527 American Indian or Alaska Native householders $375,851 Asian householders$441,589 Some other race householders$427,012 Two or more races householders$368,134 Hispanic or Latino householders
Median age by race in St. Louis Park
39.3 Median age for White residents37.9 40.4 30.3 Median age for Black or African American residents30.3 29.9 26.5 Median age for American Indian / Alaska Native residents23.6 28.2 35.8 Median age for Asian residents35.2 37.8 -790,303,029.5 Median age for Native Hawaiian / Pacific Islander residents-856,799,036.4 -365,948,037.2 33.5 Median age for Other race residents40.3 31.4 19.9 Median age for Two or more races residents22.1 19.4 39.2 Median age for White alone residents38.0 40.2 27.8 Median age for Hispanic or Latino residents27.2 28.2
Owner/renter occupied households by race in St. Louis Park
House owners and renters - White residents 12,897 64.4% Owner occupied7,138 35.6% Renter occupiedHouse owners and renters - Black or African American residents 125 9.5% Owner occupied1,200 90.5% Renter occupiedHouse owners and renters - American Indian / Alaska Native residents 25 56.8% Owner occupied19 43.2% Renter occupiedHouse owners and renters - Asian residents 444 34.7% Owner occupied834 65.3% Renter occupiedHouse owners and renters - Other race residents 201 36.1% Owner occupied355 63.9% Renter occupiedHouse owners and renters - Two or more races residents 613 44.7% Owner occupied758 55.3% Renter occupiedHouse owners and renters - White alone residents 12,851 64.6% Owner occupied7,049 35.4% Renter occupiedHouse owners and renters - Hispanic or Latino residents 269 31.9% Owner occupied575 68.1% Renter occupied
Language usage in St. Louis Park
English speakers - Total 88.0% of residents of St. Louis Park speak English at home.
3.0% of residents speak Spanish at home 831 59.1% Speak English very well575 40.9% Speak English less than very well9.0% of residents speak other language at home 2,454 58.7% Speak English very well1,724 41.3% Speak English less than very well
English speakers - Born in the United States 94.6% of residents of St. Louis Park speak English at home.
2.0% of residents speak Spanish at home 238 81.5% Speak English very well54 18.5% Speak English less than very well3.1% of residents speak other language at home 388 84.3% Speak English very well72 15.7% Speak English less than very well
English speakers - Native, born elsewhere 65.9% of residents of St. Louis Park speak English at home.
7.8% of residents speak Spanish at home 39 100.0% Speak English very well21.0% of residents speak other language at home 88 83.8% Speak English very well17 16.2% Speak English less than very well
English speakers - Foreign-born 25.0% of residents of St. Louis Park speak English at home.
10.9% of residents speak Spanish at home 247 53.5% Speak English very well215 46.5% Speak English less than very well64.2% of residents speak other language at home 1,492 54.8% Speak English very well1,233 45.2% Speak English less than very well
White (Caucasian) - Speak only English Native:
98.1% (34,832)Foreign-born:
37.1% (361)
White (Caucasian) - Speak another language Native:
2.0% (719)Foreign-born:
61.1% (594)
Black or African American - Speak only English Native:
85.7% (1,395)Foreign-born:
17.3% (130)
Black or African American - Speak another language Native:
12.6% (205)Foreign-born:
83.8% (631)
Asian - Speak only English Native:
42.0% (368)Foreign-born:
25.4% (389)
Asian - Speak another language Native:
57.7% (505)Foreign-born:
74.9% (1,147)
Other race - Speak only English Native:
75.8% (884)Foreign-born:
36.5% (130)
Other race - Speak another language Native:
30.2% (352)Foreign-born:
62.1% (221)
Two or more races - Speak only English Native:
81.1% (2,455)Foreign-born:
25.9% (123)
Two or more races - Speak another language Native:
17.8% (539)Foreign-born:
74.8% (356)
White alone - Speak only English Native:
98.0% (34,408)Foreign-born:
35.9% (362)
White alone - Speak another language Native:
2.0% (711)Foreign-born:
61.9% (625)
Hispanic or Latino - Speak only English Native:
64.9% (1,157)Foreign-born:
25.2% (149)
Hispanic or Latino - Speak another language Native:
36.9% (657)Foreign-born:
78.3% (462)
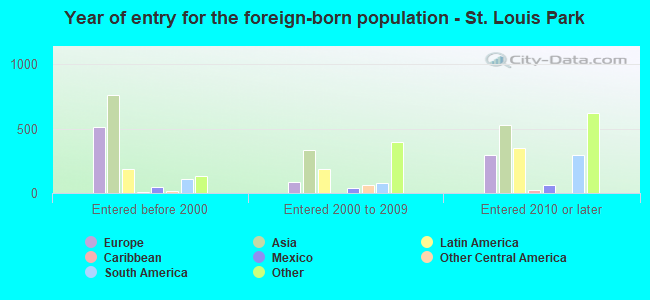
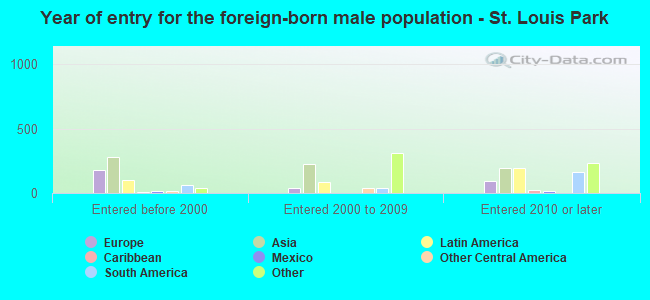
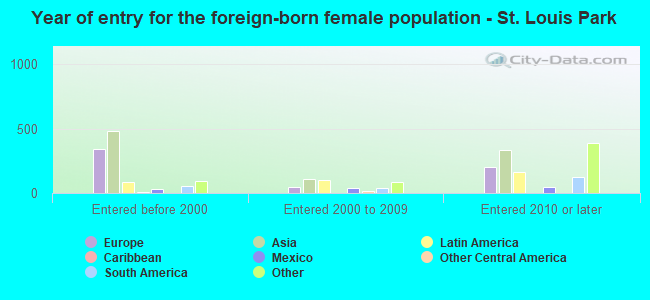
Foreign-born residents in St. Louis Park 4,618 residents are foreign born (3.4% Asia , 1.9% Europe , 1.6% Africa , 1.6% Latin America ).
This city:
9.4%Minnesota:
8.5%
Marital status for residents in St. Louis Park Marital status - White (Caucasian) population 15 years and over
Males 40.6% Never married49.5% Now married0.6% Separated1.6% Widowed7.7% DivorcedFemales 36.8% Never married41.7% Now married0.7% Separated9.1% Widowed11.7% DivorcedWomen who gave birth in the past 12 months Now married:
92.9% (537)Unmarried:
7.1% (41)
Women who did not give birth in the past 12 months Now married:
37.3% (3,479)Unmarried:
62.7% (5,838)
Marital status - Black or African American population 15 years and over
Males 55.5% Never married38.9% Now married2.6% Separated0.0% Widowed2.9% DivorcedFemales 55.6% Never married24.6% Now married5.7% Separated2.1% Widowed12.0% DivorcedWomen who gave birth in the past 12 months Now married:
58.4% (58)Unmarried:
41.6% (41)
Women who did not give birth in the past 12 months Now married:
25.2% (172)Unmarried:
74.8% (510)
Marital status - American Indian / Alaska Native population 15 years and over
Males 78.0% Never married22.0% Now married0.0% Separated0.0% Widowed0.0% DivorcedFemales 51.2% Never married31.7% Now married0.0% Separated0.0% Widowed17.1% DivorcedWomen who did not give birth in the past 12 months Now married:
38.2% (14)Unmarried:
61.8% (22)
Marital status - Asian population 15 years and over
Males 61.6% Never married35.2% Now married0.5% Separated0.0% Widowed2.7% DivorcedFemales 34.9% Never married61.1% Now married0.0% Separated3.4% Widowed0.7% DivorcedWomen who gave birth in the past 12 months Now married:
100.0% (25)Unmarried:
0.0% (0)
Women who did not give birth in the past 12 months Now married:
49.2% (425)Unmarried:
50.8% (438)
Marital status - Other race population 15 years and over
Males 69.7% Never married25.6% Now married0.0% Separated0.0% Widowed4.7% DivorcedFemales 44.6% Never married44.0% Now married0.0% Separated0.7% Widowed10.6% DivorcedWomen who gave birth in the past 12 months Now married:
100.0% (5)Unmarried:
0.0% (0)
Women who did not give birth in the past 12 months Now married:
38.6% (169)Unmarried:
61.4% (269)
Marital status - Two or more races population 15 years and over
Males 63.0% Never married25.6% Now married0.5% Separated0.0% Widowed10.9% DivorcedFemales 56.5% Never married23.4% Now married2.0% Separated17.3% Widowed0.8% DivorcedWomen who gave birth in the past 12 months Now married:
100.0% (46)Unmarried:
0.0% (0)
Women who did not give birth in the past 12 months Now married:
21.7% (196)Unmarried:
78.3% (708)
Marital status - White alone, not Hispanic / Latino population 15 years and over
Males 40.4% Never married49.8% Now married0.6% Separated1.6% Widowed7.7% DivorcedFemales 36.7% Never married41.7% Now married0.7% Separated9.2% Widowed11.7% DivorcedWomen who gave birth in the past 12 months Now married:
92.8% (540)Unmarried:
7.2% (42)
Women who did not give birth in the past 12 months Now married:
37.3% (3,473)Unmarried:
62.7% (5,841)
Marital status - Hispanic or Latino population 15 years and over
Males 68.1% Never married26.8% Now married0.0% Separated0.0% Widowed5.1% DivorcedFemales 52.7% Never married41.7% Now married0.0% Separated1.2% Widowed4.3% DivorcedWomen who gave birth in the past 12 months Now married:
100.0% (12)Unmarried:
0.0% (0)
Women who did not give birth in the past 12 months Now married:
38.4% (270)Unmarried:
61.6% (432)
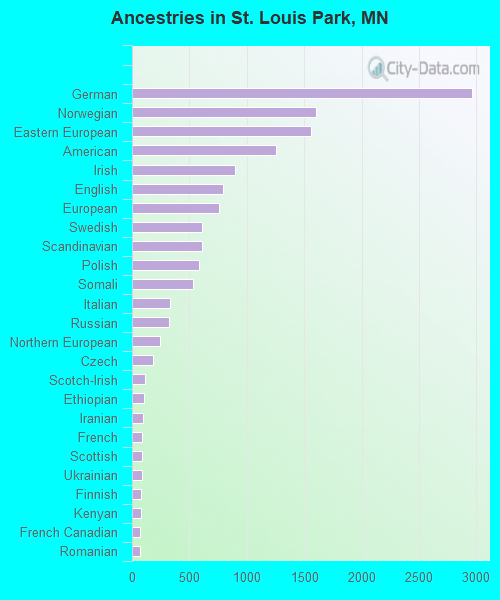
Ancestries in St. Louis Park
2,962 15.0% German1,600 8.1% Norwegian1,563 7.9% Eastern European1,258 6.4% American896 4.5% Irish792 4.0% English757 3.8% European614 3.1% Swedish611 3.1% Scandinavian580 2.9% Polish531 2.7% Somali330 1.7% Italian324 1.6% Russian246 1.2% Northern European185 0.9% Czech109 0.6% Scotch-Irish103 0.5% Ethiopian96 0.5% Iranian89 0.4% French87 0.4% Scottish87 0.4% Ukrainian81 0.4% Finnish76 0.4% Kenyan72 0.4% French Canadian69 0.3% Romanian68 0.3% Nigerian67 0.3% Slovene58 0.3% Dutch55 0.3% Croatian55 0.3% Slovak52 0.3% Danish51 0.3% British48 0.2% Greek42 0.2% Luxembourger41 0.2% Brazilian38 0.2% Belgian38 0.2% African35 0.2% West Indian35 0.2% Lebanese34 0.2% Latvian33 0.2% Canadian26 0.1% Carpatho Rusyn25 0.1% Haitian21 0.1% Lithuanian20 0.1% Guyanese18 0.09% Bulgarian17 0.09% Australian17 0.09% German Russian15 0.08% Czechoslovakian13 0.07% Belizean11 0.06% Armenian11 0.06% Jordanian10 0.05% Israeli9 0.05% Moroccan9 0.05% Zimbabwean9 0.05% Swiss7 0.04% Jamaican6 0.03% Pennsylvania German4 0.02% Austrian4 0.02% Welsh2 0.01% Hungarian2 0.01% Liberian2 0.01% Ghanaian
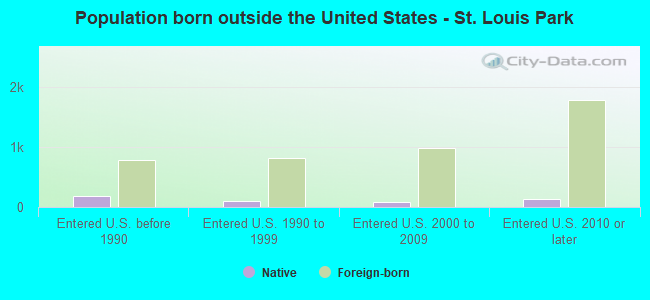
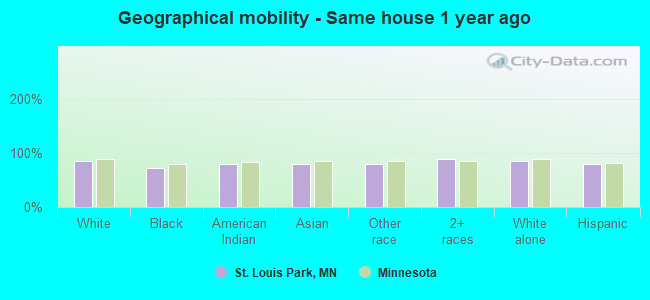
Geographical mobility in St. Louis Park Same house 1 year ago 31,785 84.3% White (Caucasian)1,883 72.6% Black or African American134 79.3% American Indian / Alaska Native1,941 80.1% Asian1,168 78.6% Other race3,474 89.0% Two or more races31,682 84.7% White alone, not Hispanic / Latino1,916 79.2% Hispanic or LatinoMoved within same county 3,538 9.4% White / Caucasian392 15.1% Black or African American34 20.2% American Indian / Alaska Native160 6.6% Asian46 3.1% Other race138 3.5% Two or more races3,387 9.1% White alone, not Hispanic / Latino222 9.2% Hispanic or LatinoMoved within same state 1,188 3.1% White / Caucasian111 4.3% Black or African American2 1.5% American Indian / Alaska Native114 4.7% Asian129 8.7% Other race92 2.4% Two or more races1,209 3.2% White alone, not Hispanic / Latino20 0.8% Hispanic or LatinoMoved from different state 1,048 2.8% White / Caucasian151 5.8% Black or African American271 11.2% Asian184 12.4% Other race244 6.2% Two or more races995 2.7% White alone, not Hispanic / Latino229 9.5% Hispanic or LatinoMoved from abroad 44 0.1% White25 1.7% Other race22 0.6% Two or more races38 0.1% White alone, not Hispanic / Latino82 3.4% Hispanic or Latino
Children Nativity (place of birth) in St. Louis Park
Children under 6 years - Living with two parents Both parents native 2,152 100.0% NativeBoth parents foreign-born 193 91.1% Native19 8.9% Foreign-bornOne native, one foreign-born parent 279 100.0% NativeChildren under 6 years - Living with one parent Native parent 413 100.0% NativeForeign-born parent 94 100.0% Foreign-bornChildren 6 to 17 years - Living with two parents Both parents native 2,916 98.8% Native37 1.2% Foreign-bornBoth parents foreign-born 85 55.9% Native67 44.1% Foreign-bornOne native, one foreign-born parent 567 100.0% NativeChildren 6 to 17 years - Living with one parent Native parent 1,088 93.0% Native82 7.0% Foreign-bornForeign-born parent 195 68.9% Native88 31.1% Foreign-born
Grandparents responsible for own grandchildren in St. Louis Park
Grandparents (30 to 59 years) White / Caucasian 8 100.0% Not responsible for grandchildrenWhite alone, not Hispanic / Latino 9 100.0% Not responsible for grandchildren
Grandparents (60 years and over) White / Caucasian 133 100.0% Not responsible for grandchildrenWhite alone, not Hispanic / Latino 131 100.0% Not responsible for grandchildren