Races in Stamford, Connecticut (CT) Detailed Stats
Data:
Races - White alone (%)
Races - White alone (% change since 2000)
Races - Black alone (%)
Races - Black alone (% change since 2000)
Races - American Indian alone (%)
Races - American Indian alone (% change since 2000)
Races - Asian alone (%)
Races - Asian alone (% change since 2000)
Races - Hispanic (%)
Races - Hispanic (% change since 2000)
Races - Native Hawaiian and Other Pacific Islander alone (%)
Races - Native Hawaiian and Other Pacific Islander alone (% change since 2000)
Races - Two or more races(%)
Races - Two or more races(% change since 2000)
Races - Other race alone (%)
Races - Other race alone (% change since 2000)
Racial diversity
Place of birth - Born in state of residence (%)
Place of birth - Born in state of residence (%) - White
Place of birth - Born in state of residence (%) - Black or African American
Place of birth - Born in state of residence (%) - Asian
Place of birth - Born in state of residence (%) - Hispanic or Latino
Place of birth - Born in state of residence (%) - American Indian and Alaska Native
Place of birth - Born in state of residence (%) - Multirace
Place of birth - Born in state of residence (%) - Other Race
Place of birth - Born in other state (%)
Place of birth - Born in other state (%) - White
Place of birth - Born in other state (%) - Black or African American
Place of birth - Born in other state (%) - Asian
Place of birth - Born in other state (%) - Hispanic or Latino
Place of birth - Born in other state (%) - American Indian and Alaska Native
Place of birth - Born in other state (%) - Multirace
Place of birth - Born in other state (%) - Other Race
Place of birth - Native, outside of US (%)
Place of birth - Native, outside of US (%) - White
Place of birth - Native, outside of US (%) - Black or African American
Place of birth - Native, outside of US (%) - Asian
Place of birth - Native, outside of US (%) - Hispanic or Latino
Place of birth - Native, outside of US (%) - American Indian and Alaska Native
Place of birth - Native, outside of US (%) - Multirace
Place of birth - Native, outside of US (%) - Other Race
Place of birth - Foreign born (%)
Place of birth - Foreign born (%) - White
Place of birth - Foreign born (%) - Black or African American
Place of birth - Foreign born (%) - Asian
Place of birth - Foreign born (%) - Hispanic or Latino
Place of birth - Foreign born (%) - American Indian and Alaska Native
Place of birth - Foreign born (%) - Multirace
Place of birth - Foreign born (%) - Other Race
Residents speaking English at home (%)
Residents speaking English at home - Born in the United States (%)
Residents speaking English at home - Native, born elsewhere (%)
Residents speaking English at home - Foreign born (%)
Residents speaking Spanish at home (%)
Residents speaking Spanish at home - Born in the United States (%)
Residents speaking Spanish at home - Native, born elsewhere (%)
Residents speaking Spanish at home - Foreign born (%)
Residents speaking other language at home (%)
Residents speaking other language at home - Born in the United States (%)
Residents speaking other language at home - Native, born elsewhere (%)
Residents speaking other language at home - Foreign born (%)
Marital status - Never married (%)
Marital status - Now married (%)
Marital status - Separated (%)
Marital status - Widowed (%)
Marital status - Divorced (%)
Ancestries Reported - Arab (%)
Ancestries Reported - Czech (%)
Ancestries Reported - Danish (%)
Ancestries Reported - Dutch (%)
Ancestries Reported - English (%)
Ancestries Reported - French (%)
Ancestries Reported - French Canadian (%)
Ancestries Reported - German (%)
Ancestries Reported - Greek (%)
Ancestries Reported - Hungarian (%)
Ancestries Reported - Irish (%)
Ancestries Reported - Italian (%)
Ancestries Reported - Lithuanian (%)
Ancestries Reported - Norwegian (%)
Ancestries Reported - Polish (%)
Ancestries Reported - Portuguese (%)
Ancestries Reported - Russian (%)
Ancestries Reported - Scotch-Irish (%)
Ancestries Reported - Scottish (%)
Ancestries Reported - Slovak (%)
Ancestries Reported - Subsaharan African (%)
Ancestries Reported - Swedish (%)
Ancestries Reported - Swiss (%)
Ancestries Reported - Ukrainian (%)
Ancestries Reported - United States (%)
Ancestries Reported - Welsh (%)
Ancestries Reported - West Indian (%)
Ancestries Reported - Other (%)
Geographical mobility - Same house 1 year ago (%)
Geographical mobility - Same house 1 year ago (%) - White
Geographical mobility - Same house 1 year ago (%) - Black or African American
Geographical mobility - Same house 1 year ago (%) - Asian
Geographical mobility - Same house 1 year ago (%) - Hispanic or Latino
Geographical mobility - Same house 1 year ago (%) - American Indian and Alaska Native
Geographical mobility - Same house 1 year ago (%) - Multirace
Geographical mobility - Same house 1 year ago (%) - Other Race
Geographical mobility - Moved within same county (%)
Geographical mobility - Moved within same county (%) - White
Geographical mobility - Moved within same county (%) - Black or African American
Geographical mobility - Moved within same county (%) - Asian
Geographical mobility - Moved within same county (%) - Hispanic or Latino
Geographical mobility - Moved within same county (%) - American Indian and Alaska Native
Geographical mobility - Moved within same county (%) - Multirace
Geographical mobility - Moved within same county (%) - Other Race
Geographical mobility - Moved from different county within same state (%)
Geographical mobility - Moved from different county within same state (%) - White
Geographical mobility - Moved from different county within same state (%) - Black or African American
Geographical mobility - Moved from different county within same state (%) - Asian
Geographical mobility - Moved from different county within same state (%) - Hispanic or Latino
Geographical mobility - Moved from different county within same state (%) - American Indian and Alaska Native
Geographical mobility - Moved from different county within same state (%) - Multirace
Geographical mobility - Moved from different county within same state (%) - Other Race
Geographical mobility - Moved from different state (%)
Geographical mobility - Moved from different state (%) - White
Geographical mobility - Moved from different state (%) - Black or African American
Geographical mobility - Moved from different state (%) - Asian
Geographical mobility - Moved from different state (%) - Hispanic or Latino
Geographical mobility - Moved from different state (%) - American Indian and Alaska Native
Geographical mobility - Moved from different state (%) - Multirace
Geographical mobility - Moved from different state (%) - Other Race
Geographical mobility - Moved from abroad (%)
Geographical mobility - Moved from abroad (%) - White
Geographical mobility - Moved from abroad (%) - Black or African American
Geographical mobility - Moved from abroad (%) - Asian
Geographical mobility - Moved from abroad (%) - Hispanic or Latino
Geographical mobility - Moved from abroad (%) - American Indian and Alaska Native
Geographical mobility - Moved from abroad (%) - Multirace
Geographical mobility - Moved from abroad (%) - Other Race
Place of birth for the foreign-born population - Ireland (%)
Place of birth for the foreign-born population - Denmark (%)
Place of birth for the foreign-born population - Norway (%)
Place of birth for the foreign-born population - Sweden (%)
Place of birth for the foreign-born population - United Kingdom (%)
Place of birth for the foreign-born population - England (%)
Place of birth for the foreign-born population - Scotland (%)
Place of birth for the foreign-born population - Other Northern Europe (%)
Place of birth for the foreign-born population - Austria (%)
Place of birth for the foreign-born population - Belgium (%)
Place of birth for the foreign-born population - France (%)
Place of birth for the foreign-born population - Germany (%)
Place of birth for the foreign-born population - Netherlands (%)
Place of birth for the foreign-born population - Switzerland (%)
Place of birth for the foreign-born population - Other Western Europe (%)
Place of birth for the foreign-born population - Greece (%)
Place of birth for the foreign-born population - Italy (%)
Place of birth for the foreign-born population - Portugal (%)
Place of birth for the foreign-born population - Spain (%)
Place of birth for the foreign-born population - Other Southern Europe (%)
Place of birth for the foreign-born population - Albania (%)
Place of birth for the foreign-born population - Belarus (%)
Place of birth for the foreign-born population - Bosnia and Herzegovina (%)
Place of birth for the foreign-born population - Bulgaria (%)
Place of birth for the foreign-born population - Croatia (%)
Place of birth for the foreign-born population - Czechoslovakia (%)
Place of birth for the foreign-born population - Hungary (%)
Place of birth for the foreign-born population - Latvia (%)
Place of birth for the foreign-born population - Lithuania (%)
Place of birth for the foreign-born population - North Macedonia (Macedonia) (%)
Place of birth for the foreign-born population - Moldova (%)
Place of birth for the foreign-born population - Poland (%)
Place of birth for the foreign-born population - Romania (%)
Place of birth for the foreign-born population - Russia (%)
Place of birth for the foreign-born population - Serbia (%)
Place of birth for the foreign-born population - Ukraine (%)
Place of birth for the foreign-born population - Other Eastern Europe (%)
Place of birth for the foreign-born population - China (%)
Place of birth for the foreign-born population - Hong Kong (%)
Place of birth for the foreign-born population - Taiwan (%)
Place of birth for the foreign-born population - Japan (%)
Place of birth for the foreign-born population - Korea (%)
Place of birth for the foreign-born population - Other Eastern Asia (%)
Place of birth for the foreign-born population - Afghanistan (%)
Place of birth for the foreign-born population - Bangladesh (%)
Place of birth for the foreign-born population - India (%)
Place of birth for the foreign-born population - Iran (%)
Place of birth for the foreign-born population - Kazakhstan (%)
Place of birth for the foreign-born population - Nepal (%)
Place of birth for the foreign-born population - Pakistan (%)
Place of birth for the foreign-born population - Sri Lanka (%)
Place of birth for the foreign-born population - Uzbekistan (%)
Place of birth for the foreign-born population - Other South Central Asia (%)
Place of birth for the foreign-born population - Burma (%)
Place of birth for the foreign-born population - Cambodia (%)
Place of birth for the foreign-born population - Indonesia (%)
Place of birth for the foreign-born population - Laos (%)
Place of birth for the foreign-born population - Malaysia (%)
Place of birth for the foreign-born population - Philippines (%)
Place of birth for the foreign-born population - Singapore (%)
Place of birth for the foreign-born population - Thailand (%)
Place of birth for the foreign-born population - Vietnam (%)
Place of birth for the foreign-born population - Other South Eastern Asia (%)
Place of birth for the foreign-born population - Armenia (%)
Place of birth for the foreign-born population - Iraq (%)
Place of birth for the foreign-born population - Israel (%)
Place of birth for the foreign-born population - Jordan (%)
Place of birth for the foreign-born population - Kuwait (%)
Place of birth for the foreign-born population - Lebanon (%)
Place of birth for the foreign-born population - Saudi Arabia (%)
Place of birth for the foreign-born population - Syria (%)
Place of birth for the foreign-born population - Turkey (%)
Place of birth for the foreign-born population - Yemen (%)
Place of birth for the foreign-born population - Other Western Asia (%)
Place of birth for the foreign-born population - Eritrea (%)
Place of birth for the foreign-born population - Ethiopia (%)
Place of birth for the foreign-born population - Kenya (%)
Place of birth for the foreign-born population - Somalia (%)
Place of birth for the foreign-born population - Uganda (%)
Place of birth for the foreign-born population - Zimbabwe (%)
Place of birth for the foreign-born population - Other Eastern Africa (%)
Place of birth for the foreign-born population - Cameroon (%)
Place of birth for the foreign-born population - Congo (%)
Place of birth for the foreign-born population - Democratic Republic of Congo (Zaire) (%)
Place of birth for the foreign-born population - Other Middle Africa (%)
Place of birth for the foreign-born population - Egypt (%)
Place of birth for the foreign-born population - Morocco (%)
Place of birth for the foreign-born population - Sudan (%)
Place of birth for the foreign-born population - Other Northern Africa (%)
Place of birth for the foreign-born population - South Africa (%)
Place of birth for the foreign-born population - Other Southern Africa (%)
Place of birth for the foreign-born population - Cabo Verde (%)
Place of birth for the foreign-born population - Ghana (%)
Place of birth for the foreign-born population - Liberia (%)
Place of birth for the foreign-born population - Nigeria (%)
Place of birth for the foreign-born population - Senegal (%)
Place of birth for the foreign-born population - Sierra Leone (%)
Place of birth for the foreign-born population - Other Western Africa (%)
Place of birth for the foreign-born population - Australia (%)
Place of birth for the foreign-born population - New Zealand (%)
Place of birth for the foreign-born population - Fiji (%)
Place of birth for the foreign-born population - Micronesia (%)
Place of birth for the foreign-born population - Bahamas (%)
Place of birth for the foreign-born population - Barbados (%)
Place of birth for the foreign-born population - Cuba (%)
Place of birth for the foreign-born population - Dominica (%)
Place of birth for the foreign-born population - Dominican Republic (%)
Place of birth for the foreign-born population - Grenada (%)
Place of birth for the foreign-born population - Haiti (%)
Place of birth for the foreign-born population - Jamaica (%)
Place of birth for the foreign-born population - St. Vincent and the Grenadines (%)
Place of birth for the foreign-born population - Trinidad and Tobago (%)
Place of birth for the foreign-born population - West Indies (%)
Place of birth for the foreign-born population - Other Caribbean (%)
Place of birth for the foreign-born population - Belize (%)
Place of birth for the foreign-born population - Costa Rica (%)
Place of birth for the foreign-born population - El Salvador (%)
Place of birth for the foreign-born population - Guatemala (%)
Place of birth for the foreign-born population - Honduras (%)
Place of birth for the foreign-born population - Mexico (%)
Place of birth for the foreign-born population - Nicaragua (%)
Place of birth for the foreign-born population - Panama (%)
Place of birth for the foreign-born population - Other Central America (%)
Place of birth for the foreign-born population - Argentina (%)
Place of birth for the foreign-born population - Bolivia (%)
Place of birth for the foreign-born population - Brazil (%)
Place of birth for the foreign-born population - Chile (%)
Place of birth for the foreign-born population - Colombia (%)
Place of birth for the foreign-born population - Ecuador (%)
Place of birth for the foreign-born population - Guyana (%)
Place of birth for the foreign-born population - Peru (%)
Place of birth for the foreign-born population - Uruguay (%)
Place of birth for the foreign-born population - Venezuela (%)
Place of birth for the foreign-born population - Other South America (%)
Place of birth for the foreign-born population - Canada (%)
Place of birth for the foreign-born population - Other Northern America (%)
Place of birth for the foreign-born population - Other (%)
Latest news about races in Stamford, CT collected exclusively by city-data.com from local newspapers, TV, and radio stations
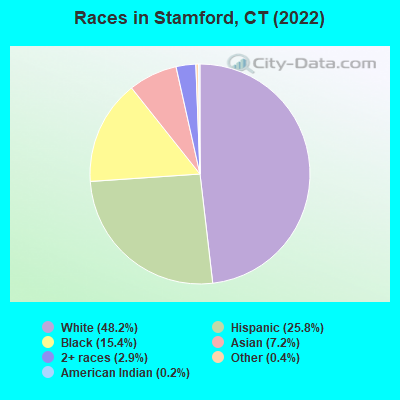
According to 2022 data, the most numerous races in Stamford, CT are White alone (65,652 residents), Hispanic (35,120 residents), and Black alone (20,925 residents). 58.0% of Stamford residents speak English at home. 34.0% of Stamford, CT residents are foreign-born (20.3% born in Latin America, 5.3% born in Asia, 5.3% born in Europe), which is 55.8% greater than the foreign-born rate of 15.0% across the entire state of Connecticut.
Race distribution in Stamford
2000 2022
71,610 61.2% White alone 19,635 16.8% Hispanic 17,421 14.9% Black alone 5,818 5.0% Asian alone 2,162 1.8% Two or more races 291 0.2% Other race alone 120 0.1% American Indian alone 26 0.02% Native Hawaiian and Other
65,652 48.2% White alone 35,120 25.8% Hispanic 20,925 15.4% Black alone 9,866 7.2% Asian alone 3,883 2.9% Two or more races 514 0.4% Other race alone 237 0.2% American Indian alone
2000 2022
2,638,845 77.5% White alone 320,323 9.4% Hispanic 295,571 8.7% Black alone 81,564 2.4% Asian alone 52,896 1.6% Two or more races 8,141 0.2% Other race alone 7,267 0.2% American Indian alone 958 0.03% Native Hawaiian and Other
2,246,913 62.0% White alone 658,978 18.2% Hispanic 353,973 9.8% Black alone 172,929 4.8% Asian alone 159,631 4.4% Two or more races 29,761 0.8% Other race alone 3,428 0.09% American Indian alone 592 0.02% Native Hawaiian and Other
Income and house value in Stamford Median household income in 2022 $115,080 White non-Hispanic householders$63,693 Black householders$107,430 Asian householders$53,382 Some other race householders$107,591 Two or more races householders$65,462 Hispanic or Latino race householdersMedian 2022 house value $682,711 White Non-Hispanic householders$426,694 Black or African American householders$434,486 American Indian or Alaska Native householders $669,122 Asian householders$452,967 Native Hawaiian and other Pacific Islander householders$446,081 Some other race householders$495,545 Two or more races householders$467,099 Hispanic or Latino householders
Median age by race in Stamford
41.0 Median age for White residents40.7 41.3 38.3 Median age for Black or African American residents38.4 38.2 35.6 Median age for American Indian / Alaska Native residents49.2 27.8 34.3 Median age for Asian residents30.6 37.8 15.2 Median age for Native Hawaiian / Pacific Islander residents-666,666,666.0 -666,666,666.0 36.1 Median age for Other race residents36.5 35.6 36.5 Median age for Two or more races residents35.4 38.1 41.2 Median age for White alone residents41.9 41.0 36.7 Median age for Hispanic or Latino residents34.3 38.3
Owner/renter occupied households by race in Stamford
House owners and renters - White residents 19,525 59.7% Owner occupied13,171 40.3% Renter occupiedHouse owners and renters - Black or African American residents 3,735 34.6% Owner occupied7,045 65.4% Renter occupiedHouse owners and renters - American Indian / Alaska Native residents 19 11.4% Owner occupied148 88.6% Renter occupiedHouse owners and renters - Asian residents 1,734 43.3% Owner occupied2,275 56.7% Renter occupiedHouse owners and renters - Other race residents 1,179 23.3% Owner occupied3,874 76.7% Renter occupiedHouse owners and renters - Two or more races residents 2,678 42.9% Owner occupied3,571 57.1% Renter occupiedHouse owners and renters - White alone residents 18,397 58.6% Owner occupied12,982 41.4% Renter occupiedHouse owners and renters - Hispanic or Latino residents 4,322 36.1% Owner occupied7,649 63.9% Renter occupied
Language usage in Stamford
English speakers - Total 58.0% of residents of Stamford speak English at home.
22.8% of residents speak Spanish at home 13,177 44.7% Speak English very well16,298 55.3% Speak English less than very well19.2% of residents speak other language at home 18,464 74.4% Speak English very well6,356 25.6% Speak English less than very well
English speakers - Born in the United States 87.3% of residents of Stamford speak English at home.
6.7% of residents speak Spanish at home 2,382 77.7% Speak English very well683 22.3% Speak English less than very well6.0% of residents speak other language at home 2,608 95.7% Speak English very well118 4.3% Speak English less than very well
English speakers - Native, born elsewhere 27.3% of residents of Stamford speak English at home.
27.5% of residents speak Spanish at home 665 69.8% Speak English very well288 30.2% Speak English less than very well45.3% of residents speak other language at home 1,190 75.7% Speak English very well381 24.3% Speak English less than very well
English speakers - Foreign-born 14.4% of residents of Stamford speak English at home.
47.3% of residents speak Spanish at home 6,168 28.9% Speak English very well15,191 71.1% Speak English less than very well38.2% of residents speak other language at home 11,646 67.5% Speak English very well5,614 32.5% Speak English less than very well
White (Caucasian) - Speak only English Native:
89.3% (50,414)Foreign-born:
20.1% (2,175)
White (Caucasian) - Speak another language Native:
10.7% (6,010)Foreign-born:
79.9% (8,630)
Black or African American - Speak only English Native:
80.6% (12,606)Foreign-born:
32.3% (1,599)
Black or African American - Speak another language Native:
19.4% (3,038)Foreign-born:
67.7% (3,351)
American Indian / Alaska Native - Speak only English Native:
33.8% (56)Foreign-born:
36.8% (99)
American Indian / Alaska Native - Speak another language Native:
80.5% (134)Foreign-born:
67.2% (181)
Asian - Speak only English Native:
79.6% (1,650)Foreign-born:
17.2% (1,317)
Asian - Speak another language Native:
20.4% (424)Foreign-born:
82.8% (6,348)
Native Hawaiian / Pacific Islander - Speak another language Native:
45.6% (20)Foreign-born:
100.0% (67)
Other race - Speak only English Native:
30.3% (1,383)Foreign-born:
2.7% (302)
Other race - Speak another language Native:
69.7% (3,180)Foreign-born:
97.3% (10,686)
Two or more races - Speak only English Native:
45.4% (2,309)Foreign-born:
9.3% (891)
Two or more races - Speak another language Native:
54.6% (2,778)Foreign-born:
90.7% (8,680)
White alone - Speak only English Native:
91.0% (49,684)Foreign-born:
24.3% (2,059)
White alone - Speak another language Native:
9.0% (4,915)Foreign-born:
75.7% (6,425)
Hispanic or Latino - Speak only English Native:
31.7% (3,150)Foreign-born:
4.8% (1,082)
Hispanic or Latino - Speak another language Native:
68.3% (6,787)Foreign-born:
95.2% (21,474)
Foreign-born residents in Stamford 46,167 residents are foreign born (20.3% Latin America , 5.3% Asia , 5.3% Europe ).
This city:
34.0%Connecticut:
15.0%
Marital status for residents in Stamford Marital status - White (Caucasian) population 15 years and over
Males 39.8% Never married50.4% Now married1.5% Separated0.4% Widowed7.9% DivorcedFemales 38.4% Never married44.4% Now married0.3% Separated7.4% Widowed9.4% DivorcedWomen who gave birth in the past 12 months Now married:
83.3% (778)Unmarried:
16.7% (156)
Women who did not give birth in the past 12 months Now married:
31.6% (5,137)Unmarried:
68.4% (11,141)
Marital status - Black or African American population 15 years and over
Males 46.2% Never married33.3% Now married1.1% Separated1.1% Widowed18.3% DivorcedFemales 43.2% Never married24.9% Now married3.6% Separated11.0% Widowed17.3% DivorcedWomen who gave birth in the past 12 months Now married:
37.6% (115)Unmarried:
62.4% (190)
Women who did not give birth in the past 12 months Now married:
16.1% (1,060)Unmarried:
83.9% (5,538)
Marital status - American Indian / Alaska Native population 15 years and over
Males 44.2% Never married39.4% Now married0.0% Separated6.2% Widowed10.1% DivorcedFemales 50.0% Never married50.0% Now married0.0% Separated0.0% Widowed0.0% DivorcedWomen who gave birth in the past 12 months Now married:
100.0% (11)Unmarried:
0.0% (0)
Women who did not give birth in the past 12 months Now married:
21.8% (12)Unmarried:
78.2% (43)
Marital status - Asian population 15 years and over
Males 48.4% Never married50.3% Now married0.0% Separated0.0% Widowed1.3% DivorcedFemales 22.7% Never married64.1% Now married1.6% Separated5.8% Widowed5.7% DivorcedWomen who gave birth in the past 12 months Now married:
100.0% (150)Unmarried:
0.0% (0)
Women who did not give birth in the past 12 months Now married:
59.5% (1,402)Unmarried:
40.5% (955)
Marital status - Native Hawaiian / Pacific Islander population 15 years and over
Males 100.0% Never married0.0% Now married0.0% Separated0.0% Widowed0.0% DivorcedFemales 100.0% Never married0.0% Now married0.0% Separated0.0% Widowed0.0% DivorcedWomen who gave birth in the past 12 months Now married:
0.0% (0)Unmarried:
100.0% (23)
Women who did not give birth in the past 12 months Now married:
0.0% (0)Unmarried:
100.0% (23)
Marital status - Other race population 15 years and over
Males 49.4% Never married36.8% Now married0.0% Separated0.0% Widowed13.8% DivorcedFemales 43.4% Never married36.8% Now married8.7% Separated8.4% Widowed2.7% DivorcedWomen who gave birth in the past 12 months Now married:
57.0% (345)Unmarried:
43.0% (260)
Women who did not give birth in the past 12 months Now married:
38.1% (1,459)Unmarried:
61.9% (2,371)
Marital status - Two or more races population 15 years and over
Males 51.3% Never married41.0% Now married3.1% Separated0.0% Widowed4.5% DivorcedFemales 39.8% Never married36.3% Now married0.6% Separated7.2% Widowed16.0% DivorcedWomen who gave birth in the past 12 months Now married:
62.9% (319)Unmarried:
37.1% (188)
Women who did not give birth in the past 12 months Now married:
37.5% (1,582)Unmarried:
62.5% (2,638)
Marital status - White alone, not Hispanic / Latino population 15 years and over
Males 38.9% Never married50.6% Now married1.6% Separated0.4% Widowed8.6% DivorcedFemales 39.2% Never married43.1% Now married0.3% Separated7.7% Widowed9.6% DivorcedWomen who gave birth in the past 12 months Now married:
83.3% (778)Unmarried:
16.7% (156)
Women who did not give birth in the past 12 months Now married:
30.0% (4,737)Unmarried:
70.0% (11,035)
Marital status - Hispanic or Latino population 15 years and over
Males 51.1% Never married39.4% Now married1.1% Separated0.0% Widowed8.4% DivorcedFemales 41.5% Never married38.0% Now married4.2% Separated6.6% Widowed9.7% DivorcedWomen who gave birth in the past 12 months Now married:
59.9% (728)Unmarried:
40.1% (487)
Women who did not give birth in the past 12 months Now married:
35.8% (2,699)Unmarried:
64.2% (4,838)
Ancestries in Stamford
6,876 9.0% Italian3,972 5.2% Haitian3,063 4.0% American2,500 3.3% Irish2,341 3.1% Jamaican1,913 2.5% Polish1,692 2.2% English1,149 1.5% German1,125 1.5% Ukrainian1,084 1.4% Ghanaian948 1.2% European943 1.2% Russian802 1.1% Eastern European610 0.8% Greek536 0.7% Bulgarian482 0.6% Nigerian410 0.5% Brazilian361 0.5% British316 0.4% Albanian315 0.4% French269 0.4% South African266 0.3% Scottish186 0.2% African181 0.2% Trinidadian and Tobagonian157 0.2% Portuguese132 0.2% Hungarian130 0.2% Austrian126 0.2% Latvian125 0.2% French Canadian117 0.2% Swedish105 0.1% West Indian91 0.1% Cape Verdean91 0.1% Romanian84 0.1% Dutch83 0.1% Scotch-Irish82 0.1% Norwegian80 0.1% Guyanese79 0.1% Armenian78 0.1% Canadian78 0.1% Moroccan72 0.09% Arab58 0.08% Iranian56 0.07% Danish46 0.06% Ugandan46 0.06% Barbadian46 0.06% Serbian43 0.06% Northern European42 0.06% Lithuanian40 0.05% Turkish39 0.05% Slovak38 0.05% Palestinian31 0.04% Lebanese26 0.03% Scandinavian26 0.03% Israeli25 0.03% Finnish22 0.03% Czech18 0.02% Egyptian14 0.02% Iraqi12 0.02% Swiss11 0.01% Syrian10 0.01% Maltese10 0.01% Belizean9 0.01% Welsh8 0.01% Belgian6 0.01% Pennsylvania German5 0.01% Croatian5 0.01% Slovene
Geographical mobility in Stamford Same house 1 year ago 57,545 83.0% White (Caucasian)20,497 83.3% Black or African American427 92.9% American Indian / Alaska Native8,226 81.3% Asian113 100.0% Native Hawaiian / Pacific Islander14,204 87.4% Other race11,633 74.4% Two or more races53,422 82.2% White alone, not Hispanic / Latino28,985 84.1% Hispanic or LatinoMoved within same county 6,373 9.2% White / Caucasian1,885 7.7% Black or African American7 1.4% American Indian / Alaska Native608 6.0% Asian1,528 9.4% Other race2,611 16.7% Two or more races6,211 9.6% White alone, not Hispanic / Latino3,767 10.9% Hispanic or LatinoMoved within same state 429 0.6% White / Caucasian635 2.6% Black or African American103 1.0% Asian77 0.5% Other race719 4.6% Two or more races429 0.7% White alone, not Hispanic / Latino716 2.1% Hispanic or LatinoMoved from different state 4,781 6.9% White / Caucasian1,120 4.6% Black or African American813 8.0% Asian384 2.4% Other race608 3.9% Two or more races4,694 7.2% White alone, not Hispanic / Latino855 2.5% Hispanic or LatinoMoved from abroad 218 0.3% White312 1.3% Black or African American364 3.6% Asian66 0.4% Other race62 0.4% Two or more races218 0.3% White alone, not Hispanic / Latino128 0.4% Hispanic or Latino
Children Nativity (place of birth) in Stamford
Children under 6 years - Living with two parents Both parents native 2,141 100.0% NativeBoth parents foreign-born 1,654 77.9% Native469 22.1% Foreign-bornOne native, one foreign-born parent 1,062 100.0% NativeChildren under 6 years - Living with one parent Native parent 1,430 100.0% NativeForeign-born parent 1,205 100.0% NativeChildren 6 to 17 years - Living with two parents Both parents native 3,364 96.7% Native116 3.3% Foreign-bornBoth parents foreign-born 2,112 79.5% Native544 20.5% Foreign-bornOne native, one foreign-born parent 1,386 96.7% Native48 3.3% Foreign-bornChildren 6 to 17 years - Living with one parent Native parent 1,959 100.0% NativeForeign-born parent 1,557 56.9% Native1,178 43.1% Foreign-born
Place of birth for residents in Stamford 29,205 Americas28,773 Latin America10,359 Central America10,244 South America8,170 Caribbean7,562 Asia7,542 Europe4,068 South Central Asia4,019 Eastern Europe2,430 Eastern Asia2,043 China1,811 Africa1,653 Southern Europe1,268 Northern Europe1,003 Western Africa716 South Eastern Asia588 Western Europe431 Northern America409 Northern Africa346 Western Asia231 Eastern Africa106 Southern Africa60 Middle Africa45 Oceania45 Australia and New Zealand Subregion7,394 Guatemala3,681 Haiti3,236 India3,151 Colombia2,646 Ecuador1,947 Dominican Republic1,912 Peru1,885 China1,699 Jamaica1,341 Mexico1,054 Honduras1,045 Italy1,028 Poland942 Ukraine670 Brazil670 Ghana655 Argentina558 United Kingdom548 Russia462 Philippines443 Bangladesh438 Albania423 Greece421 Venezuela412 El Salvador384 Canada377 England332 Nigeria328 Morocco312 Korea269 West Indies245 Bulgaria242 Germany232 France222 Uruguay176 Trinidad and Tobago170 Chile166 Guyana163 Belarus153 Spain151 Cuba150 Bolivia132 Romania116 Latvia106 South Africa105 Pakistan103 Scotland101 Iran95 Denmark91 Afghanistan83 Taiwan80 Czechoslovakia79 Ireland74 Japan74 Hong Kong73 Malaysia73 Israel71 Vietnam69 Costa Rica63 Barbados63 Lithuania61 Armenia60 Turkey55 Nicaragua55 Nepal55 Grenada55 Iraq40 Australia39 Switzerland39 Thailand38 Indonesia36 Netherlands34 Dominica32 Cameroon31 Singapore31 Panama29 Sri Lanka28 Democratic Republic of Congo (Zaire)28 Serbia28 St. Vincent and the Grenadines27 Austria25 Georgia24 Egypt24 Moldova23 Uganda23 Lebanon21 Sweden19 Tanzania19 Portugal16 Saudi Arabia14 Azerbaijan13 Bosnia and Herzegovina9 Belgium9 Hungary8 Norway8 Algeria8 United Arab Emirates7 Syria5 Kazakhstan5 Kenya4 New Zealand
Grandparents responsible for own grandchildren in Stamford
Grandparents (30 to 59 years) White / Caucasian 91 37.3% Responsible for grandchildren153 62.7% Not responsible for grandchildrenBlack or African American 55 100.0% Not responsible for grandchildrenAsian 59 100.0% Not responsible for grandchildrenOther race 11 7.3% Responsible for grandchildren140 92.7% Not responsible for grandchildrenTwo or more races 107 25.5% Responsible for grandchildren314 74.5% Not responsible for grandchildrenWhite alone, not Hispanic / Latino 81 100.0% Not responsible for grandchildrenHispanic or Latino 199 31.0% Responsible for grandchildren443 69.0% Not responsible for grandchildrenGrandparents (60 years and over) White / Caucasian 11 2.7% Responsible for grandchildren410 97.3% Not responsible for grandchildrenBlack or African American 80 17.5% Responsible for grandchildren378 82.5% Not responsible for grandchildrenAsian 216 100.0% Not responsible for grandchildrenOther race 14 2.9% Responsible for grandchildren480 97.1% Not responsible for grandchildrenTwo or more races 192 100.0% Not responsible for grandchildrenWhite alone, not Hispanic / Latino 12 3.9% Responsible for grandchildren302 96.1% Not responsible for grandchildrenHispanic or Latino 9 1.2% Responsible for grandchildren702 98.8% Not responsible for grandchildren