Races in Stanton, California (CA) Detailed Stats
Data:
Races - White alone (%)
Races - White alone (% change since 2000)
Races - Black alone (%)
Races - Black alone (% change since 2000)
Races - American Indian alone (%)
Races - American Indian alone (% change since 2000)
Races - Asian alone (%)
Races - Asian alone (% change since 2000)
Races - Hispanic (%)
Races - Hispanic (% change since 2000)
Races - Native Hawaiian and Other Pacific Islander alone (%)
Races - Native Hawaiian and Other Pacific Islander alone (% change since 2000)
Races - Two or more races(%)
Races - Two or more races(% change since 2000)
Races - Other race alone (%)
Races - Other race alone (% change since 2000)
Racial diversity
Place of birth - Born in state of residence (%)
Place of birth - Born in state of residence (%) - White
Place of birth - Born in state of residence (%) - Black or African American
Place of birth - Born in state of residence (%) - Asian
Place of birth - Born in state of residence (%) - Hispanic or Latino
Place of birth - Born in state of residence (%) - American Indian and Alaska Native
Place of birth - Born in state of residence (%) - Multirace
Place of birth - Born in state of residence (%) - Other Race
Place of birth - Born in other state (%)
Place of birth - Born in other state (%) - White
Place of birth - Born in other state (%) - Black or African American
Place of birth - Born in other state (%) - Asian
Place of birth - Born in other state (%) - Hispanic or Latino
Place of birth - Born in other state (%) - American Indian and Alaska Native
Place of birth - Born in other state (%) - Multirace
Place of birth - Born in other state (%) - Other Race
Place of birth - Native, outside of US (%)
Place of birth - Native, outside of US (%) - White
Place of birth - Native, outside of US (%) - Black or African American
Place of birth - Native, outside of US (%) - Asian
Place of birth - Native, outside of US (%) - Hispanic or Latino
Place of birth - Native, outside of US (%) - American Indian and Alaska Native
Place of birth - Native, outside of US (%) - Multirace
Place of birth - Native, outside of US (%) - Other Race
Place of birth - Foreign born (%)
Place of birth - Foreign born (%) - White
Place of birth - Foreign born (%) - Black or African American
Place of birth - Foreign born (%) - Asian
Place of birth - Foreign born (%) - Hispanic or Latino
Place of birth - Foreign born (%) - American Indian and Alaska Native
Place of birth - Foreign born (%) - Multirace
Place of birth - Foreign born (%) - Other Race
Residents speaking English at home (%)
Residents speaking English at home - Born in the United States (%)
Residents speaking English at home - Native, born elsewhere (%)
Residents speaking English at home - Foreign born (%)
Residents speaking Spanish at home (%)
Residents speaking Spanish at home - Born in the United States (%)
Residents speaking Spanish at home - Native, born elsewhere (%)
Residents speaking Spanish at home - Foreign born (%)
Residents speaking other language at home (%)
Residents speaking other language at home - Born in the United States (%)
Residents speaking other language at home - Native, born elsewhere (%)
Residents speaking other language at home - Foreign born (%)
Marital status - Never married (%)
Marital status - Now married (%)
Marital status - Separated (%)
Marital status - Widowed (%)
Marital status - Divorced (%)
Ancestries Reported - Arab (%)
Ancestries Reported - Czech (%)
Ancestries Reported - Danish (%)
Ancestries Reported - Dutch (%)
Ancestries Reported - English (%)
Ancestries Reported - French (%)
Ancestries Reported - French Canadian (%)
Ancestries Reported - German (%)
Ancestries Reported - Greek (%)
Ancestries Reported - Hungarian (%)
Ancestries Reported - Irish (%)
Ancestries Reported - Italian (%)
Ancestries Reported - Lithuanian (%)
Ancestries Reported - Norwegian (%)
Ancestries Reported - Polish (%)
Ancestries Reported - Portuguese (%)
Ancestries Reported - Russian (%)
Ancestries Reported - Scotch-Irish (%)
Ancestries Reported - Scottish (%)
Ancestries Reported - Slovak (%)
Ancestries Reported - Subsaharan African (%)
Ancestries Reported - Swedish (%)
Ancestries Reported - Swiss (%)
Ancestries Reported - Ukrainian (%)
Ancestries Reported - United States (%)
Ancestries Reported - Welsh (%)
Ancestries Reported - West Indian (%)
Ancestries Reported - Other (%)
Geographical mobility - Same house 1 year ago (%)
Geographical mobility - Same house 1 year ago (%) - White
Geographical mobility - Same house 1 year ago (%) - Black or African American
Geographical mobility - Same house 1 year ago (%) - Asian
Geographical mobility - Same house 1 year ago (%) - Hispanic or Latino
Geographical mobility - Same house 1 year ago (%) - American Indian and Alaska Native
Geographical mobility - Same house 1 year ago (%) - Multirace
Geographical mobility - Same house 1 year ago (%) - Other Race
Geographical mobility - Moved within same county (%)
Geographical mobility - Moved within same county (%) - White
Geographical mobility - Moved within same county (%) - Black or African American
Geographical mobility - Moved within same county (%) - Asian
Geographical mobility - Moved within same county (%) - Hispanic or Latino
Geographical mobility - Moved within same county (%) - American Indian and Alaska Native
Geographical mobility - Moved within same county (%) - Multirace
Geographical mobility - Moved within same county (%) - Other Race
Geographical mobility - Moved from different county within same state (%)
Geographical mobility - Moved from different county within same state (%) - White
Geographical mobility - Moved from different county within same state (%) - Black or African American
Geographical mobility - Moved from different county within same state (%) - Asian
Geographical mobility - Moved from different county within same state (%) - Hispanic or Latino
Geographical mobility - Moved from different county within same state (%) - American Indian and Alaska Native
Geographical mobility - Moved from different county within same state (%) - Multirace
Geographical mobility - Moved from different county within same state (%) - Other Race
Geographical mobility - Moved from different state (%)
Geographical mobility - Moved from different state (%) - White
Geographical mobility - Moved from different state (%) - Black or African American
Geographical mobility - Moved from different state (%) - Asian
Geographical mobility - Moved from different state (%) - Hispanic or Latino
Geographical mobility - Moved from different state (%) - American Indian and Alaska Native
Geographical mobility - Moved from different state (%) - Multirace
Geographical mobility - Moved from different state (%) - Other Race
Geographical mobility - Moved from abroad (%)
Geographical mobility - Moved from abroad (%) - White
Geographical mobility - Moved from abroad (%) - Black or African American
Geographical mobility - Moved from abroad (%) - Asian
Geographical mobility - Moved from abroad (%) - Hispanic or Latino
Geographical mobility - Moved from abroad (%) - American Indian and Alaska Native
Geographical mobility - Moved from abroad (%) - Multirace
Geographical mobility - Moved from abroad (%) - Other Race
Place of birth for the foreign-born population - Ireland (%)
Place of birth for the foreign-born population - Denmark (%)
Place of birth for the foreign-born population - Norway (%)
Place of birth for the foreign-born population - Sweden (%)
Place of birth for the foreign-born population - United Kingdom (%)
Place of birth for the foreign-born population - England (%)
Place of birth for the foreign-born population - Scotland (%)
Place of birth for the foreign-born population - Other Northern Europe (%)
Place of birth for the foreign-born population - Austria (%)
Place of birth for the foreign-born population - Belgium (%)
Place of birth for the foreign-born population - France (%)
Place of birth for the foreign-born population - Germany (%)
Place of birth for the foreign-born population - Netherlands (%)
Place of birth for the foreign-born population - Switzerland (%)
Place of birth for the foreign-born population - Other Western Europe (%)
Place of birth for the foreign-born population - Greece (%)
Place of birth for the foreign-born population - Italy (%)
Place of birth for the foreign-born population - Portugal (%)
Place of birth for the foreign-born population - Spain (%)
Place of birth for the foreign-born population - Other Southern Europe (%)
Place of birth for the foreign-born population - Albania (%)
Place of birth for the foreign-born population - Belarus (%)
Place of birth for the foreign-born population - Bosnia and Herzegovina (%)
Place of birth for the foreign-born population - Bulgaria (%)
Place of birth for the foreign-born population - Croatia (%)
Place of birth for the foreign-born population - Czechoslovakia (%)
Place of birth for the foreign-born population - Hungary (%)
Place of birth for the foreign-born population - Latvia (%)
Place of birth for the foreign-born population - Lithuania (%)
Place of birth for the foreign-born population - North Macedonia (Macedonia) (%)
Place of birth for the foreign-born population - Moldova (%)
Place of birth for the foreign-born population - Poland (%)
Place of birth for the foreign-born population - Romania (%)
Place of birth for the foreign-born population - Russia (%)
Place of birth for the foreign-born population - Serbia (%)
Place of birth for the foreign-born population - Ukraine (%)
Place of birth for the foreign-born population - Other Eastern Europe (%)
Place of birth for the foreign-born population - China (%)
Place of birth for the foreign-born population - Hong Kong (%)
Place of birth for the foreign-born population - Taiwan (%)
Place of birth for the foreign-born population - Japan (%)
Place of birth for the foreign-born population - Korea (%)
Place of birth for the foreign-born population - Other Eastern Asia (%)
Place of birth for the foreign-born population - Afghanistan (%)
Place of birth for the foreign-born population - Bangladesh (%)
Place of birth for the foreign-born population - India (%)
Place of birth for the foreign-born population - Iran (%)
Place of birth for the foreign-born population - Kazakhstan (%)
Place of birth for the foreign-born population - Nepal (%)
Place of birth for the foreign-born population - Pakistan (%)
Place of birth for the foreign-born population - Sri Lanka (%)
Place of birth for the foreign-born population - Uzbekistan (%)
Place of birth for the foreign-born population - Other South Central Asia (%)
Place of birth for the foreign-born population - Burma (%)
Place of birth for the foreign-born population - Cambodia (%)
Place of birth for the foreign-born population - Indonesia (%)
Place of birth for the foreign-born population - Laos (%)
Place of birth for the foreign-born population - Malaysia (%)
Place of birth for the foreign-born population - Philippines (%)
Place of birth for the foreign-born population - Singapore (%)
Place of birth for the foreign-born population - Thailand (%)
Place of birth for the foreign-born population - Vietnam (%)
Place of birth for the foreign-born population - Other South Eastern Asia (%)
Place of birth for the foreign-born population - Armenia (%)
Place of birth for the foreign-born population - Iraq (%)
Place of birth for the foreign-born population - Israel (%)
Place of birth for the foreign-born population - Jordan (%)
Place of birth for the foreign-born population - Kuwait (%)
Place of birth for the foreign-born population - Lebanon (%)
Place of birth for the foreign-born population - Saudi Arabia (%)
Place of birth for the foreign-born population - Syria (%)
Place of birth for the foreign-born population - Turkey (%)
Place of birth for the foreign-born population - Yemen (%)
Place of birth for the foreign-born population - Other Western Asia (%)
Place of birth for the foreign-born population - Eritrea (%)
Place of birth for the foreign-born population - Ethiopia (%)
Place of birth for the foreign-born population - Kenya (%)
Place of birth for the foreign-born population - Somalia (%)
Place of birth for the foreign-born population - Uganda (%)
Place of birth for the foreign-born population - Zimbabwe (%)
Place of birth for the foreign-born population - Other Eastern Africa (%)
Place of birth for the foreign-born population - Cameroon (%)
Place of birth for the foreign-born population - Congo (%)
Place of birth for the foreign-born population - Democratic Republic of Congo (Zaire) (%)
Place of birth for the foreign-born population - Other Middle Africa (%)
Place of birth for the foreign-born population - Egypt (%)
Place of birth for the foreign-born population - Morocco (%)
Place of birth for the foreign-born population - Sudan (%)
Place of birth for the foreign-born population - Other Northern Africa (%)
Place of birth for the foreign-born population - South Africa (%)
Place of birth for the foreign-born population - Other Southern Africa (%)
Place of birth for the foreign-born population - Cabo Verde (%)
Place of birth for the foreign-born population - Ghana (%)
Place of birth for the foreign-born population - Liberia (%)
Place of birth for the foreign-born population - Nigeria (%)
Place of birth for the foreign-born population - Senegal (%)
Place of birth for the foreign-born population - Sierra Leone (%)
Place of birth for the foreign-born population - Other Western Africa (%)
Place of birth for the foreign-born population - Australia (%)
Place of birth for the foreign-born population - New Zealand (%)
Place of birth for the foreign-born population - Fiji (%)
Place of birth for the foreign-born population - Micronesia (%)
Place of birth for the foreign-born population - Bahamas (%)
Place of birth for the foreign-born population - Barbados (%)
Place of birth for the foreign-born population - Cuba (%)
Place of birth for the foreign-born population - Dominica (%)
Place of birth for the foreign-born population - Dominican Republic (%)
Place of birth for the foreign-born population - Grenada (%)
Place of birth for the foreign-born population - Haiti (%)
Place of birth for the foreign-born population - Jamaica (%)
Place of birth for the foreign-born population - St. Vincent and the Grenadines (%)
Place of birth for the foreign-born population - Trinidad and Tobago (%)
Place of birth for the foreign-born population - West Indies (%)
Place of birth for the foreign-born population - Other Caribbean (%)
Place of birth for the foreign-born population - Belize (%)
Place of birth for the foreign-born population - Costa Rica (%)
Place of birth for the foreign-born population - El Salvador (%)
Place of birth for the foreign-born population - Guatemala (%)
Place of birth for the foreign-born population - Honduras (%)
Place of birth for the foreign-born population - Mexico (%)
Place of birth for the foreign-born population - Nicaragua (%)
Place of birth for the foreign-born population - Panama (%)
Place of birth for the foreign-born population - Other Central America (%)
Place of birth for the foreign-born population - Argentina (%)
Place of birth for the foreign-born population - Bolivia (%)
Place of birth for the foreign-born population - Brazil (%)
Place of birth for the foreign-born population - Chile (%)
Place of birth for the foreign-born population - Colombia (%)
Place of birth for the foreign-born population - Ecuador (%)
Place of birth for the foreign-born population - Guyana (%)
Place of birth for the foreign-born population - Peru (%)
Place of birth for the foreign-born population - Uruguay (%)
Place of birth for the foreign-born population - Venezuela (%)
Place of birth for the foreign-born population - Other South America (%)
Place of birth for the foreign-born population - Canada (%)
Place of birth for the foreign-born population - Other Northern America (%)
Place of birth for the foreign-born population - Other (%)
Latest news about races in Stanton, CA collected exclusively by city-data.com from local newspapers, TV, and radio stations
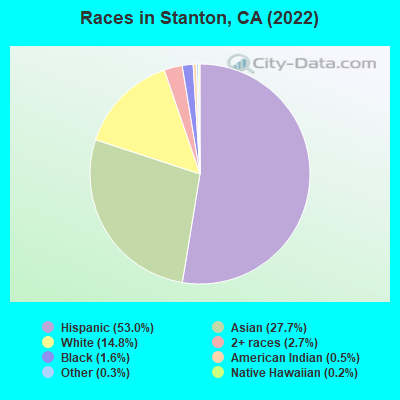
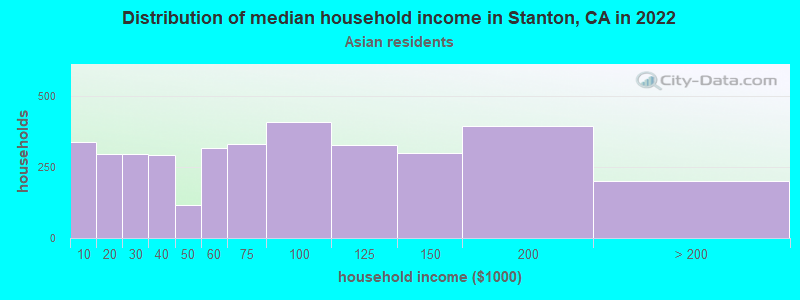
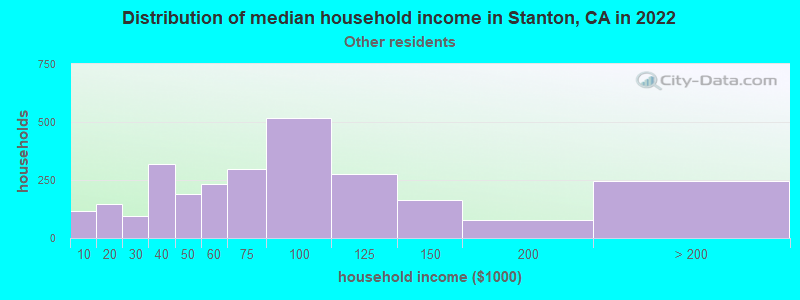
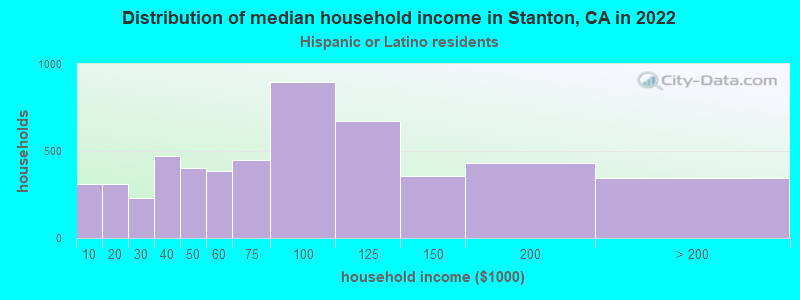
According to 2022 data, the most numerous races in Stanton, CA are Hispanic (18,729 residents), White alone (6,445 residents), and Asian alone (12,207 residents). 31.1% of Stanton residents speak English at home. 44.4% of Stanton, CA residents are foreign-born (23.1% born in Asia, 19.4% born in Latin America), which is 41.4% greater than the foreign-born rate of 26.0% across the entire state of California.
Race distribution in Stanton
2000 2022
15,816,790 46.7% White alone 10,966,556 32.4% Hispanic 3,648,860 10.8% Asian alone 2,181,926 6.4% Black alone 903,115 2.7% Two or more races 178,984 0.5% American Indian alone 103,736 0.3% Native Hawaiian and Other 71,681 0.2% Other race alone
15,732,184 40.3% Hispanic 13,160,426 33.7% White alone 5,957,867 15.3% Asian alone 2,025,218 5.2% Black alone 1,663,222 4.3% Two or more races 251,618 0.6% Other race alone 135,777 0.3% Native Hawaiian and Other 103,030 0.3% American Indian alone
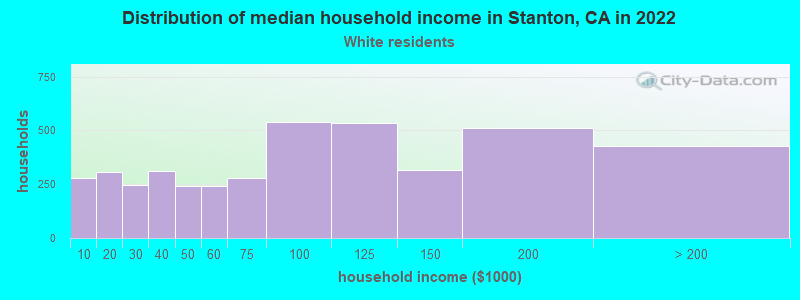
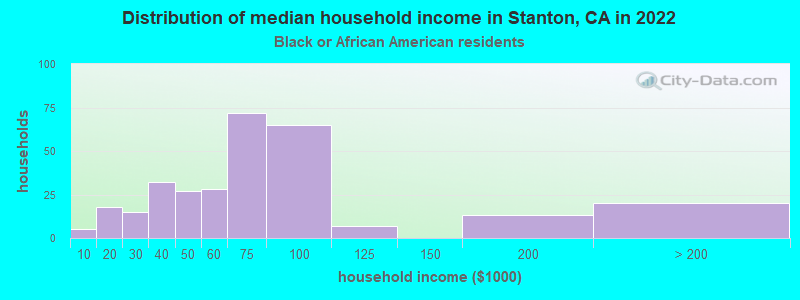
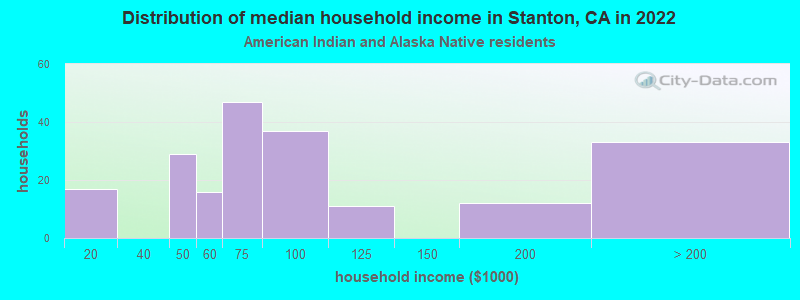
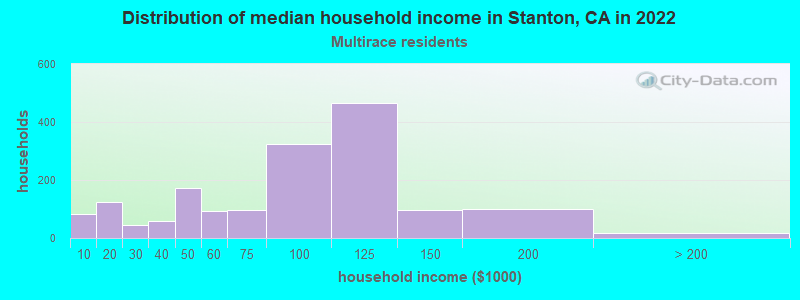
Income and house value in Stanton Median household income in 2022 $73,852 White non-Hispanic householders$48,152 Black householders$168,866 American Indian and Alaska Native householders$87,237 Asian householders$18,913 Native Hawaiian and other Pacific Islander householders$65,320 Some other race householders$50,892 Two or more races householders$66,726 Hispanic or Latino race householdersMedian 2022 house value $581,286 White Non-Hispanic householders$573,727 Black or African American householdersover $1,000,000 American Indian or Alaska Native householders $654,711 Asian householders$564,369 Some other race householders$639,234 Two or more races householders$571,928 Hispanic or Latino householders
Median age by race in Stanton
36.8 Median age for White residents36.4 37.0 41.2 Median age for Black or African American residents29.8 47.5 31.0 Median age for American Indian / Alaska Native residents29.9 33.6 43.3 Median age for Asian residents38.3 46.5 28.2 Median age for Native Hawaiian / Pacific Islander residents17.3 30.8 33.1 Median age for Other race residents32.1 34.2 26.7 Median age for Two or more races residents29.9 25.0 52.2 Median age for White alone residents49.1 54.5 29.4 Median age for Hispanic or Latino residents28.7 29.7
Owner/renter occupied households by race in Stanton
House owners and renters - White residents 2,633 51.8% Owner occupied2,448 48.2% Renter occupiedHouse owners and renters - Black or African American residents 57 27.4% Owner occupied151 72.6% Renter occupiedHouse owners and renters - American Indian / Alaska Native residents 50 49.7% Owner occupied51 50.3% Renter occupiedHouse owners and renters - Asian residents 2,209 59.0% Owner occupied1,536 41.0% Renter occupiedHouse owners and renters - Native Hawaiian / Pacific Islander residents 23 39.1% Owner occupied36 60.9% Renter occupiedHouse owners and renters - Other race residents 478 27.5% Owner occupied1,260 72.5% Renter occupiedHouse owners and renters - Two or more races residents 448 49.0% Owner occupied466 51.0% Renter occupiedHouse owners and renters - White alone residents 1,955 65.6% Owner occupied1,027 34.4% Renter occupiedHouse owners and renters - Hispanic or Latino residents 1,527 32.9% Owner occupied3,119 67.1% Renter occupied
Language usage in Stanton
English speakers - Total 31.1% of residents of Stanton speak English at home.
40.3% of residents speak Spanish at home 8,577 59.4% Speak English very well5,868 40.6% Speak English less than very well28.1% of residents speak other language at home 4,234 42.0% Speak English very well5,847 58.0% Speak English less than very well
English speakers - Born in the United States 84.9% of residents of Stanton speak English at home.
11.5% of residents speak Spanish at home 217 73.3% Speak English very well79 26.7% Speak English less than very well3.4% of residents speak other language at home 82 94.3% Speak English very well5 5.7% Speak English less than very well
English speakers - Native, born elsewhere 40.4% of residents of Stanton speak English at home.
48.4% of residents speak Spanish at home 167 77.3% Speak English very well49 22.7% Speak English less than very well11.7% of residents speak other language at home 25 48.1% Speak English very well27 51.9% Speak English less than very well
English speakers - Foreign-born 9.5% of residents of Stanton speak English at home.
41.4% of residents speak Spanish at home 2,000 29.0% Speak English very well4,904 71.0% Speak English less than very well48.6% of residents speak other language at home 2,654 32.8% Speak English very well5,449 67.2% Speak English less than very well
White (Caucasian) - Speak only English Native:
62.8% (6,051)Foreign-born:
10.9% (395)
White (Caucasian) - Speak another language Native:
31.7% (3,056)Foreign-born:
86.8% (3,135)
Black or African American - Speak only English Native:
97.1% (359)Foreign-born:
29.7% (22)
Black or African American - Speak another language Native:
2.8% (10)Foreign-born:
70.9% (51)
American Indian / Alaska Native - Speak another language Native:
90.0% (270)Foreign-born:
100.0% (234)
Asian - Speak only English Native:
34.7% (1,026)Foreign-born:
10.1% (875)
Asian - Speak another language Native:
64.2% (1,901)Foreign-born:
89.7% (7,749)
Native Hawaiian / Pacific Islander - Speak only English Native:
34.9% (38)Foreign-born:
100.0% (98)
Other race - Speak only English Native:
18.7% (730)Foreign-born:
3.2% (85)
Other race - Speak another language Native:
80.2% (3,136)Foreign-born:
95.8% (2,529)
Two or more races - Speak only English Native:
54.9% (1,573)Foreign-born:
3.6% (31)
Two or more races - Speak another language Native:
65.6% (1,880)Foreign-born:
95.4% (827)
White alone - Speak only English Native:
95.7% (4,907)Foreign-born:
31.4% (335)
White alone - Speak another language Native:
4.2% (214)Foreign-born:
68.7% (732)
Hispanic or Latino - Speak only English Native:
25.6% (2,647)Foreign-born:
3.0% (204)
Hispanic or Latino - Speak another language Native:
74.4% (7,700)Foreign-born:
96.0% (6,470)
Foreign-born residents in Stanton 17,094 residents are foreign born (23.1% Asia , 19.4% Latin America ).
This city:
44.4%California:
100.0%
Marital status for residents in Stanton Marital status - White (Caucasian) population 15 years and over
Males 38.5% Never married49.7% Now married1.2% Separated2.3% Widowed8.3% DivorcedFemales 36.8% Never married39.0% Now married3.4% Separated9.8% Widowed11.0% DivorcedWomen who gave birth in the past 12 months Now married:
75.3% (164)Unmarried:
24.7% (54)
Women who did not give birth in the past 12 months Now married:
43.0% (1,484)Unmarried:
57.0% (1,965)
Marital status - Black or African American population 15 years and over
Males 55.2% Never married37.6% Now married0.0% Separated1.2% Widowed6.1% DivorcedFemales 34.3% Never married25.6% Now married3.3% Separated8.3% Widowed28.5% DivorcedWomen who did not give birth in the past 12 months Now married:
39.3% (44)Unmarried:
60.7% (67)
Marital status - American Indian / Alaska Native population 15 years and over
Males 60.3% Never married31.7% Now married0.0% Separated0.0% Widowed8.0% DivorcedFemales 10.1% Never married57.6% Now married0.0% Separated0.0% Widowed32.3% DivorcedWomen who gave birth in the past 12 months Now married:
0.0% (0)Unmarried:
100.0% (27)
Women who did not give birth in the past 12 months Now married:
73.0% (36)Unmarried:
27.0% (13)
Marital status - Asian population 15 years and over
Males 42.9% Never married49.6% Now married0.9% Separated0.9% Widowed5.8% DivorcedFemales 26.4% Never married53.9% Now married3.2% Separated10.0% Widowed6.6% DivorcedWomen who gave birth in the past 12 months Now married:
81.6% (82)Unmarried:
18.4% (18)
Women who did not give birth in the past 12 months Now married:
55.7% (1,460)Unmarried:
44.3% (1,164)
Marital status - Native Hawaiian / Pacific Islander population 15 years and over
Males 0.0% Never married100.0% Now married0.0% Separated0.0% Widowed0.0% DivorcedFemales 30.8% Never married37.7% Now married31.5% Separated0.0% Widowed0.0% DivorcedWomen who did not give birth in the past 12 months Now married:
69.2% (105)Unmarried:
30.8% (47)
Marital status - Other race population 15 years and over
Males 53.2% Never married39.7% Now married1.8% Separated0.0% Widowed5.3% DivorcedFemales 56.1% Never married33.9% Now married0.6% Separated2.1% Widowed7.4% DivorcedWomen who gave birth in the past 12 months Now married:
100.0% (17)Unmarried:
0.0% (0)
Women who did not give birth in the past 12 months Now married:
30.0% (633)Unmarried:
70.0% (1,475)
Marital status - Two or more races population 15 years and over
Males 65.3% Never married21.3% Now married0.0% Separated4.3% Widowed9.1% DivorcedFemales 54.6% Never married24.1% Now married0.0% Separated5.7% Widowed15.6% DivorcedWomen who gave birth in the past 12 months Now married:
100.0% (96)Unmarried:
0.0% (0)
Women who did not give birth in the past 12 months Now married:
19.4% (163)Unmarried:
80.6% (677)
Marital status - White alone, not Hispanic / Latino population 15 years and over
Males 33.6% Never married50.5% Now married1.1% Separated2.7% Widowed12.1% DivorcedFemales 30.9% Never married34.4% Now married2.4% Separated14.8% Widowed17.5% DivorcedWomen who gave birth in the past 12 months Now married:
69.3% (62)Unmarried:
30.7% (28)
Women who did not give birth in the past 12 months Now married:
34.5% (400)Unmarried:
65.5% (759)
Marital status - Hispanic or Latino population 15 years and over
Males 46.8% Never married45.0% Now married1.4% Separated1.2% Widowed5.6% DivorcedFemales 46.2% Never married39.2% Now married2.9% Separated4.6% Widowed7.1% DivorcedWomen who gave birth in the past 12 months Now married:
80.0% (165)Unmarried:
20.0% (41)
Women who did not give birth in the past 12 months Now married:
40.3% (2,149)Unmarried:
59.7% (3,186)
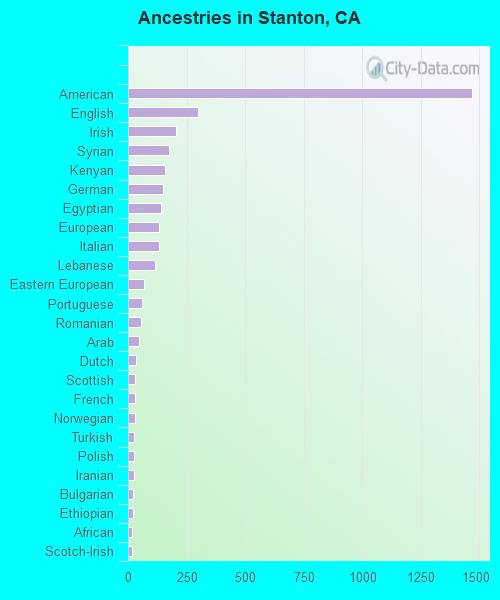
Ancestries in Stanton
1,132 4.5% American242 1.0% English232 0.9% German212 0.8% Syrian205 0.8% Italian179 0.7% Irish173 0.7% European150 0.6% Arab123 0.5% Lebanese76 0.3% French55 0.2% Scottish49 0.2% Portuguese37 0.1% Romanian35 0.1% Egyptian34 0.1% Scandinavian32 0.1% Polish31 0.1% Bulgarian30 0.1% French Canadian25 0.10% Scotch-Irish23 0.09% Dutch22 0.09% Norwegian20 0.08% British18 0.07% Ukrainian15 0.06% Iranian13 0.05% Canadian13 0.05% Ethiopian13 0.05% Welsh12 0.05% Lithuanian11 0.04% Australian10 0.04% Czechoslovakian10 0.04% Greek10 0.04% Russian9 0.04% Croatian8 0.03% Armenian8 0.03% Eastern European8 0.03% Yugoslavian6 0.02% African6 0.02% West Indian5 0.02% Austrian4 0.02% Swedish
Geographical mobility in Stanton Same house 1 year ago 13,445 91.6% White (Caucasian)348 77.8% Black or African American611 98.0% American Indian / Alaska Native11,204 92.2% Asian312 100.0% Native Hawaiian / Pacific Islander5,823 92.5% Other race3,302 84.5% Two or more races5,788 89.1% White alone, not Hispanic / Latino17,226 93.2% Hispanic or LatinoMoved within same county 895 6.1% White / Caucasian66 14.8% Black or African American625 5.1% Asian476 7.6% Other race164 4.2% Two or more races460 7.1% White alone, not Hispanic / Latino1,041 5.6% Hispanic or LatinoMoved within same state 211 1.4% White / Caucasian24 5.4% Black or African American338 2.8% Asian60 1.5% Two or more races92 1.4% White alone, not Hispanic / Latino168 0.9% Hispanic or LatinoMoved from different state 77 0.5% White / Caucasian67 0.6% Asian86 2.2% Two or more races70 1.1% White alone, not Hispanic / Latino74 0.4% Hispanic or LatinoMoved from abroad 54 0.4% White40 6.4% American Indian / Alaska Native37 0.3% Asian210 5.4% Two or more races80 1.2% White alone, not Hispanic / Latino21 0.1% Hispanic or Latino
Children Nativity (place of birth) in Stanton
Children under 6 years - Living with two parents Both parents native 596 98.8% Native7 1.2% Foreign-bornBoth parents foreign-born 702 94.8% Native39 5.2% Foreign-bornOne native, one foreign-born parent 560 100.0% NativeChildren under 6 years - Living with one parent Native parent 517 100.0% Native0 0.0% Foreign-bornForeign-born parent 326 89.5% Native38 10.5% Foreign-bornChildren 6 to 17 years - Living with two parents Both parents native 822 98.9% Native9 1.1% Foreign-bornBoth parents foreign-born 2,250 87.8% Native311 12.2% Foreign-bornOne native, one foreign-born parent 477 95.7% Native22 4.3% Foreign-bornChildren 6 to 17 years - Living with one parent Native parent 515 100.0% NativeForeign-born parent 1,429 53.8% Native1,229 46.2% Foreign-born
Grandparents responsible for own grandchildren in Stanton
Grandparents (30 to 59 years) White / Caucasian 60 25.8% Responsible for grandchildren172 74.2% Not responsible for grandchildrenBlack or African American 10 34.2% Responsible for grandchildren19 65.8% Not responsible for grandchildrenAmerican Indian / Alaska Native 41 100.0% Not responsible for grandchildrenAsian 8 7.1% Responsible for grandchildren112 92.9% Not responsible for grandchildrenOther race 45 35.7% Responsible for grandchildren81 64.3% Not responsible for grandchildrenTwo or more races 39 100.0% Not responsible for grandchildrenWhite alone, not Hispanic / Latino 42 100.0% Not responsible for grandchildrenHispanic or Latino 127 28.9% Responsible for grandchildren313 71.1% Not responsible for grandchildrenGrandparents (60 years and over) White / Caucasian 15 4.5% Responsible for grandchildren330 95.5% Not responsible for grandchildrenAmerican Indian / Alaska Native 55 100.0% Not responsible for grandchildrenAsian 13 5.1% Responsible for grandchildren237 94.9% Not responsible for grandchildrenOther race 45 26.3% Responsible for grandchildren125 73.7% Not responsible for grandchildrenTwo or more races 51 100.0% Not responsible for grandchildrenWhite alone, not Hispanic / Latino 19 24.2% Responsible for grandchildren59 75.8% Not responsible for grandchildrenHispanic or Latino 30 5.4% Responsible for grandchildren515 94.6% Not responsible for grandchildren