Races in Statham, Georgia (GA) Detailed Stats
Data:
Races - White alone (%)
Races - White alone (% change since 2000)
Races - Black alone (%)
Races - Black alone (% change since 2000)
Races - American Indian alone (%)
Races - American Indian alone (% change since 2000)
Races - Asian alone (%)
Races - Asian alone (% change since 2000)
Races - Hispanic (%)
Races - Hispanic (% change since 2000)
Races - Native Hawaiian and Other Pacific Islander alone (%)
Races - Native Hawaiian and Other Pacific Islander alone (% change since 2000)
Races - Two or more races(%)
Races - Two or more races(% change since 2000)
Races - Other race alone (%)
Races - Other race alone (% change since 2000)
Racial diversity
Place of birth - Born in state of residence (%)
Place of birth - Born in state of residence (%) - White
Place of birth - Born in state of residence (%) - Black or African American
Place of birth - Born in state of residence (%) - Asian
Place of birth - Born in state of residence (%) - Hispanic or Latino
Place of birth - Born in state of residence (%) - American Indian and Alaska Native
Place of birth - Born in state of residence (%) - Multirace
Place of birth - Born in state of residence (%) - Other Race
Place of birth - Born in other state (%)
Place of birth - Born in other state (%) - White
Place of birth - Born in other state (%) - Black or African American
Place of birth - Born in other state (%) - Asian
Place of birth - Born in other state (%) - Hispanic or Latino
Place of birth - Born in other state (%) - American Indian and Alaska Native
Place of birth - Born in other state (%) - Multirace
Place of birth - Born in other state (%) - Other Race
Place of birth - Native, outside of US (%)
Place of birth - Native, outside of US (%) - White
Place of birth - Native, outside of US (%) - Black or African American
Place of birth - Native, outside of US (%) - Asian
Place of birth - Native, outside of US (%) - Hispanic or Latino
Place of birth - Native, outside of US (%) - American Indian and Alaska Native
Place of birth - Native, outside of US (%) - Multirace
Place of birth - Native, outside of US (%) - Other Race
Place of birth - Foreign born (%)
Place of birth - Foreign born (%) - White
Place of birth - Foreign born (%) - Black or African American
Place of birth - Foreign born (%) - Asian
Place of birth - Foreign born (%) - Hispanic or Latino
Place of birth - Foreign born (%) - American Indian and Alaska Native
Place of birth - Foreign born (%) - Multirace
Place of birth - Foreign born (%) - Other Race
Residents speaking English at home (%)
Residents speaking English at home - Born in the United States (%)
Residents speaking English at home - Native, born elsewhere (%)
Residents speaking English at home - Foreign born (%)
Residents speaking Spanish at home (%)
Residents speaking Spanish at home - Born in the United States (%)
Residents speaking Spanish at home - Native, born elsewhere (%)
Residents speaking Spanish at home - Foreign born (%)
Residents speaking other language at home (%)
Residents speaking other language at home - Born in the United States (%)
Residents speaking other language at home - Native, born elsewhere (%)
Residents speaking other language at home - Foreign born (%)
Marital status - Never married (%)
Marital status - Now married (%)
Marital status - Separated (%)
Marital status - Widowed (%)
Marital status - Divorced (%)
Ancestries Reported - Arab (%)
Ancestries Reported - Czech (%)
Ancestries Reported - Danish (%)
Ancestries Reported - Dutch (%)
Ancestries Reported - English (%)
Ancestries Reported - French (%)
Ancestries Reported - French Canadian (%)
Ancestries Reported - German (%)
Ancestries Reported - Greek (%)
Ancestries Reported - Hungarian (%)
Ancestries Reported - Irish (%)
Ancestries Reported - Italian (%)
Ancestries Reported - Lithuanian (%)
Ancestries Reported - Norwegian (%)
Ancestries Reported - Polish (%)
Ancestries Reported - Portuguese (%)
Ancestries Reported - Russian (%)
Ancestries Reported - Scotch-Irish (%)
Ancestries Reported - Scottish (%)
Ancestries Reported - Slovak (%)
Ancestries Reported - Subsaharan African (%)
Ancestries Reported - Swedish (%)
Ancestries Reported - Swiss (%)
Ancestries Reported - Ukrainian (%)
Ancestries Reported - United States (%)
Ancestries Reported - Welsh (%)
Ancestries Reported - West Indian (%)
Ancestries Reported - Other (%)
Geographical mobility - Same house 1 year ago (%)
Geographical mobility - Same house 1 year ago (%) - White
Geographical mobility - Same house 1 year ago (%) - Black or African American
Geographical mobility - Same house 1 year ago (%) - Asian
Geographical mobility - Same house 1 year ago (%) - Hispanic or Latino
Geographical mobility - Same house 1 year ago (%) - American Indian and Alaska Native
Geographical mobility - Same house 1 year ago (%) - Multirace
Geographical mobility - Same house 1 year ago (%) - Other Race
Geographical mobility - Moved within same county (%)
Geographical mobility - Moved within same county (%) - White
Geographical mobility - Moved within same county (%) - Black or African American
Geographical mobility - Moved within same county (%) - Asian
Geographical mobility - Moved within same county (%) - Hispanic or Latino
Geographical mobility - Moved within same county (%) - American Indian and Alaska Native
Geographical mobility - Moved within same county (%) - Multirace
Geographical mobility - Moved within same county (%) - Other Race
Geographical mobility - Moved from different county within same state (%)
Geographical mobility - Moved from different county within same state (%) - White
Geographical mobility - Moved from different county within same state (%) - Black or African American
Geographical mobility - Moved from different county within same state (%) - Asian
Geographical mobility - Moved from different county within same state (%) - Hispanic or Latino
Geographical mobility - Moved from different county within same state (%) - American Indian and Alaska Native
Geographical mobility - Moved from different county within same state (%) - Multirace
Geographical mobility - Moved from different county within same state (%) - Other Race
Geographical mobility - Moved from different state (%)
Geographical mobility - Moved from different state (%) - White
Geographical mobility - Moved from different state (%) - Black or African American
Geographical mobility - Moved from different state (%) - Asian
Geographical mobility - Moved from different state (%) - Hispanic or Latino
Geographical mobility - Moved from different state (%) - American Indian and Alaska Native
Geographical mobility - Moved from different state (%) - Multirace
Geographical mobility - Moved from different state (%) - Other Race
Geographical mobility - Moved from abroad (%)
Geographical mobility - Moved from abroad (%) - White
Geographical mobility - Moved from abroad (%) - Black or African American
Geographical mobility - Moved from abroad (%) - Asian
Geographical mobility - Moved from abroad (%) - Hispanic or Latino
Geographical mobility - Moved from abroad (%) - American Indian and Alaska Native
Geographical mobility - Moved from abroad (%) - Multirace
Geographical mobility - Moved from abroad (%) - Other Race
Place of birth for the foreign-born population - Ireland (%)
Place of birth for the foreign-born population - Denmark (%)
Place of birth for the foreign-born population - Norway (%)
Place of birth for the foreign-born population - Sweden (%)
Place of birth for the foreign-born population - United Kingdom (%)
Place of birth for the foreign-born population - England (%)
Place of birth for the foreign-born population - Scotland (%)
Place of birth for the foreign-born population - Other Northern Europe (%)
Place of birth for the foreign-born population - Austria (%)
Place of birth for the foreign-born population - Belgium (%)
Place of birth for the foreign-born population - France (%)
Place of birth for the foreign-born population - Germany (%)
Place of birth for the foreign-born population - Netherlands (%)
Place of birth for the foreign-born population - Switzerland (%)
Place of birth for the foreign-born population - Other Western Europe (%)
Place of birth for the foreign-born population - Greece (%)
Place of birth for the foreign-born population - Italy (%)
Place of birth for the foreign-born population - Portugal (%)
Place of birth for the foreign-born population - Spain (%)
Place of birth for the foreign-born population - Other Southern Europe (%)
Place of birth for the foreign-born population - Albania (%)
Place of birth for the foreign-born population - Belarus (%)
Place of birth for the foreign-born population - Bosnia and Herzegovina (%)
Place of birth for the foreign-born population - Bulgaria (%)
Place of birth for the foreign-born population - Croatia (%)
Place of birth for the foreign-born population - Czechoslovakia (%)
Place of birth for the foreign-born population - Hungary (%)
Place of birth for the foreign-born population - Latvia (%)
Place of birth for the foreign-born population - Lithuania (%)
Place of birth for the foreign-born population - North Macedonia (Macedonia) (%)
Place of birth for the foreign-born population - Moldova (%)
Place of birth for the foreign-born population - Poland (%)
Place of birth for the foreign-born population - Romania (%)
Place of birth for the foreign-born population - Russia (%)
Place of birth for the foreign-born population - Serbia (%)
Place of birth for the foreign-born population - Ukraine (%)
Place of birth for the foreign-born population - Other Eastern Europe (%)
Place of birth for the foreign-born population - China (%)
Place of birth for the foreign-born population - Hong Kong (%)
Place of birth for the foreign-born population - Taiwan (%)
Place of birth for the foreign-born population - Japan (%)
Place of birth for the foreign-born population - Korea (%)
Place of birth for the foreign-born population - Other Eastern Asia (%)
Place of birth for the foreign-born population - Afghanistan (%)
Place of birth for the foreign-born population - Bangladesh (%)
Place of birth for the foreign-born population - India (%)
Place of birth for the foreign-born population - Iran (%)
Place of birth for the foreign-born population - Kazakhstan (%)
Place of birth for the foreign-born population - Nepal (%)
Place of birth for the foreign-born population - Pakistan (%)
Place of birth for the foreign-born population - Sri Lanka (%)
Place of birth for the foreign-born population - Uzbekistan (%)
Place of birth for the foreign-born population - Other South Central Asia (%)
Place of birth for the foreign-born population - Burma (%)
Place of birth for the foreign-born population - Cambodia (%)
Place of birth for the foreign-born population - Indonesia (%)
Place of birth for the foreign-born population - Laos (%)
Place of birth for the foreign-born population - Malaysia (%)
Place of birth for the foreign-born population - Philippines (%)
Place of birth for the foreign-born population - Singapore (%)
Place of birth for the foreign-born population - Thailand (%)
Place of birth for the foreign-born population - Vietnam (%)
Place of birth for the foreign-born population - Other South Eastern Asia (%)
Place of birth for the foreign-born population - Armenia (%)
Place of birth for the foreign-born population - Iraq (%)
Place of birth for the foreign-born population - Israel (%)
Place of birth for the foreign-born population - Jordan (%)
Place of birth for the foreign-born population - Kuwait (%)
Place of birth for the foreign-born population - Lebanon (%)
Place of birth for the foreign-born population - Saudi Arabia (%)
Place of birth for the foreign-born population - Syria (%)
Place of birth for the foreign-born population - Turkey (%)
Place of birth for the foreign-born population - Yemen (%)
Place of birth for the foreign-born population - Other Western Asia (%)
Place of birth for the foreign-born population - Eritrea (%)
Place of birth for the foreign-born population - Ethiopia (%)
Place of birth for the foreign-born population - Kenya (%)
Place of birth for the foreign-born population - Somalia (%)
Place of birth for the foreign-born population - Uganda (%)
Place of birth for the foreign-born population - Zimbabwe (%)
Place of birth for the foreign-born population - Other Eastern Africa (%)
Place of birth for the foreign-born population - Cameroon (%)
Place of birth for the foreign-born population - Congo (%)
Place of birth for the foreign-born population - Democratic Republic of Congo (Zaire) (%)
Place of birth for the foreign-born population - Other Middle Africa (%)
Place of birth for the foreign-born population - Egypt (%)
Place of birth for the foreign-born population - Morocco (%)
Place of birth for the foreign-born population - Sudan (%)
Place of birth for the foreign-born population - Other Northern Africa (%)
Place of birth for the foreign-born population - South Africa (%)
Place of birth for the foreign-born population - Other Southern Africa (%)
Place of birth for the foreign-born population - Cabo Verde (%)
Place of birth for the foreign-born population - Ghana (%)
Place of birth for the foreign-born population - Liberia (%)
Place of birth for the foreign-born population - Nigeria (%)
Place of birth for the foreign-born population - Senegal (%)
Place of birth for the foreign-born population - Sierra Leone (%)
Place of birth for the foreign-born population - Other Western Africa (%)
Place of birth for the foreign-born population - Australia (%)
Place of birth for the foreign-born population - New Zealand (%)
Place of birth for the foreign-born population - Fiji (%)
Place of birth for the foreign-born population - Micronesia (%)
Place of birth for the foreign-born population - Bahamas (%)
Place of birth for the foreign-born population - Barbados (%)
Place of birth for the foreign-born population - Cuba (%)
Place of birth for the foreign-born population - Dominica (%)
Place of birth for the foreign-born population - Dominican Republic (%)
Place of birth for the foreign-born population - Grenada (%)
Place of birth for the foreign-born population - Haiti (%)
Place of birth for the foreign-born population - Jamaica (%)
Place of birth for the foreign-born population - St. Vincent and the Grenadines (%)
Place of birth for the foreign-born population - Trinidad and Tobago (%)
Place of birth for the foreign-born population - West Indies (%)
Place of birth for the foreign-born population - Other Caribbean (%)
Place of birth for the foreign-born population - Belize (%)
Place of birth for the foreign-born population - Costa Rica (%)
Place of birth for the foreign-born population - El Salvador (%)
Place of birth for the foreign-born population - Guatemala (%)
Place of birth for the foreign-born population - Honduras (%)
Place of birth for the foreign-born population - Mexico (%)
Place of birth for the foreign-born population - Nicaragua (%)
Place of birth for the foreign-born population - Panama (%)
Place of birth for the foreign-born population - Other Central America (%)
Place of birth for the foreign-born population - Argentina (%)
Place of birth for the foreign-born population - Bolivia (%)
Place of birth for the foreign-born population - Brazil (%)
Place of birth for the foreign-born population - Chile (%)
Place of birth for the foreign-born population - Colombia (%)
Place of birth for the foreign-born population - Ecuador (%)
Place of birth for the foreign-born population - Guyana (%)
Place of birth for the foreign-born population - Peru (%)
Place of birth for the foreign-born population - Uruguay (%)
Place of birth for the foreign-born population - Venezuela (%)
Place of birth for the foreign-born population - Other South America (%)
Place of birth for the foreign-born population - Canada (%)
Place of birth for the foreign-born population - Other Northern America (%)
Place of birth for the foreign-born population - Other (%)
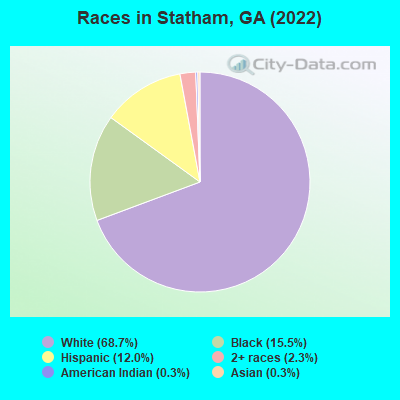
According to 2022 data, the most numerous races in Statham, GA are White alone (1,979 residents), Black alone (447 residents), and Hispanic (345 residents). 92.9% of Statham residents speak English at home. 4.9% of Statham, GA residents are foreign-born (3.2% born in Latin America, 1.1% born in Asia, 0.7% born in Europe), which is 102.2% less than the foreign-born rate of 10.0% across the entire state of Georgia.
Race distribution in Statham
2000 2022
5,128,661 62.6% White alone 2,331,465 28.5% Black alone 435,227 5.3% Hispanic 171,513 2.1% Asian alone 87,364 1.1% Two or more races 17,670 0.2% American Indian alone 11,275 0.1% Other race alone 3,278 0.04% Native Hawaiian and Other
5,415,657 49.6% White alone 3,349,240 30.7% Black alone 1,132,604 10.4% Hispanic 479,156 4.4% Asian alone 462,923 4.2% Two or more races 54,416 0.5% Other race alone 11,923 0.1% American Indian alone 6,957 0.06% Native Hawaiian and Other
Income and house value in Statham Median household income in 2022 $69,363 White non-Hispanic householders$56,559 Black householders$68,146 Some other race householders$44,210 Two or more races householders$51,026 Hispanic or Latino race householdersMedian 2022 house value $293,048 White Non-Hispanic householders$229,104 Black or African American householders$441,821 Two or more races householders$305,258 Hispanic or Latino householders
Median age by race in Statham
34.2 Median age for White residents32.9 36.3 33.0 Median age for Black or African American residents27.3 35.8 -572,438,162.0 Median age for American Indian / Alaska Native residents-597,222,221.6 -562,499,999.4 71.6 Median age for Asian residents-467,532,467.1 -758,698,091.3 -657,243,815.6 Median age for Native Hawaiian / Pacific Islander residents-693,227,090.9 -666,666,666.0 43.2 Median age for Other race residents29.9 43.9 44.0 Median age for Two or more races residents42.8 38.9 35.9 Median age for White alone residents34.0 40.3 24.4 Median age for Hispanic or Latino residents19.0 27.9
Owner/renter occupied households by race in Statham
House owners and renters - White residents 569 78.9% Owner occupied152 21.1% Renter occupiedHouse owners and renters - Black or African American residents 134 75.4% Owner occupied44 24.6% Renter occupiedHouse owners and renters - Asian residents 3 100.0% Owner occupiedHouse owners and renters - Other race residents 38 85.6% Owner occupied6 14.4% Renter occupiedHouse owners and renters - Two or more races residents 43 61.9% Owner occupied27 38.1% Renter occupiedHouse owners and renters - White alone residents 554 77.8% Owner occupied159 22.2% Renter occupiedHouse owners and renters - Hispanic or Latino residents 86 93.5% Owner occupied6 6.5% Renter occupied
Language usage in Statham
English speakers - Total 92.9% of residents of Statham speak English at home.
7.1% of residents speak Spanish at home 87 43.3% Speak English very well114 56.7% Speak English less than very well0.8% of residents speak other language at home 2 9.1% Speak English very well20 90.9% Speak English less than very well
English speakers - Born in the United States 94.7% of residents of Statham speak English at home.
6.4% of residents speak Spanish at home 55 87.3% Speak English very well8 12.7% Speak English less than very well
All residents speak only English at home
English speakers - Foreign-born 14.2% of residents of Statham speak English at home.
77.2% of residents speak Spanish at home 25 20.0% Speak English very well100 80.0% Speak English less than very well14.2% of residents speak other language at home 2 8.7% Speak English very well21 91.3% Speak English less than very well
White (Caucasian) - Speak only English Native:
99.6% (1,989)Foreign-born:
100.0% (13)
White (Caucasian) - Speak another language Native:
1.4% (28)Foreign-born:
20.6% (3)
Other race - Speak another language Native:
74.1% (61)Foreign-born:
100.0% (72)
White alone - Speak only English Native:
99.6% (1,869)Foreign-born:
100.0% (17)
Hispanic or Latino - Speak only English Native:
86.0% (210)Foreign-born:
2.9% (3)
Hispanic or Latino - Speak another language Native:
31.1% (76)Foreign-born:
100.0% (111)
Foreign-born residents in Statham 148 residents are foreign born (3.2% Latin America , 1.1% Asia , 0.7% Europe ).
This city:
4.9%Georgia:
10.4%
Marital status for residents in Statham Marital status - White (Caucasian) population 15 years and over
Males 29.9% Never married55.4% Now married2.9% Separated2.6% Widowed9.2% DivorcedFemales 31.1% Never married48.7% Now married2.3% Separated11.4% Widowed6.5% DivorcedWomen who gave birth in the past 12 months Now married:
38.9% (7)Unmarried:
61.1% (11)
Women who did not give birth in the past 12 months Now married:
46.6% (264)Unmarried:
53.4% (302)
Marital status - Black or African American population 15 years and over
Males 75.2% Never married24.8% Now married0.0% Separated0.0% Widowed0.0% DivorcedFemales 57.1% Never married14.8% Now married0.0% Separated11.6% Widowed16.4% DivorcedWomen who gave birth in the past 12 months Now married:
0.0% (0)Unmarried:
100.0% (25)
Women who did not give birth in the past 12 months Now married:
19.8% (22)Unmarried:
80.2% (90)
Marital status - Asian population 15 years and over
Males 0.0% Never married100.0% Now married0.0% Separated0.0% Widowed0.0% DivorcedFemales 0.0% Never married100.0% Now married0.0% Separated0.0% Widowed0.0% DivorcedMarital status - Other race population 15 years and over
Males 42.5% Never married0.0% Now married0.0% Separated0.0% Widowed57.5% DivorcedFemales 41.5% Never married31.7% Now married0.0% Separated0.0% Widowed26.8% DivorcedWomen who did not give birth in the past 12 months Now married:
38.2% (27)Unmarried:
61.8% (44)
Marital status - Two or more races population 15 years and over
Males 44.4% Never married37.0% Now married0.0% Separated0.0% Widowed18.5% DivorcedFemales 61.1% Never married16.7% Now married18.9% Separated3.3% Widowed0.0% DivorcedWomen who did not give birth in the past 12 months Now married:
15.4% (15)Unmarried:
84.6% (81)
Marital status - White alone, not Hispanic / Latino population 15 years and over
Males 29.5% Never married55.2% Now married3.0% Separated2.7% Widowed9.6% DivorcedFemales 30.6% Never married48.4% Now married2.4% Separated11.9% Widowed6.7% DivorcedWomen who gave birth in the past 12 months Now married:
38.9% (7)Unmarried:
61.1% (11)
Women who did not give birth in the past 12 months Now married:
46.0% (258)Unmarried:
54.0% (302)
Marital status - Hispanic or Latino population 15 years and over
Males 42.0% Never married31.8% Now married0.0% Separated0.0% Widowed26.1% DivorcedFemales 55.7% Never married24.7% Now married10.8% Separated1.9% Widowed7.0% DivorcedWomen who did not give birth in the past 12 months Now married:
29.8% (45)Unmarried:
70.2% (107)
Ancestries in Statham
439 29.4% English298 19.9% German157 10.5% American96 6.4% European28 1.9% Irish26 1.7% French17 1.1% Scottish16 1.1% Polish10 0.7% Swedish9 0.6% Italian5 0.3% Hungarian5 0.3% Romanian2 0.1% Scotch-Irish
Children Nativity (place of birth) in Statham
Children under 6 years - Living with two parents Both parents native 68 100.0% NativeOne native, one foreign-born parent 2 100.0% NativeChildren under 6 years - Living with one parent Native parent 38 100.0% NativeForeign-born parent 6 100.0% NativeChildren 6 to 17 years - Living with two parents Both parents native 223 100.0% NativeBoth parents foreign-born 4 100.0% NativeOne native, one foreign-born parent 3 100.0% NativeChildren 6 to 17 years - Living with one parent Native parent 234 100.0% NativeForeign-born parent 35 50.3% Native35 49.7% Foreign-born
Grandparents responsible for own grandchildren in Statham
Grandparents (30 to 59 years) White / Caucasian 9 100.0% Not responsible for grandchildrenTwo or more races 5 100.0% Not responsible for grandchildrenWhite alone, not Hispanic / Latino 9 100.0% Not responsible for grandchildrenGrandparents (60 years and over) White / Caucasian 7 8.7% Responsible for grandchildren71 91.3% Not responsible for grandchildrenWhite alone, not Hispanic / Latino 7 8.4% Responsible for grandchildren75 91.6% Not responsible for grandchildren