Races in Taft, California (CA) Detailed Stats
Ancestries, Foreign-born residents, place of birth
Settings
X


Recent posts about races in Taft, California on our local forum with over 2,400,000 registered users:

Latest news about races in Taft, CA collected exclusively by city-data.com from local newspapers, TV, and radio stations
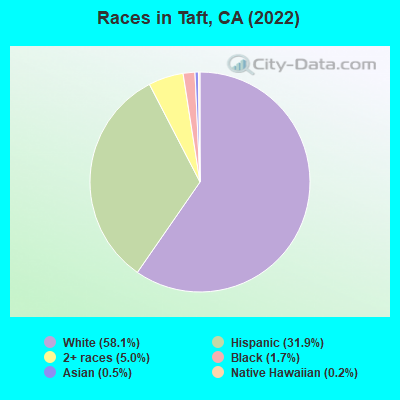
According to 2022 data, the most numerous races in Taft, CA are Hispanic (3,445 residents), White alone (4,893 residents), and Asian alone (284 residents). 68.5% of Taft residents speak English at home. 17.3% of Taft, CA residents are foreign-born (14.6% born in Latin America, 1.9% born in Asia), which is 50.7% less than the foreign-born rate of 26.0% across the entire state of California.
Race distribution in Taft
2000
2022

- 5,06179.1%White alone
- 99515.5%Hispanic
- 1171.8%Black alone
- 831.3%Two or more races
- 671.0%Asian alone
- 470.7%American Indian alone
- 270.4%Native Hawaiian and Other
Pacific Islander alone - 30.05%Other race alone

-
- 4,89351.8%White alone
- 3,44536.5%Hispanic
- 5265.6%Two or more races
- 2843.0%Asian alone
- 1151.2%Black alone
- 40.04%Native Hawaiian and Other
Pacific Islander alone
2000
2022
-
- 15,816,79046.7%White alone
- 10,966,55632.4%Hispanic
- 3,648,86010.8%Asian alone
- 2,181,9266.4%Black alone
- 903,1152.7%Two or more races
- 178,9840.5%American Indian alone
- 103,7360.3%Native Hawaiian and Other
Pacific Islander alone - 71,6810.2%Other race alone

-
- 15,732,18440.3%Hispanic
- 13,160,42633.7%White alone
- 5,957,86715.3%Asian alone
- 2,025,2185.2%Black alone
- 1,663,2224.3%Two or more races
- 251,6180.6%Other race alone
- 135,7770.3%Native Hawaiian and Other
Pacific Islander alone - 103,0300.3%American Indian alone

Income and house value in Taft
- Median household income in 2022
- $64,766White non-Hispanic householders
- $56,461Black householders
- over $200,000American Indian and Alaska Native householders
- $31,648Asian householders
- $62,912Some other race householders
- $53,442Two or more races householders
- $46,659Hispanic or Latino race householders
- Median 2022 house value
- $314,578White Non-Hispanic householders
- $233,954Black or African American householders
- $305,940American Indian or Alaska Native householders
- $320,337Asian householders
- $305,940Some other race householders
- $411,399Two or more races householders
- $237,913Hispanic or Latino householders
Household income for White non-Hispanic householders

Household income for Black householders

Household income for Asian householders

Household income for Some other race householders

Household income for Two or more races householders

Household income for Hispanic or Latino race householders

Median age by race in Taft
- 37.3Median age for White residents
- 38.5Males
- 34.6Females
- 38.7Median age for Black or African American residents
- 61.7Median age for American Indian / Alaska Native residents
- 36.7Median age for Asian residents
- 46.2Males
- 20.2Females
- 22.3Median age for Native Hawaiian / Pacific Islander residents
- 28.5Median age for Other race residents
- 43.0Median age for Two or more races residents
- 47.7Males
- 35.7Females
- 46.0Median age for White alone residents
- 45.5Males
- 46.3Females
- 24.1Median age for Hispanic or Latino residents
- 29.5Males
- 14.2Females
Owner/renter occupied households by race in Taft
- House owners and renters - White residents
- 1,41760.1%Owner occupied
- 94139.9%Renter occupied
- House owners and renters - Black or African American residents
- 1637.0%Owner occupied
- 2863.0%Renter occupied
- House owners and renters - Asian residents
- 2748.9%Owner occupied
- 2851.1%Renter occupied
- House owners and renters - Other race residents
- 7527.4%Owner occupied
- 19972.6%Renter occupied
- House owners and renters - Two or more races residents
- 76690.1%Owner occupied
- 849.9%Renter occupied
- House owners and renters - White alone residents
- 1,27257.8%Owner occupied
- 93042.2%Renter occupied
- House owners and renters - Hispanic or Latino residents
- 41260.6%Owner occupied
- 26839.4%Renter occupied
Language usage in Taft
- English speakers - Total
- 68.5% of residents of Taft speak English at home.
- 28.5% of residents speak Spanish at home
- 1,39756.5%Speak English very well
- 1,07743.5%Speak English less than very well
- 2.8% of residents speak other language at home
- 14659.3%Speak English very well
- 10040.7%Speak English less than very well
- English speakers - Born in the United States
- 83.9% of residents of Taft speak English at home.
- 15.6% of residents speak Spanish at home
- 235100.0%Speak English very well
- 0.5% of residents speak other language at home
- 7100.0%Speak English very well
- English speakers - Native, born elsewhere
- 77.4% of residents of Taft speak English at home.
- 19.4% of residents speak Spanish at home
- 633.3%Speak English very well
- 1266.7%Speak English less than very well
- 2.2% of residents speak other language at home
- 2100.0%Speak English very well
- English speakers - Foreign-born
- 7.3% of residents of Taft speak English at home.
- 77.2% of residents speak Spanish at home
- 29824.0%Speak English very well
- 94376.0%Speak English less than very well
- 12.9% of residents speak other language at home
- 11856.7%Speak English very well
- 9043.3%Speak English less than very well
White (Caucasian) - Speak only English
| Native: | 85.5% (4,598) |
| Foreign-born: | 8.7% (59) |
White (Caucasian) - Speak another language
| Native: | 14.5% (778) |
| Foreign-born: | 88.4% (594) |
Asian - Speak only English
| Native: | 41.2% (18) |
| Foreign-born: | 4.7% (8) |
Asian - Speak another language
| Native: | 55.0% (24) |
| Foreign-born: | 93.4% (153) |
Two or more races - Speak only English
| Native: | 70.2% (902) |
| Foreign-born: | 15.3% (173) |
Two or more races - Speak another language
| Native: | 13.4% (172) |
| Foreign-born: | 80.9% (916) |
White alone - Speak only English
| Native: | 98.5% (4,280) |
| Foreign-born: | 32.2% (34) |
White alone - Speak another language
| Native: | 1.3% (58) |
| Foreign-born: | 67.2% (71) |
Hispanic or Latino - Speak only English
| Native: | 34.5% (670) |
| Foreign-born: | 5.7% (74) |
Hispanic or Latino - Speak another language
| Native: | 64.7% (1,258) |
| Foreign-born: | 94.3% (1,222) |
Foreign-born residents in Taft
1,643 residents are foreign born (14.6% Latin America, 1.9% Asia).
| This city: | 17.3% |
| California: | 100.0% |


Marital status for residents in Taft
Marital status - White (Caucasian) population 15 years and over
- Males
- 43.1%Never married
- 38.5%Now married
- 2.0%Separated
- 3.2%Widowed
- 13.2%Divorced
- Females
- 23.6%Never married
- 42.8%Now married
- 4.6%Separated
- 19.2%Widowed
- 9.9%Divorced
Women who gave birth in the past 12 months
| Now married: | 21.0% (19) |
| Unmarried: | 79.0% (72) |
Women who did not give birth in the past 12 months
| Now married: | 49.3% (449) |
| Unmarried: | 50.7% (462) |
Marital status - Black or African American population 15 years and over
- Males
- 26.1%Never married
- 29.0%Now married
- 0.0%Separated
- 0.0%Widowed
- 44.9%Divorced
- Females
- 100.0%Never married
- 0.0%Now married
- 0.0%Separated
- 0.0%Widowed
- 0.0%Divorced
Women who did not give birth in the past 12 months
| Now married: | 0.0% (0) |
| Unmarried: | 100.0% (48) |
Marital status - Asian population 15 years and over
- Males
- 29.9%Never married
- 47.6%Now married
- 0.0%Separated
- 0.0%Widowed
- 22.4%Divorced
- Females
- 40.4%Never married
- 59.6%Now married
- 0.0%Separated
- 0.0%Widowed
- 0.0%Divorced
Women who gave birth in the past 12 months
| Now married: | 100.0% (33) |
| Unmarried: | 0.0% (0) |
Women who did not give birth in the past 12 months
| Now married: | 0.0% (0) |
| Unmarried: | 100.0% (22) |
Marital status - Other race population 15 years and over
- Males
- 87.4%Never married
- 2.9%Now married
- 9.7%Separated
- 0.0%Widowed
- 0.0%Divorced
- Females
- 0.0%Never married
- 0.0%Now married
- 100.0%Separated
- 0.0%Widowed
- 0.0%Divorced
Women who did not give birth in the past 12 months
| Now married: | 100.0% (19) |
| Unmarried: | 0.0% (0) |
Marital status - Two or more races population 15 years and over
- Males
- 46.4%Never married
- 15.8%Now married
- 2.8%Separated
- 1.3%Widowed
- 33.8%Divorced
- Females
- 15.6%Never married
- 35.4%Now married
- 0.0%Separated
- 22.9%Widowed
- 26.0%Divorced
Women who did not give birth in the past 12 months
| Now married: | 45.9% (117) |
| Unmarried: | 54.1% (138) |
Marital status - White alone, not Hispanic / Latino population 15 years and over
- Males
- 36.9%Never married
- 37.2%Now married
- 2.1%Separated
- 4.6%Widowed
- 19.2%Divorced
- Females
- 18.6%Never married
- 44.8%Now married
- 5.7%Separated
- 20.1%Widowed
- 10.8%Divorced
Women who gave birth in the past 12 months
| Now married: | 64.1% (22) |
| Unmarried: | 35.9% (13) |
Women who did not give birth in the past 12 months
| Now married: | 52.9% (396) |
| Unmarried: | 47.1% (353) |
Marital status - Hispanic or Latino population 15 years and over
- Males
- 56.6%Never married
- 36.9%Now married
- 3.4%Separated
- 0.4%Widowed
- 2.8%Divorced
- Females
- 41.2%Never married
- 31.8%Now married
- 2.5%Separated
- 14.2%Widowed
- 10.3%Divorced
Women who gave birth in the past 12 months
| Now married: | 0.0% (0) |
| Unmarried: | 100.0% (85) |
Women who did not give birth in the past 12 months
| Now married: | 40.3% (167) |
| Unmarried: | 59.7% (247) |
Ancestries in Taft

- 3636.8%Irish
- 3266.1%American
- 2083.9%English
- 2023.8%European
- 1813.4%German
- 1242.3%Scottish
- 490.9%Italian
- 470.9%Scotch-Irish
- 300.6%Swiss
- 200.4%Eastern European
- 170.3%Portuguese
- 170.3%Swedish
- 90.2%Armenian
- 70.1%Turkish
- 60.1%Lebanese
- 60.1%New Zealander
- 40.07%Russian

Geographical mobility in Taft

- Same house 1 year ago
- 5,92093.2%White (Caucasian)
- 5547.2%Black or African American
- 1768.7%American Indian / Alaska Native
- 10443.0%Asian
- 5927.3%Other race
- 1,63394.9%Two or more races
- 4,57692.5%White alone, not Hispanic / Latino
- 2,95689.6%Hispanic or Latino

-
- Moved within same county
- 2624.1%White / Caucasian
- 9237.8%Asian
- 156.9%Other race
- 211.2%Two or more races
- 2675.4%White alone, not Hispanic / Latino
- 702.1%Hispanic or Latino

-
- Moved within same state
- 1492.3%White / Caucasian
- 833.9%American Indian / Alaska Native
- 52.0%Asian
- 5100.0%Native Hawaiian / Pacific Islander
- 583.4%Two or more races
- 1072.2%White alone, not Hispanic / Latino
- 993.0%Hispanic or Latino

-
- Moved from different state
- 480.7%White / Caucasian
- 4639.7%Black or African American
- 100.6%Two or more races
- 200.4%White alone, not Hispanic / Latino
- 511.6%Hispanic or Latino

-
- Moved from abroad
- 90.1%White
- 208.1%Asian
- 11753.8%Other race
- 342.0%Two or more races
- 1424.3%Hispanic or Latino

Children Nativity (place of birth) in Taft
Place of birth for residents in Taft
![Place of birth for the foreign-born population - Regions]()
- 1,386Americas
- 1,386Latin America
- 1,386Central America
- 181Asia
- 100South Eastern Asia
- 54Europe
- 47Eastern Asia
- 33Southern Europe
- 25China
- 21Oceania
- 20Western Asia
- 13South Central Asia
- 12Eastern Europe
- 12Australia and New Zealand Subregion
- 9Northern Europe

![Place of birth for the foreign-born population - Countries]()
- 1,345Mexico
- 76Vietnam
- 33Italy
- 30El Salvador
- 25Taiwan
- 23Laos
- 22Japan
- 14Israel
- 13India
- 12New Zealand
- 11Honduras
- 9England
- 9Fiji
- 6Ukraine
- 6Lebanon

Grandparents responsible for own grandchildren in Taft
Zip codes: 93268.