Races in Taos, New Mexico (NM) Detailed Stats
Data:
Races - White alone (%)
Races - White alone (% change since 2000)
Races - Black alone (%)
Races - Black alone (% change since 2000)
Races - American Indian alone (%)
Races - American Indian alone (% change since 2000)
Races - Asian alone (%)
Races - Asian alone (% change since 2000)
Races - Hispanic (%)
Races - Hispanic (% change since 2000)
Races - Native Hawaiian and Other Pacific Islander alone (%)
Races - Native Hawaiian and Other Pacific Islander alone (% change since 2000)
Races - Two or more races(%)
Races - Two or more races(% change since 2000)
Races - Other race alone (%)
Races - Other race alone (% change since 2000)
Racial diversity
Place of birth - Born in state of residence (%)
Place of birth - Born in state of residence (%) - White
Place of birth - Born in state of residence (%) - Black or African American
Place of birth - Born in state of residence (%) - Asian
Place of birth - Born in state of residence (%) - Hispanic or Latino
Place of birth - Born in state of residence (%) - American Indian and Alaska Native
Place of birth - Born in state of residence (%) - Multirace
Place of birth - Born in state of residence (%) - Other Race
Place of birth - Born in other state (%)
Place of birth - Born in other state (%) - White
Place of birth - Born in other state (%) - Black or African American
Place of birth - Born in other state (%) - Asian
Place of birth - Born in other state (%) - Hispanic or Latino
Place of birth - Born in other state (%) - American Indian and Alaska Native
Place of birth - Born in other state (%) - Multirace
Place of birth - Born in other state (%) - Other Race
Place of birth - Native, outside of US (%)
Place of birth - Native, outside of US (%) - White
Place of birth - Native, outside of US (%) - Black or African American
Place of birth - Native, outside of US (%) - Asian
Place of birth - Native, outside of US (%) - Hispanic or Latino
Place of birth - Native, outside of US (%) - American Indian and Alaska Native
Place of birth - Native, outside of US (%) - Multirace
Place of birth - Native, outside of US (%) - Other Race
Place of birth - Foreign born (%)
Place of birth - Foreign born (%) - White
Place of birth - Foreign born (%) - Black or African American
Place of birth - Foreign born (%) - Asian
Place of birth - Foreign born (%) - Hispanic or Latino
Place of birth - Foreign born (%) - American Indian and Alaska Native
Place of birth - Foreign born (%) - Multirace
Place of birth - Foreign born (%) - Other Race
Residents speaking English at home (%)
Residents speaking English at home - Born in the United States (%)
Residents speaking English at home - Native, born elsewhere (%)
Residents speaking English at home - Foreign born (%)
Residents speaking Spanish at home (%)
Residents speaking Spanish at home - Born in the United States (%)
Residents speaking Spanish at home - Native, born elsewhere (%)
Residents speaking Spanish at home - Foreign born (%)
Residents speaking other language at home (%)
Residents speaking other language at home - Born in the United States (%)
Residents speaking other language at home - Native, born elsewhere (%)
Residents speaking other language at home - Foreign born (%)
Marital status - Never married (%)
Marital status - Now married (%)
Marital status - Separated (%)
Marital status - Widowed (%)
Marital status - Divorced (%)
Ancestries Reported - Arab (%)
Ancestries Reported - Czech (%)
Ancestries Reported - Danish (%)
Ancestries Reported - Dutch (%)
Ancestries Reported - English (%)
Ancestries Reported - French (%)
Ancestries Reported - French Canadian (%)
Ancestries Reported - German (%)
Ancestries Reported - Greek (%)
Ancestries Reported - Hungarian (%)
Ancestries Reported - Irish (%)
Ancestries Reported - Italian (%)
Ancestries Reported - Lithuanian (%)
Ancestries Reported - Norwegian (%)
Ancestries Reported - Polish (%)
Ancestries Reported - Portuguese (%)
Ancestries Reported - Russian (%)
Ancestries Reported - Scotch-Irish (%)
Ancestries Reported - Scottish (%)
Ancestries Reported - Slovak (%)
Ancestries Reported - Subsaharan African (%)
Ancestries Reported - Swedish (%)
Ancestries Reported - Swiss (%)
Ancestries Reported - Ukrainian (%)
Ancestries Reported - United States (%)
Ancestries Reported - Welsh (%)
Ancestries Reported - West Indian (%)
Ancestries Reported - Other (%)
Geographical mobility - Same house 1 year ago (%)
Geographical mobility - Same house 1 year ago (%) - White
Geographical mobility - Same house 1 year ago (%) - Black or African American
Geographical mobility - Same house 1 year ago (%) - Asian
Geographical mobility - Same house 1 year ago (%) - Hispanic or Latino
Geographical mobility - Same house 1 year ago (%) - American Indian and Alaska Native
Geographical mobility - Same house 1 year ago (%) - Multirace
Geographical mobility - Same house 1 year ago (%) - Other Race
Geographical mobility - Moved within same county (%)
Geographical mobility - Moved within same county (%) - White
Geographical mobility - Moved within same county (%) - Black or African American
Geographical mobility - Moved within same county (%) - Asian
Geographical mobility - Moved within same county (%) - Hispanic or Latino
Geographical mobility - Moved within same county (%) - American Indian and Alaska Native
Geographical mobility - Moved within same county (%) - Multirace
Geographical mobility - Moved within same county (%) - Other Race
Geographical mobility - Moved from different county within same state (%)
Geographical mobility - Moved from different county within same state (%) - White
Geographical mobility - Moved from different county within same state (%) - Black or African American
Geographical mobility - Moved from different county within same state (%) - Asian
Geographical mobility - Moved from different county within same state (%) - Hispanic or Latino
Geographical mobility - Moved from different county within same state (%) - American Indian and Alaska Native
Geographical mobility - Moved from different county within same state (%) - Multirace
Geographical mobility - Moved from different county within same state (%) - Other Race
Geographical mobility - Moved from different state (%)
Geographical mobility - Moved from different state (%) - White
Geographical mobility - Moved from different state (%) - Black or African American
Geographical mobility - Moved from different state (%) - Asian
Geographical mobility - Moved from different state (%) - Hispanic or Latino
Geographical mobility - Moved from different state (%) - American Indian and Alaska Native
Geographical mobility - Moved from different state (%) - Multirace
Geographical mobility - Moved from different state (%) - Other Race
Geographical mobility - Moved from abroad (%)
Geographical mobility - Moved from abroad (%) - White
Geographical mobility - Moved from abroad (%) - Black or African American
Geographical mobility - Moved from abroad (%) - Asian
Geographical mobility - Moved from abroad (%) - Hispanic or Latino
Geographical mobility - Moved from abroad (%) - American Indian and Alaska Native
Geographical mobility - Moved from abroad (%) - Multirace
Geographical mobility - Moved from abroad (%) - Other Race
Place of birth for the foreign-born population - Ireland (%)
Place of birth for the foreign-born population - Denmark (%)
Place of birth for the foreign-born population - Norway (%)
Place of birth for the foreign-born population - Sweden (%)
Place of birth for the foreign-born population - United Kingdom (%)
Place of birth for the foreign-born population - England (%)
Place of birth for the foreign-born population - Scotland (%)
Place of birth for the foreign-born population - Other Northern Europe (%)
Place of birth for the foreign-born population - Austria (%)
Place of birth for the foreign-born population - Belgium (%)
Place of birth for the foreign-born population - France (%)
Place of birth for the foreign-born population - Germany (%)
Place of birth for the foreign-born population - Netherlands (%)
Place of birth for the foreign-born population - Switzerland (%)
Place of birth for the foreign-born population - Other Western Europe (%)
Place of birth for the foreign-born population - Greece (%)
Place of birth for the foreign-born population - Italy (%)
Place of birth for the foreign-born population - Portugal (%)
Place of birth for the foreign-born population - Spain (%)
Place of birth for the foreign-born population - Other Southern Europe (%)
Place of birth for the foreign-born population - Albania (%)
Place of birth for the foreign-born population - Belarus (%)
Place of birth for the foreign-born population - Bosnia and Herzegovina (%)
Place of birth for the foreign-born population - Bulgaria (%)
Place of birth for the foreign-born population - Croatia (%)
Place of birth for the foreign-born population - Czechoslovakia (%)
Place of birth for the foreign-born population - Hungary (%)
Place of birth for the foreign-born population - Latvia (%)
Place of birth for the foreign-born population - Lithuania (%)
Place of birth for the foreign-born population - North Macedonia (Macedonia) (%)
Place of birth for the foreign-born population - Moldova (%)
Place of birth for the foreign-born population - Poland (%)
Place of birth for the foreign-born population - Romania (%)
Place of birth for the foreign-born population - Russia (%)
Place of birth for the foreign-born population - Serbia (%)
Place of birth for the foreign-born population - Ukraine (%)
Place of birth for the foreign-born population - Other Eastern Europe (%)
Place of birth for the foreign-born population - China (%)
Place of birth for the foreign-born population - Hong Kong (%)
Place of birth for the foreign-born population - Taiwan (%)
Place of birth for the foreign-born population - Japan (%)
Place of birth for the foreign-born population - Korea (%)
Place of birth for the foreign-born population - Other Eastern Asia (%)
Place of birth for the foreign-born population - Afghanistan (%)
Place of birth for the foreign-born population - Bangladesh (%)
Place of birth for the foreign-born population - India (%)
Place of birth for the foreign-born population - Iran (%)
Place of birth for the foreign-born population - Kazakhstan (%)
Place of birth for the foreign-born population - Nepal (%)
Place of birth for the foreign-born population - Pakistan (%)
Place of birth for the foreign-born population - Sri Lanka (%)
Place of birth for the foreign-born population - Uzbekistan (%)
Place of birth for the foreign-born population - Other South Central Asia (%)
Place of birth for the foreign-born population - Burma (%)
Place of birth for the foreign-born population - Cambodia (%)
Place of birth for the foreign-born population - Indonesia (%)
Place of birth for the foreign-born population - Laos (%)
Place of birth for the foreign-born population - Malaysia (%)
Place of birth for the foreign-born population - Philippines (%)
Place of birth for the foreign-born population - Singapore (%)
Place of birth for the foreign-born population - Thailand (%)
Place of birth for the foreign-born population - Vietnam (%)
Place of birth for the foreign-born population - Other South Eastern Asia (%)
Place of birth for the foreign-born population - Armenia (%)
Place of birth for the foreign-born population - Iraq (%)
Place of birth for the foreign-born population - Israel (%)
Place of birth for the foreign-born population - Jordan (%)
Place of birth for the foreign-born population - Kuwait (%)
Place of birth for the foreign-born population - Lebanon (%)
Place of birth for the foreign-born population - Saudi Arabia (%)
Place of birth for the foreign-born population - Syria (%)
Place of birth for the foreign-born population - Turkey (%)
Place of birth for the foreign-born population - Yemen (%)
Place of birth for the foreign-born population - Other Western Asia (%)
Place of birth for the foreign-born population - Eritrea (%)
Place of birth for the foreign-born population - Ethiopia (%)
Place of birth for the foreign-born population - Kenya (%)
Place of birth for the foreign-born population - Somalia (%)
Place of birth for the foreign-born population - Uganda (%)
Place of birth for the foreign-born population - Zimbabwe (%)
Place of birth for the foreign-born population - Other Eastern Africa (%)
Place of birth for the foreign-born population - Cameroon (%)
Place of birth for the foreign-born population - Congo (%)
Place of birth for the foreign-born population - Democratic Republic of Congo (Zaire) (%)
Place of birth for the foreign-born population - Other Middle Africa (%)
Place of birth for the foreign-born population - Egypt (%)
Place of birth for the foreign-born population - Morocco (%)
Place of birth for the foreign-born population - Sudan (%)
Place of birth for the foreign-born population - Other Northern Africa (%)
Place of birth for the foreign-born population - South Africa (%)
Place of birth for the foreign-born population - Other Southern Africa (%)
Place of birth for the foreign-born population - Cabo Verde (%)
Place of birth for the foreign-born population - Ghana (%)
Place of birth for the foreign-born population - Liberia (%)
Place of birth for the foreign-born population - Nigeria (%)
Place of birth for the foreign-born population - Senegal (%)
Place of birth for the foreign-born population - Sierra Leone (%)
Place of birth for the foreign-born population - Other Western Africa (%)
Place of birth for the foreign-born population - Australia (%)
Place of birth for the foreign-born population - New Zealand (%)
Place of birth for the foreign-born population - Fiji (%)
Place of birth for the foreign-born population - Micronesia (%)
Place of birth for the foreign-born population - Bahamas (%)
Place of birth for the foreign-born population - Barbados (%)
Place of birth for the foreign-born population - Cuba (%)
Place of birth for the foreign-born population - Dominica (%)
Place of birth for the foreign-born population - Dominican Republic (%)
Place of birth for the foreign-born population - Grenada (%)
Place of birth for the foreign-born population - Haiti (%)
Place of birth for the foreign-born population - Jamaica (%)
Place of birth for the foreign-born population - St. Vincent and the Grenadines (%)
Place of birth for the foreign-born population - Trinidad and Tobago (%)
Place of birth for the foreign-born population - West Indies (%)
Place of birth for the foreign-born population - Other Caribbean (%)
Place of birth for the foreign-born population - Belize (%)
Place of birth for the foreign-born population - Costa Rica (%)
Place of birth for the foreign-born population - El Salvador (%)
Place of birth for the foreign-born population - Guatemala (%)
Place of birth for the foreign-born population - Honduras (%)
Place of birth for the foreign-born population - Mexico (%)
Place of birth for the foreign-born population - Nicaragua (%)
Place of birth for the foreign-born population - Panama (%)
Place of birth for the foreign-born population - Other Central America (%)
Place of birth for the foreign-born population - Argentina (%)
Place of birth for the foreign-born population - Bolivia (%)
Place of birth for the foreign-born population - Brazil (%)
Place of birth for the foreign-born population - Chile (%)
Place of birth for the foreign-born population - Colombia (%)
Place of birth for the foreign-born population - Ecuador (%)
Place of birth for the foreign-born population - Guyana (%)
Place of birth for the foreign-born population - Peru (%)
Place of birth for the foreign-born population - Uruguay (%)
Place of birth for the foreign-born population - Venezuela (%)
Place of birth for the foreign-born population - Other South America (%)
Place of birth for the foreign-born population - Canada (%)
Place of birth for the foreign-born population - Other Northern America (%)
Place of birth for the foreign-born population - Other (%)
Latest news about races in Taos, NM collected exclusively by city-data.com from local newspapers, TV, and radio stations
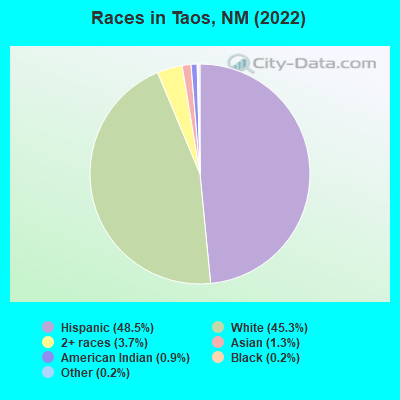
According to 2022 data, the most numerous races in Taos, NM are Hispanic (3,132 residents), White alone (2,927 residents), and American Indian alone (60 residents). 72.0% of Taos residents speak English at home. 10.8% of Taos, NM residents are foreign-born (7.3% born in Latin America, 1.6% born in Europe), which is 16.7% greater than the foreign-born rate of 9.0% across the entire state of New Mexico.
Race distribution in Taos
2000 2022
813,495 44.7% White alone 765,386 42.1% Hispanic 161,460 8.9% American Indian alone 30,654 1.7% Black alone 25,793 1.4% Two or more races 18,257 1.0% Asian alone 3,009 0.2% Other race alone 992 0.05% Native Hawaiian and Other
1,059,867 50.2% Hispanic 735,478 34.8% White alone 171,808 8.1% American Indian alone 65,084 3.1% Two or more races 36,870 1.7% Black alone 35,870 1.7% Asian alone 7,582 0.4% Other race alone 785 0.04% Native Hawaiian and Other
Income and house value in Taos Median household income in 2022 $43,983 White non-Hispanic householders$42,594 American Indian and Alaska Native householders$39,011 Hispanic or Latino race householdersMedian 2022 house value $430,958 White Non-Hispanic householders$347,750 Black or African American householders$337,128 American Indian or Alaska Native householders $569,046 Asian householders$371,271 Some other race householders$363,684 Two or more races householders$386,193 Hispanic or Latino householders
Median age by race in Taos
59.9 Median age for White residents61.5 59.4 68.4 Median age for Black or African American residents-648,594,376.9 18.6 39.6 Median age for American Indian / Alaska Native residents63.0 4.9 23.3 Median age for Asian residents23.2 57.9 -658,511,722.1 Median age for Native Hawaiian / Pacific Islander residents-685,897,435.2 -659,380,691.5 39.6 Median age for Other race residents37.1 42.6 44.3 Median age for Two or more races residents43.4 50.7 57.8 Median age for White alone residents60.9 55.2 48.9 Median age for Hispanic or Latino residents48.7 53.3
Owner/renter occupied households by race in Taos
House owners and renters - White residents 1,185 63.6% Owner occupied679 36.4% Renter occupiedHouse owners and renters - Black or African American residents 2 100.0% Renter occupiedHouse owners and renters - American Indian / Alaska Native residents 30 67.0% Owner occupied15 33.0% Renter occupiedHouse owners and renters - Asian residents 22 100.0% Owner occupiedHouse owners and renters - Other race residents 59 35.0% Owner occupied109 65.0% Renter occupiedHouse owners and renters - Two or more races residents 497 60.8% Owner occupied320 39.2% Renter occupiedHouse owners and renters - White alone residents 861 54.6% Owner occupied717 45.4% Renter occupiedHouse owners and renters - Hispanic or Latino residents 952 71.7% Owner occupied375 28.3% Renter occupied
Language usage in Taos
English speakers - Total 72.0% of residents of Taos speak English at home.
25.7% of residents speak Spanish at home 946 57.4% Speak English very well701 42.6% Speak English less than very well3.3% of residents speak other language at home 190 89.6% Speak English very well22 10.4% Speak English less than very well
English speakers - Born in the United States 86.0% of residents of Taos speak English at home.
9.6% of residents speak Spanish at home 230 85.5% Speak English very well39 14.5% Speak English less than very well3.6% of residents speak other language at home 98 96.1% Speak English very well4 3.9% Speak English less than very well
English speakers - Native, born elsewhere 85.4% of residents of Taos speak English at home.
17.9% of residents speak Spanish at home 38 100.0% Speak English less than very well1.4% of residents speak other language at home 3 100.0% Speak English very well
English speakers - Foreign-born 16.5% of residents of Taos speak English at home.
67.8% of residents speak Spanish at home 39 8.3% Speak English very well430 91.7% Speak English less than very well18.9% of residents speak other language at home 110 84.0% Speak English very well21 16.0% Speak English less than very well
White (Caucasian) - Speak only English Native:
88.5% (2,906)Foreign-born:
100.0% (68)
White (Caucasian) - Speak another language Native:
10.9% (359)Foreign-born:
63.9% (43)
Other race - Speak another language Native:
58.1% (300)Foreign-born:
98.8% (633)
White alone - Speak only English Native:
96.3% (2,688)Foreign-born:
54.0% (68)
White alone - Speak another language Native:
3.7% (102)Foreign-born:
46.1% (58)
Hispanic or Latino - Speak only English Native:
57.4% (1,528)Foreign-born:
8.9% (44)
Hispanic or Latino - Speak another language Native:
42.6% (1,133)Foreign-born:
90.8% (450)
Foreign-born residents in Taos 698 residents are foreign born (7.3% Latin America , 1.6% Europe ).
This city:
10.8%New Mexico:
9.2%
Marital status for residents in Taos Marital status - White (Caucasian) population 15 years and over
Males 47.4% Never married26.7% Now married0.8% Separated1.5% Widowed23.6% DivorcedFemales 34.8% Never married29.8% Now married0.8% Separated10.2% Widowed24.4% DivorcedWomen who gave birth in the past 12 months Now married:
100.0% (5)Unmarried:
0.0% (0)
Women who did not give birth in the past 12 months Now married:
24.7% (157)Unmarried:
75.3% (479)
Marital status - Black or African American population 15 years and over
Males 20.0% Never married0.0% Now married0.0% Separated0.0% Widowed80.0% DivorcedFemales 100.0% Never married0.0% Now married0.0% Separated0.0% Widowed0.0% DivorcedWomen who did not give birth in the past 12 months Now married:
0.0% (0)Unmarried:
100.0% (5)
Marital status - American Indian / Alaska Native population 15 years and over
Males 8.9% Never married75.6% Now married0.0% Separated0.0% Widowed15.6% DivorcedFemales 27.8% Never married72.2% Now married0.0% Separated0.0% Widowed0.0% DivorcedWomen who did not give birth in the past 12 months Now married:
100.0% (13)Unmarried:
0.0% (0)
Marital status - Asian population 15 years and over
Males 74.3% Never married25.7% Now married0.0% Separated0.0% Widowed0.0% DivorcedFemales 0.0% Never married66.7% Now married0.0% Separated33.3% Widowed0.0% DivorcedWomen who did not give birth in the past 12 months Now married:
100.0% (13)Unmarried:
0.0% (0)
Marital status - Other race population 15 years and over
Males 32.7% Never married62.3% Now married0.0% Separated0.0% Widowed5.0% DivorcedFemales 44.7% Never married45.0% Now married0.0% Separated8.9% Widowed1.3% DivorcedWomen who did not give birth in the past 12 months Now married:
57.1% (168)Unmarried:
42.9% (126)
Marital status - Two or more races population 15 years and over
Males 67.1% Never married27.1% Now married1.8% Separated0.0% Widowed4.0% DivorcedFemales 46.7% Never married18.4% Now married0.0% Separated16.3% Widowed18.6% DivorcedWomen who did not give birth in the past 12 months Now married:
29.9% (116)Unmarried:
70.1% (271)
Marital status - White alone, not Hispanic / Latino population 15 years and over
Males 40.4% Never married36.7% Now married1.0% Separated1.9% Widowed20.0% DivorcedFemales 31.1% Never married34.3% Now married0.8% Separated7.4% Widowed26.5% DivorcedWomen who gave birth in the past 12 months Now married:
100.0% (6)Unmarried:
0.0% (0)
Women who did not give birth in the past 12 months Now married:
25.9% (158)Unmarried:
74.1% (451)
Marital status - Hispanic or Latino population 15 years and over
Males 52.5% Never married30.1% Now married1.0% Separated0.3% Widowed16.1% DivorcedFemales 45.5% Never married24.9% Now married0.3% Separated15.7% Widowed13.6% DivorcedWomen who did not give birth in the past 12 months Now married:
38.1% (255)Unmarried:
61.9% (415)
Ancestries in Taos
218 7.5% German188 6.4% Irish150 5.1% English102 3.5% European70 2.4% Dutch66 2.3% Italian53 1.8% Czech48 1.6% American35 1.2% Canadian23 0.8% Scotch-Irish21 0.7% Swedish20 0.7% French18 0.6% Northern European17 0.6% Polish13 0.4% Scottish11 0.4% Portuguese6 0.2% British3 0.1% Finnish3 0.1% Norwegian2 0.07% French Canadian2 0.07% Soviet Union2 0.07% Welsh1 0.03% Swiss
Geographical mobility in Taos Same house 1 year ago 2,916 88.3% White (Caucasian)3 18.1% Black or African American103 98.8% American Indian / Alaska Native85 100.0% Asian3 100.0% Native Hawaiian / Pacific Islander1,108 97.4% Other race1,768 94.6% Two or more races2,511 85.6% White alone, not Hispanic / Latino3,039 97.1% Hispanic or LatinoMoved within same county 55 1.7% White / Caucasian1 5.3% Black or African American20 1.8% Other race58 3.1% Two or more races55 1.9% White alone, not Hispanic / Latino30 1.0% Hispanic or LatinoMoved within same state 80 2.4% White / Caucasian7 41.0% Black or African American12 1.1% Other race30 1.6% Two or more races67 2.3% White alone, not Hispanic / Latino68 2.2% Hispanic or LatinoMoved from different state 297 9.0% White / Caucasian6 33.6% Black or African American1 1.0% American Indian / Alaska Native3 0.2% Two or more races332 11.3% White alone, not Hispanic / LatinoMoved from abroad 6 0.2% White8 0.7% Other race8 0.3% White alone, not Hispanic / Latino9 0.3% Hispanic or Latino
Children Nativity (place of birth) in Taos
Children under 6 years - Living with two parents Both parents native 52 100.0% NativeChildren under 6 years - Living with one parent Native parent 35 100.0% NativeForeign-born parent 6 100.0% NativeChildren 6 to 17 years - Living with two parents Both parents native 199 100.0% NativeBoth parents foreign-born 19 100.0% NativeChildren 6 to 17 years - Living with one parent Native parent 302 85.7% Native50 14.3% Foreign-bornForeign-born parent 62 100.0% Native
Grandparents responsible for own grandchildren in Taos
Grandparents (30 to 59 years) White / Caucasian 14 100.0% Not responsible for grandchildrenHispanic or Latino 17 100.0% Not responsible for grandchildrenGrandparents (60 years and over) White / Caucasian 5 68.5% Responsible for grandchildren2 31.5% Not responsible for grandchildrenHispanic or Latino 7 100.0% Not responsible for grandchildren