Races in Tavares, Florida (FL) Detailed Stats
Data:
Races - White alone (%)
Races - White alone (% change since 2000)
Races - Black alone (%)
Races - Black alone (% change since 2000)
Races - American Indian alone (%)
Races - American Indian alone (% change since 2000)
Races - Asian alone (%)
Races - Asian alone (% change since 2000)
Races - Hispanic (%)
Races - Hispanic (% change since 2000)
Races - Native Hawaiian and Other Pacific Islander alone (%)
Races - Native Hawaiian and Other Pacific Islander alone (% change since 2000)
Races - Two or more races(%)
Races - Two or more races(% change since 2000)
Races - Other race alone (%)
Races - Other race alone (% change since 2000)
Racial diversity
Place of birth - Born in state of residence (%)
Place of birth - Born in state of residence (%) - White
Place of birth - Born in state of residence (%) - Black or African American
Place of birth - Born in state of residence (%) - Asian
Place of birth - Born in state of residence (%) - Hispanic or Latino
Place of birth - Born in state of residence (%) - American Indian and Alaska Native
Place of birth - Born in state of residence (%) - Multirace
Place of birth - Born in state of residence (%) - Other Race
Place of birth - Born in other state (%)
Place of birth - Born in other state (%) - White
Place of birth - Born in other state (%) - Black or African American
Place of birth - Born in other state (%) - Asian
Place of birth - Born in other state (%) - Hispanic or Latino
Place of birth - Born in other state (%) - American Indian and Alaska Native
Place of birth - Born in other state (%) - Multirace
Place of birth - Born in other state (%) - Other Race
Place of birth - Native, outside of US (%)
Place of birth - Native, outside of US (%) - White
Place of birth - Native, outside of US (%) - Black or African American
Place of birth - Native, outside of US (%) - Asian
Place of birth - Native, outside of US (%) - Hispanic or Latino
Place of birth - Native, outside of US (%) - American Indian and Alaska Native
Place of birth - Native, outside of US (%) - Multirace
Place of birth - Native, outside of US (%) - Other Race
Place of birth - Foreign born (%)
Place of birth - Foreign born (%) - White
Place of birth - Foreign born (%) - Black or African American
Place of birth - Foreign born (%) - Asian
Place of birth - Foreign born (%) - Hispanic or Latino
Place of birth - Foreign born (%) - American Indian and Alaska Native
Place of birth - Foreign born (%) - Multirace
Place of birth - Foreign born (%) - Other Race
Residents speaking English at home (%)
Residents speaking English at home - Born in the United States (%)
Residents speaking English at home - Native, born elsewhere (%)
Residents speaking English at home - Foreign born (%)
Residents speaking Spanish at home (%)
Residents speaking Spanish at home - Born in the United States (%)
Residents speaking Spanish at home - Native, born elsewhere (%)
Residents speaking Spanish at home - Foreign born (%)
Residents speaking other language at home (%)
Residents speaking other language at home - Born in the United States (%)
Residents speaking other language at home - Native, born elsewhere (%)
Residents speaking other language at home - Foreign born (%)
Marital status - Never married (%)
Marital status - Now married (%)
Marital status - Separated (%)
Marital status - Widowed (%)
Marital status - Divorced (%)
Ancestries Reported - Arab (%)
Ancestries Reported - Czech (%)
Ancestries Reported - Danish (%)
Ancestries Reported - Dutch (%)
Ancestries Reported - English (%)
Ancestries Reported - French (%)
Ancestries Reported - French Canadian (%)
Ancestries Reported - German (%)
Ancestries Reported - Greek (%)
Ancestries Reported - Hungarian (%)
Ancestries Reported - Irish (%)
Ancestries Reported - Italian (%)
Ancestries Reported - Lithuanian (%)
Ancestries Reported - Norwegian (%)
Ancestries Reported - Polish (%)
Ancestries Reported - Portuguese (%)
Ancestries Reported - Russian (%)
Ancestries Reported - Scotch-Irish (%)
Ancestries Reported - Scottish (%)
Ancestries Reported - Slovak (%)
Ancestries Reported - Subsaharan African (%)
Ancestries Reported - Swedish (%)
Ancestries Reported - Swiss (%)
Ancestries Reported - Ukrainian (%)
Ancestries Reported - United States (%)
Ancestries Reported - Welsh (%)
Ancestries Reported - West Indian (%)
Ancestries Reported - Other (%)
Geographical mobility - Same house 1 year ago (%)
Geographical mobility - Same house 1 year ago (%) - White
Geographical mobility - Same house 1 year ago (%) - Black or African American
Geographical mobility - Same house 1 year ago (%) - Asian
Geographical mobility - Same house 1 year ago (%) - Hispanic or Latino
Geographical mobility - Same house 1 year ago (%) - American Indian and Alaska Native
Geographical mobility - Same house 1 year ago (%) - Multirace
Geographical mobility - Same house 1 year ago (%) - Other Race
Geographical mobility - Moved within same county (%)
Geographical mobility - Moved within same county (%) - White
Geographical mobility - Moved within same county (%) - Black or African American
Geographical mobility - Moved within same county (%) - Asian
Geographical mobility - Moved within same county (%) - Hispanic or Latino
Geographical mobility - Moved within same county (%) - American Indian and Alaska Native
Geographical mobility - Moved within same county (%) - Multirace
Geographical mobility - Moved within same county (%) - Other Race
Geographical mobility - Moved from different county within same state (%)
Geographical mobility - Moved from different county within same state (%) - White
Geographical mobility - Moved from different county within same state (%) - Black or African American
Geographical mobility - Moved from different county within same state (%) - Asian
Geographical mobility - Moved from different county within same state (%) - Hispanic or Latino
Geographical mobility - Moved from different county within same state (%) - American Indian and Alaska Native
Geographical mobility - Moved from different county within same state (%) - Multirace
Geographical mobility - Moved from different county within same state (%) - Other Race
Geographical mobility - Moved from different state (%)
Geographical mobility - Moved from different state (%) - White
Geographical mobility - Moved from different state (%) - Black or African American
Geographical mobility - Moved from different state (%) - Asian
Geographical mobility - Moved from different state (%) - Hispanic or Latino
Geographical mobility - Moved from different state (%) - American Indian and Alaska Native
Geographical mobility - Moved from different state (%) - Multirace
Geographical mobility - Moved from different state (%) - Other Race
Geographical mobility - Moved from abroad (%)
Geographical mobility - Moved from abroad (%) - White
Geographical mobility - Moved from abroad (%) - Black or African American
Geographical mobility - Moved from abroad (%) - Asian
Geographical mobility - Moved from abroad (%) - Hispanic or Latino
Geographical mobility - Moved from abroad (%) - American Indian and Alaska Native
Geographical mobility - Moved from abroad (%) - Multirace
Geographical mobility - Moved from abroad (%) - Other Race
Place of birth for the foreign-born population - Ireland (%)
Place of birth for the foreign-born population - Denmark (%)
Place of birth for the foreign-born population - Norway (%)
Place of birth for the foreign-born population - Sweden (%)
Place of birth for the foreign-born population - United Kingdom (%)
Place of birth for the foreign-born population - England (%)
Place of birth for the foreign-born population - Scotland (%)
Place of birth for the foreign-born population - Other Northern Europe (%)
Place of birth for the foreign-born population - Austria (%)
Place of birth for the foreign-born population - Belgium (%)
Place of birth for the foreign-born population - France (%)
Place of birth for the foreign-born population - Germany (%)
Place of birth for the foreign-born population - Netherlands (%)
Place of birth for the foreign-born population - Switzerland (%)
Place of birth for the foreign-born population - Other Western Europe (%)
Place of birth for the foreign-born population - Greece (%)
Place of birth for the foreign-born population - Italy (%)
Place of birth for the foreign-born population - Portugal (%)
Place of birth for the foreign-born population - Spain (%)
Place of birth for the foreign-born population - Other Southern Europe (%)
Place of birth for the foreign-born population - Albania (%)
Place of birth for the foreign-born population - Belarus (%)
Place of birth for the foreign-born population - Bosnia and Herzegovina (%)
Place of birth for the foreign-born population - Bulgaria (%)
Place of birth for the foreign-born population - Croatia (%)
Place of birth for the foreign-born population - Czechoslovakia (%)
Place of birth for the foreign-born population - Hungary (%)
Place of birth for the foreign-born population - Latvia (%)
Place of birth for the foreign-born population - Lithuania (%)
Place of birth for the foreign-born population - North Macedonia (Macedonia) (%)
Place of birth for the foreign-born population - Moldova (%)
Place of birth for the foreign-born population - Poland (%)
Place of birth for the foreign-born population - Romania (%)
Place of birth for the foreign-born population - Russia (%)
Place of birth for the foreign-born population - Serbia (%)
Place of birth for the foreign-born population - Ukraine (%)
Place of birth for the foreign-born population - Other Eastern Europe (%)
Place of birth for the foreign-born population - China (%)
Place of birth for the foreign-born population - Hong Kong (%)
Place of birth for the foreign-born population - Taiwan (%)
Place of birth for the foreign-born population - Japan (%)
Place of birth for the foreign-born population - Korea (%)
Place of birth for the foreign-born population - Other Eastern Asia (%)
Place of birth for the foreign-born population - Afghanistan (%)
Place of birth for the foreign-born population - Bangladesh (%)
Place of birth for the foreign-born population - India (%)
Place of birth for the foreign-born population - Iran (%)
Place of birth for the foreign-born population - Kazakhstan (%)
Place of birth for the foreign-born population - Nepal (%)
Place of birth for the foreign-born population - Pakistan (%)
Place of birth for the foreign-born population - Sri Lanka (%)
Place of birth for the foreign-born population - Uzbekistan (%)
Place of birth for the foreign-born population - Other South Central Asia (%)
Place of birth for the foreign-born population - Burma (%)
Place of birth for the foreign-born population - Cambodia (%)
Place of birth for the foreign-born population - Indonesia (%)
Place of birth for the foreign-born population - Laos (%)
Place of birth for the foreign-born population - Malaysia (%)
Place of birth for the foreign-born population - Philippines (%)
Place of birth for the foreign-born population - Singapore (%)
Place of birth for the foreign-born population - Thailand (%)
Place of birth for the foreign-born population - Vietnam (%)
Place of birth for the foreign-born population - Other South Eastern Asia (%)
Place of birth for the foreign-born population - Armenia (%)
Place of birth for the foreign-born population - Iraq (%)
Place of birth for the foreign-born population - Israel (%)
Place of birth for the foreign-born population - Jordan (%)
Place of birth for the foreign-born population - Kuwait (%)
Place of birth for the foreign-born population - Lebanon (%)
Place of birth for the foreign-born population - Saudi Arabia (%)
Place of birth for the foreign-born population - Syria (%)
Place of birth for the foreign-born population - Turkey (%)
Place of birth for the foreign-born population - Yemen (%)
Place of birth for the foreign-born population - Other Western Asia (%)
Place of birth for the foreign-born population - Eritrea (%)
Place of birth for the foreign-born population - Ethiopia (%)
Place of birth for the foreign-born population - Kenya (%)
Place of birth for the foreign-born population - Somalia (%)
Place of birth for the foreign-born population - Uganda (%)
Place of birth for the foreign-born population - Zimbabwe (%)
Place of birth for the foreign-born population - Other Eastern Africa (%)
Place of birth for the foreign-born population - Cameroon (%)
Place of birth for the foreign-born population - Congo (%)
Place of birth for the foreign-born population - Democratic Republic of Congo (Zaire) (%)
Place of birth for the foreign-born population - Other Middle Africa (%)
Place of birth for the foreign-born population - Egypt (%)
Place of birth for the foreign-born population - Morocco (%)
Place of birth for the foreign-born population - Sudan (%)
Place of birth for the foreign-born population - Other Northern Africa (%)
Place of birth for the foreign-born population - South Africa (%)
Place of birth for the foreign-born population - Other Southern Africa (%)
Place of birth for the foreign-born population - Cabo Verde (%)
Place of birth for the foreign-born population - Ghana (%)
Place of birth for the foreign-born population - Liberia (%)
Place of birth for the foreign-born population - Nigeria (%)
Place of birth for the foreign-born population - Senegal (%)
Place of birth for the foreign-born population - Sierra Leone (%)
Place of birth for the foreign-born population - Other Western Africa (%)
Place of birth for the foreign-born population - Australia (%)
Place of birth for the foreign-born population - New Zealand (%)
Place of birth for the foreign-born population - Fiji (%)
Place of birth for the foreign-born population - Micronesia (%)
Place of birth for the foreign-born population - Bahamas (%)
Place of birth for the foreign-born population - Barbados (%)
Place of birth for the foreign-born population - Cuba (%)
Place of birth for the foreign-born population - Dominica (%)
Place of birth for the foreign-born population - Dominican Republic (%)
Place of birth for the foreign-born population - Grenada (%)
Place of birth for the foreign-born population - Haiti (%)
Place of birth for the foreign-born population - Jamaica (%)
Place of birth for the foreign-born population - St. Vincent and the Grenadines (%)
Place of birth for the foreign-born population - Trinidad and Tobago (%)
Place of birth for the foreign-born population - West Indies (%)
Place of birth for the foreign-born population - Other Caribbean (%)
Place of birth for the foreign-born population - Belize (%)
Place of birth for the foreign-born population - Costa Rica (%)
Place of birth for the foreign-born population - El Salvador (%)
Place of birth for the foreign-born population - Guatemala (%)
Place of birth for the foreign-born population - Honduras (%)
Place of birth for the foreign-born population - Mexico (%)
Place of birth for the foreign-born population - Nicaragua (%)
Place of birth for the foreign-born population - Panama (%)
Place of birth for the foreign-born population - Other Central America (%)
Place of birth for the foreign-born population - Argentina (%)
Place of birth for the foreign-born population - Bolivia (%)
Place of birth for the foreign-born population - Brazil (%)
Place of birth for the foreign-born population - Chile (%)
Place of birth for the foreign-born population - Colombia (%)
Place of birth for the foreign-born population - Ecuador (%)
Place of birth for the foreign-born population - Guyana (%)
Place of birth for the foreign-born population - Peru (%)
Place of birth for the foreign-born population - Uruguay (%)
Place of birth for the foreign-born population - Venezuela (%)
Place of birth for the foreign-born population - Other South America (%)
Place of birth for the foreign-born population - Canada (%)
Place of birth for the foreign-born population - Other Northern America (%)
Place of birth for the foreign-born population - Other (%)
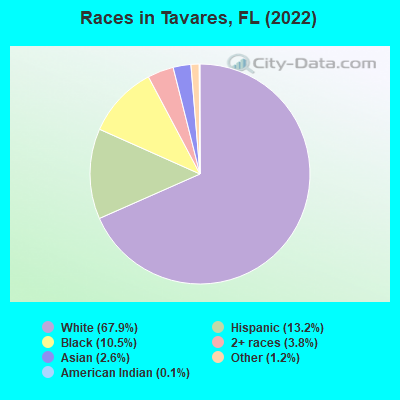
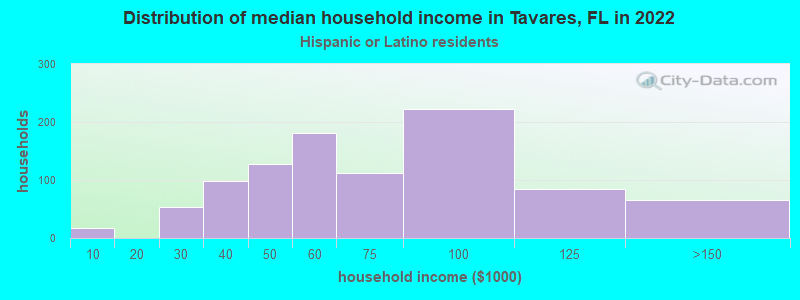
According to 2022 data, the most numerous races in Tavares, FL are White alone (13,749 residents), Hispanic (2,663 residents), and Black alone (2,118 residents). 84.8% of Tavares residents speak English at home. 8.1% of Tavares, FL residents are foreign-born (4.3% born in Latin America, 2.4% born in Asia, 1.2% born in Europe), which is 158.0% less than the foreign-born rate of 21.0% across the entire state of Florida.
Race distribution in Tavares
2000 2022
10,458,509 65.4% White alone 2,682,715 16.8% Hispanic 2,264,268 14.2% Black alone 261,693 1.6% Asian alone 236,954 1.5% Two or more races 42,358 0.3% American Indian alone 28,994 0.2% Other race alone 6,887 0.04% Native Hawaiian and Other
11,309,403 50.8% White alone 6,025,039 27.1% Hispanic 3,241,015 14.6% Black alone 861,630 3.9% Two or more races 623,692 2.8% Asian alone 152,054 0.7% Other race alone 22,504 0.1% American Indian alone 9,486 0.04% Native Hawaiian and Other
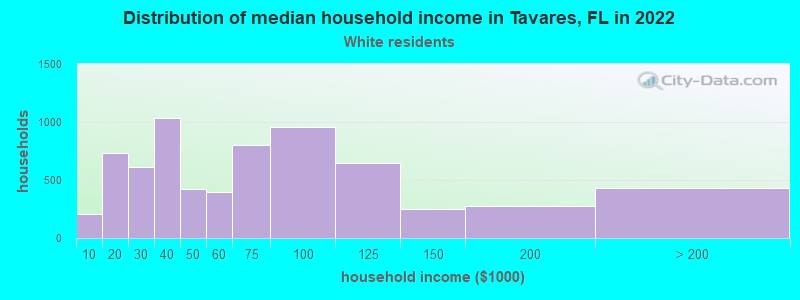
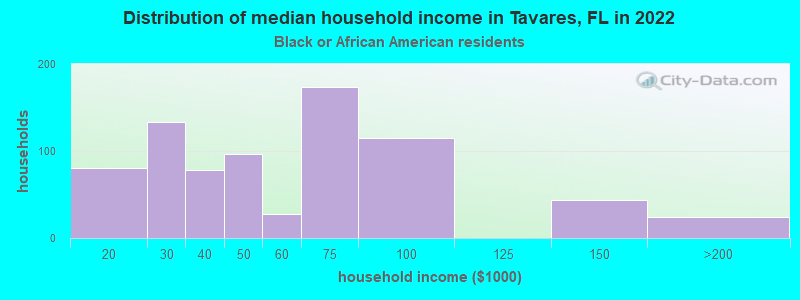
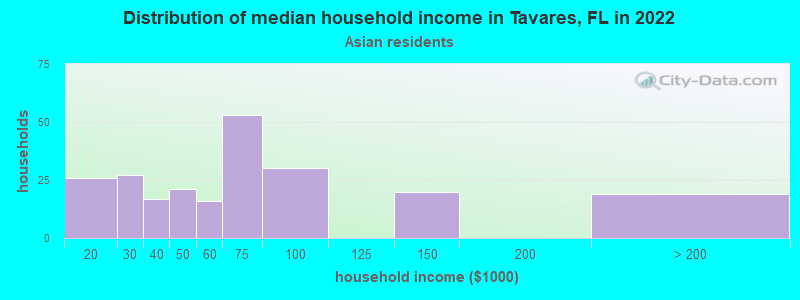
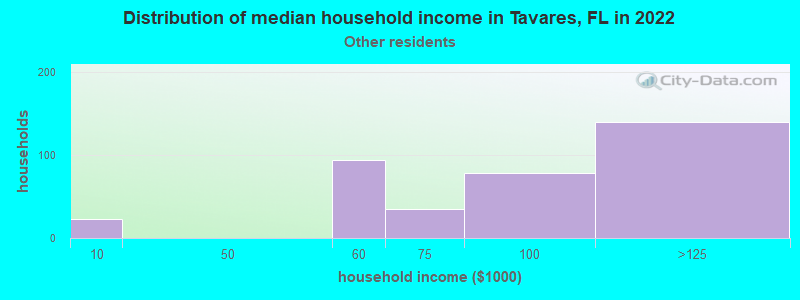
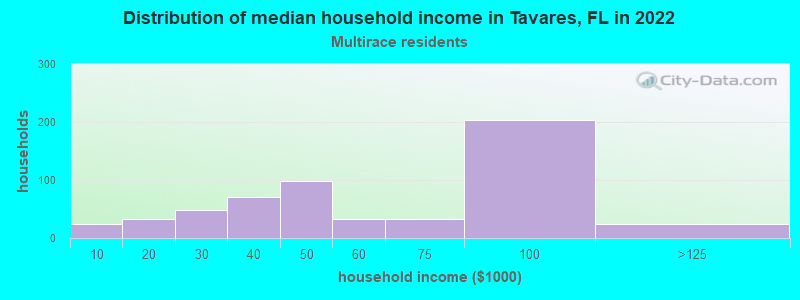
Income and house value in Tavares Median household income in 2022 $57,002 White non-Hispanic householders$46,695 Black householders$52,492 Asian householders$81,926 Some other race householders$43,106 Two or more races householders$57,022 Hispanic or Latino race householdersMedian 2022 house value $302,276 White Non-Hispanic householders$211,971 Black or African American householders$222,929 Some other race householders$288,296 Two or more races householders$264,492 Hispanic or Latino householders
Median age by race in Tavares
62.7 Median age for White residents60.9 63.0 29.0 Median age for Black or African American residents30.5 28.2 48.4 Median age for American Indian / Alaska Native residents49.2 -591,194,968.0 78.9 Median age for Asian residents87.6 77.2 -679,849,340.2 Median age for Native Hawaiian / Pacific Islander residents-858,307,848.3 -443,298,968.6 42.6 Median age for Other race residents45.3 31.4 39.3 Median age for Two or more races residents41.8 36.1 62.3 Median age for White alone residents62.7 62.0 46.3 Median age for Hispanic or Latino residents42.2 47.7
Owner/renter occupied households by race in Tavares
House owners and renters - White residents 5,295 76.8% Owner occupied1,601 23.2% Renter occupiedHouse owners and renters - Black or African American residents 395 43.5% Owner occupied512 56.5% Renter occupiedHouse owners and renters - American Indian / Alaska Native residents 49 100.0% Owner occupiedHouse owners and renters - Asian residents 253 97.3% Owner occupied7 2.7% Renter occupiedHouse owners and renters - Other race residents 290 72.8% Owner occupied109 27.2% Renter occupiedHouse owners and renters - Two or more races residents 442 69.2% Owner occupied197 30.8% Renter occupiedHouse owners and renters - White alone residents 5,133 75.8% Owner occupied1,641 24.2% Renter occupiedHouse owners and renters - Hispanic or Latino residents 837 77.2% Owner occupied247 22.8% Renter occupied
Language usage in Tavares
English speakers - Total 84.8% of residents of Tavares speak English at home.
12.1% of residents speak Spanish at home 1,543 65.9% Speak English very well800 34.1% Speak English less than very well2.9% of residents speak other language at home 430 76.9% Speak English very well129 23.1% Speak English less than very well
English speakers - Born in the United States 93.4% of residents of Tavares speak English at home.
6.2% of residents speak Spanish at home 630 89.4% Speak English very well75 10.6% Speak English less than very well0.6% of residents speak other language at home 48 76.2% Speak English very well15 23.8% Speak English less than very well
English speakers - Native, born elsewhere 33.7% of residents of Tavares speak English at home.
66.1% of residents speak Spanish at home 352 57.1% Speak English very well265 42.9% Speak English less than very well
English speakers - Foreign-born 31.2% of residents of Tavares speak English at home.
36.0% of residents speak Spanish at home 132 23.7% Speak English very well424 76.3% Speak English less than very well33.6% of residents speak other language at home 403 77.6% Speak English very well116 22.4% Speak English less than very well
White (Caucasian) - Speak only English Native:
95.0% (12,622)Foreign-born:
75.3% (222)
White (Caucasian) - Speak another language Native:
5.0% (662)Foreign-born:
61.7% (182)
Black or African American - Speak only English Native:
100.0% (1,881)Foreign-born:
88.0% (131)
Black or African American - Speak another language Native:
0.5% (9)Foreign-born:
8.4% (13)
Other race - Speak only English Native:
22.7% (176)Foreign-born:
8.7% (37)
Other race - Speak another language Native:
74.3% (576)Foreign-born:
83.4% (351)
Two or more races - Speak only English Native:
68.8% (1,180)Foreign-born:
8.0% (11)
Two or more races - Speak another language Native:
31.8% (546)Foreign-born:
97.6% (132)
White alone - Speak only English Native:
97.9% (12,804)Foreign-born:
100.0% (228)
White alone - Speak another language Native:
2.2% (288)Foreign-born:
4.2% (10)
Hispanic or Latino - Speak only English Native:
24.9% (507)Foreign-born:
0.6% (3)
Hispanic or Latino - Speak another language Native:
77.4% (1,576)Foreign-born:
100.0% (560)
Foreign-born residents in Tavares 1,647 residents are foreign born (4.3% Latin America , 2.4% Asia , 1.2% Europe ).
This city:
8.1%Florida:
21.1%
Marital status for residents in Tavares Marital status - White (Caucasian) population 15 years and over
Males 20.3% Never married62.6% Now married1.1% Separated3.0% Widowed13.0% DivorcedFemales 15.0% Never married50.1% Now married1.6% Separated18.2% Widowed15.2% DivorcedWomen who gave birth in the past 12 months Now married:
47.7% (48)Unmarried:
52.3% (53)
Women who did not give birth in the past 12 months Now married:
47.5% (842)Unmarried:
52.5% (929)
Marital status - Black or African American population 15 years and over
Males 56.8% Never married35.7% Now married1.5% Separated0.0% Widowed6.0% DivorcedFemales 61.5% Never married17.9% Now married0.0% Separated0.0% Widowed20.5% DivorcedWomen who did not give birth in the past 12 months Now married:
15.5% (103)Unmarried:
84.5% (559)
Marital status - Asian population 15 years and over
Males 9.0% Never married91.0% Now married0.0% Separated0.0% Widowed0.0% DivorcedFemales 0.0% Never married86.4% Now married0.0% Separated13.6% Widowed0.0% DivorcedWomen who did not give birth in the past 12 months Now married:
100.0% (8)Unmarried:
0.0% (0)
Marital status - Other race population 15 years and over
Males 47.2% Never married24.0% Now married0.0% Separated0.0% Widowed28.8% DivorcedFemales 29.3% Never married37.3% Now married0.0% Separated0.0% Widowed33.3% DivorcedWomen who did not give birth in the past 12 months Now married:
25.9% (162)Unmarried:
74.1% (462)
Marital status - Two or more races population 15 years and over
Males 30.0% Never married49.5% Now married0.0% Separated1.7% Widowed18.7% DivorcedFemales 31.2% Never married52.8% Now married3.6% Separated6.1% Widowed6.3% DivorcedWomen who gave birth in the past 12 months Now married:
40.9% (12)Unmarried:
59.1% (17)
Women who did not give birth in the past 12 months Now married:
29.0% (72)Unmarried:
71.0% (177)
Marital status - White alone, not Hispanic / Latino population 15 years and over
Males 21.0% Never married63.1% Now married1.2% Separated3.2% Widowed11.5% DivorcedFemales 13.1% Never married51.1% Now married1.7% Separated18.7% Widowed15.5% DivorcedWomen who gave birth in the past 12 months Now married:
39.1% (37)Unmarried:
60.9% (57)
Women who did not give birth in the past 12 months Now married:
46.7% (812)Unmarried:
53.3% (925)
Marital status - Hispanic or Latino population 15 years and over
Males 28.8% Never married44.9% Now married0.0% Separated0.9% Widowed25.5% DivorcedFemales 31.7% Never married43.5% Now married1.8% Separated5.2% Widowed17.8% DivorcedWomen who gave birth in the past 12 months Now married:
100.0% (17)Unmarried:
0.0% (0)
Women who did not give birth in the past 12 months Now married:
39.8% (218)Unmarried:
60.2% (331)
Ancestries in Tavares
1,397 14.2% English959 9.8% German896 9.1% American682 7.0% Irish417 4.3% European358 3.6% Italian328 3.3% U.S. Virgin Islander198 2.0% Jamaican190 1.9% Polish169 1.7% Norwegian155 1.6% Swiss145 1.5% Eastern European89 0.9% Bulgarian87 0.9% Scottish80 0.8% French79 0.8% Haitian78 0.8% African69 0.7% French Canadian53 0.5% Swedish46 0.5% Dutch34 0.3% Scotch-Irish30 0.3% Hungarian29 0.3% Moroccan26 0.3% British22 0.2% Armenian22 0.2% Guyanese20 0.2% Slovak19 0.2% Austrian15 0.2% Czech14 0.1% Northern European11 0.1% Cajun10 0.1% Danish10 0.1% Canadian9 0.09% Pennsylvania German9 0.09% Greek8 0.08% Bermudan8 0.08% British West Indian5 0.05% Romanian5 0.05% West Indian3 0.03% Bahamian
Geographical mobility in Tavares Same house 1 year ago 12,176 87.9% White (Caucasian)1,512 69.1% Black or African American52 59.8% American Indian / Alaska Native419 88.5% Asian1,118 89.9% Other race1,617 84.0% Two or more races12,014 87.7% White alone, not Hispanic / Latino2,377 88.8% Hispanic or LatinoMoved within same county 720 5.2% White / Caucasian303 13.9% Black or African American21 24.4% American Indian / Alaska Native34 2.7% Other race119 6.2% Two or more races696 5.1% White alone, not Hispanic / Latino179 6.7% Hispanic or LatinoMoved within same state 393 2.8% White / Caucasian304 13.9% Black or African American8 9.1% American Indian / Alaska Native26 2.1% Other race45 2.3% Two or more races417 3.0% White alone, not Hispanic / Latino60 2.2% Hispanic or LatinoMoved from different state 422 3.0% White / Caucasian83 3.8% Black or African American9 2.0% Asian15 0.8% Two or more races430 3.1% White alone, not Hispanic / LatinoMoved from abroad 48 0.3% White15 0.7% Black or African American54 11.4% Asian45 2.3% Two or more races57 0.4% White alone, not Hispanic / Latino43 1.6% Hispanic or Latino
Children Nativity (place of birth) in Tavares
Children under 6 years - Living with two parents Both parents native 589 100.0% NativeBoth parents foreign-born 88 100.0% NativeOne native, one foreign-born parent 20 100.0% NativeChildren under 6 years - Living with one parent Native parent 419 100.0% NativeForeign-born parent 70 100.0% NativeChildren 6 to 17 years - Living with two parents Both parents native 860 99.3% Native6 0.7% Foreign-bornBoth parents foreign-born 23 22.0% Native81 78.0% Foreign-bornOne native, one foreign-born parent 145 100.0% NativeChildren 6 to 17 years - Living with one parent Native parent 684 100.0% NativeForeign-born parent 57 46.1% Native67 53.9% Foreign-born
Grandparents responsible for own grandchildren in Tavares
Grandparents (30 to 59 years) White / Caucasian 46 53.2% Responsible for grandchildren41 46.8% Not responsible for grandchildrenBlack or African American 37 100.0% Not responsible for grandchildrenTwo or more races 109 100.0% Not responsible for grandchildrenWhite alone, not Hispanic / Latino 50 51.7% Responsible for grandchildren47 48.3% Not responsible for grandchildrenGrandparents (60 years and over) White / Caucasian 38 46.8% Responsible for grandchildren43 53.2% Not responsible for grandchildrenWhite alone, not Hispanic / Latino 41 58.1% Responsible for grandchildren30 41.9% Not responsible for grandchildren