Races in Taylor, Texas (TX) Detailed Stats
Data:
Races - White alone (%)
Races - White alone (% change since 2000)
Races - Black alone (%)
Races - Black alone (% change since 2000)
Races - American Indian alone (%)
Races - American Indian alone (% change since 2000)
Races - Asian alone (%)
Races - Asian alone (% change since 2000)
Races - Hispanic (%)
Races - Hispanic (% change since 2000)
Races - Native Hawaiian and Other Pacific Islander alone (%)
Races - Native Hawaiian and Other Pacific Islander alone (% change since 2000)
Races - Two or more races(%)
Races - Two or more races(% change since 2000)
Races - Other race alone (%)
Races - Other race alone (% change since 2000)
Racial diversity
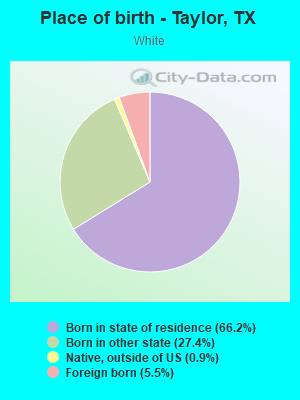
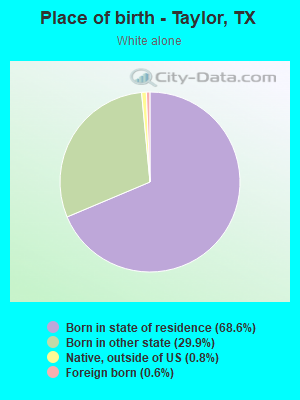
Place of birth - Born in state of residence (%)
Place of birth - Born in state of residence (%) - White
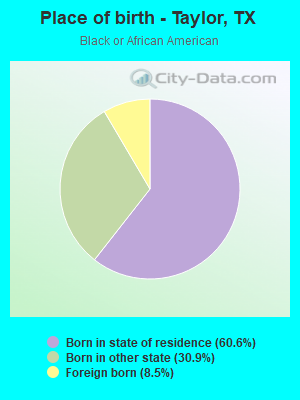
Place of birth - Born in state of residence (%) - Black or African American
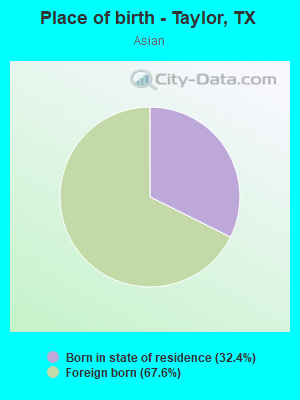
Place of birth - Born in state of residence (%) - Asian
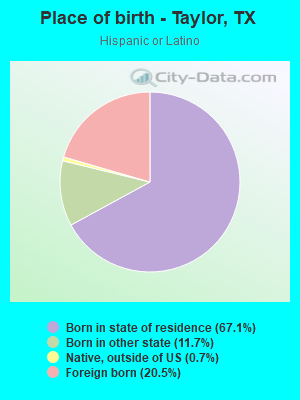
Place of birth - Born in state of residence (%) - Hispanic or Latino
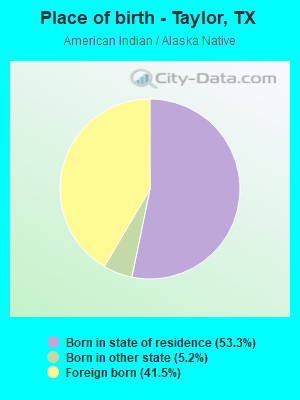
Place of birth - Born in state of residence (%) - American Indian and Alaska Native
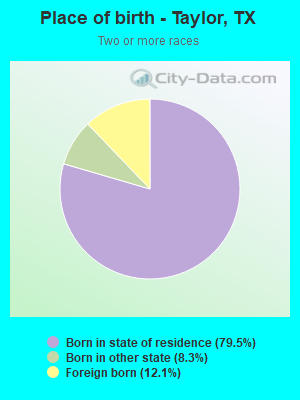
Place of birth - Born in state of residence (%) - Multirace
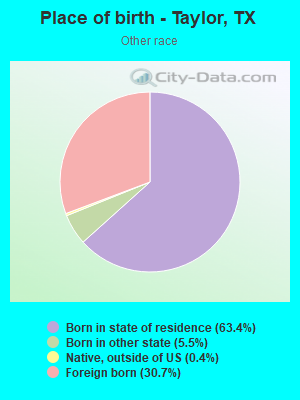
Place of birth - Born in state of residence (%) - Other Race
Place of birth - Born in other state (%)
Place of birth - Born in other state (%) - White
Place of birth - Born in other state (%) - Black or African American
Place of birth - Born in other state (%) - Asian
Place of birth - Born in other state (%) - Hispanic or Latino
Place of birth - Born in other state (%) - American Indian and Alaska Native
Place of birth - Born in other state (%) - Multirace
Place of birth - Born in other state (%) - Other Race
Place of birth - Native, outside of US (%)
Place of birth - Native, outside of US (%) - White
Place of birth - Native, outside of US (%) - Black or African American
Place of birth - Native, outside of US (%) - Asian
Place of birth - Native, outside of US (%) - Hispanic or Latino
Place of birth - Native, outside of US (%) - American Indian and Alaska Native
Place of birth - Native, outside of US (%) - Multirace
Place of birth - Native, outside of US (%) - Other Race
Place of birth - Foreign born (%)
Place of birth - Foreign born (%) - White
Place of birth - Foreign born (%) - Black or African American
Place of birth - Foreign born (%) - Asian
Place of birth - Foreign born (%) - Hispanic or Latino
Place of birth - Foreign born (%) - American Indian and Alaska Native
Place of birth - Foreign born (%) - Multirace
Place of birth - Foreign born (%) - Other Race
Residents speaking English at home (%)
Residents speaking English at home - Born in the United States (%)
Residents speaking English at home - Native, born elsewhere (%)
Residents speaking English at home - Foreign born (%)
Residents speaking Spanish at home (%)
Residents speaking Spanish at home - Born in the United States (%)
Residents speaking Spanish at home - Native, born elsewhere (%)
Residents speaking Spanish at home - Foreign born (%)
Residents speaking other language at home (%)
Residents speaking other language at home - Born in the United States (%)
Residents speaking other language at home - Native, born elsewhere (%)
Residents speaking other language at home - Foreign born (%)
Marital status - Never married (%)
Marital status - Now married (%)
Marital status - Separated (%)
Marital status - Widowed (%)
Marital status - Divorced (%)
Ancestries Reported - Arab (%)
Ancestries Reported - Czech (%)
Ancestries Reported - Danish (%)
Ancestries Reported - Dutch (%)
Ancestries Reported - English (%)
Ancestries Reported - French (%)
Ancestries Reported - French Canadian (%)
Ancestries Reported - German (%)
Ancestries Reported - Greek (%)
Ancestries Reported - Hungarian (%)
Ancestries Reported - Irish (%)
Ancestries Reported - Italian (%)
Ancestries Reported - Lithuanian (%)
Ancestries Reported - Norwegian (%)
Ancestries Reported - Polish (%)
Ancestries Reported - Portuguese (%)
Ancestries Reported - Russian (%)
Ancestries Reported - Scotch-Irish (%)
Ancestries Reported - Scottish (%)
Ancestries Reported - Slovak (%)
Ancestries Reported - Subsaharan African (%)
Ancestries Reported - Swedish (%)
Ancestries Reported - Swiss (%)
Ancestries Reported - Ukrainian (%)
Ancestries Reported - United States (%)
Ancestries Reported - Welsh (%)
Ancestries Reported - West Indian (%)
Ancestries Reported - Other (%)
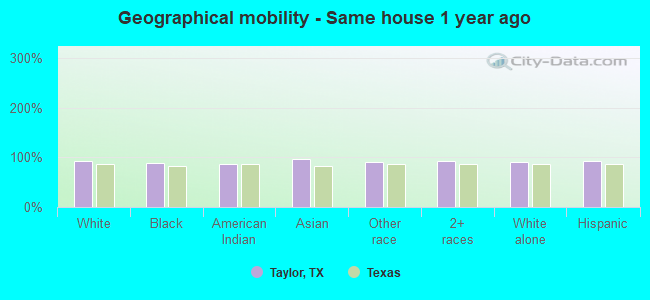
Geographical mobility - Same house 1 year ago (%)
Geographical mobility - Same house 1 year ago (%) - White
Geographical mobility - Same house 1 year ago (%) - Black or African American
Geographical mobility - Same house 1 year ago (%) - Asian
Geographical mobility - Same house 1 year ago (%) - Hispanic or Latino
Geographical mobility - Same house 1 year ago (%) - American Indian and Alaska Native
Geographical mobility - Same house 1 year ago (%) - Multirace
Geographical mobility - Same house 1 year ago (%) - Other Race
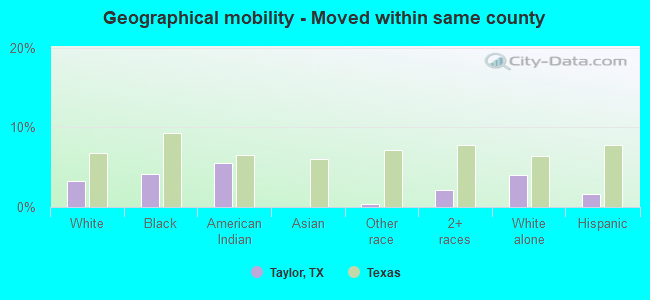
Geographical mobility - Moved within same county (%)
Geographical mobility - Moved within same county (%) - White
Geographical mobility - Moved within same county (%) - Black or African American
Geographical mobility - Moved within same county (%) - Asian
Geographical mobility - Moved within same county (%) - Hispanic or Latino
Geographical mobility - Moved within same county (%) - American Indian and Alaska Native
Geographical mobility - Moved within same county (%) - Multirace
Geographical mobility - Moved within same county (%) - Other Race
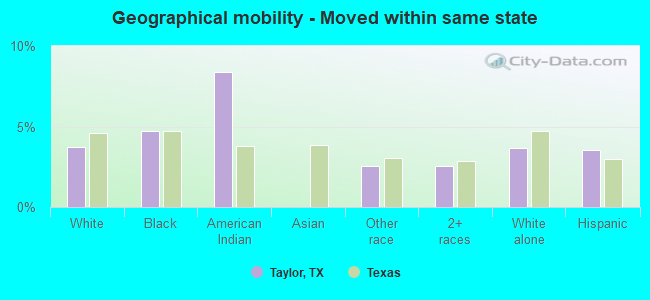
Geographical mobility - Moved from different county within same state (%)
Geographical mobility - Moved from different county within same state (%) - White
Geographical mobility - Moved from different county within same state (%) - Black or African American
Geographical mobility - Moved from different county within same state (%) - Asian
Geographical mobility - Moved from different county within same state (%) - Hispanic or Latino
Geographical mobility - Moved from different county within same state (%) - American Indian and Alaska Native
Geographical mobility - Moved from different county within same state (%) - Multirace
Geographical mobility - Moved from different county within same state (%) - Other Race
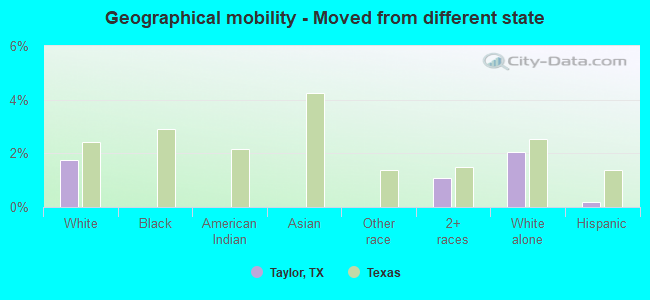
Geographical mobility - Moved from different state (%)
Geographical mobility - Moved from different state (%) - White
Geographical mobility - Moved from different state (%) - Black or African American
Geographical mobility - Moved from different state (%) - Asian
Geographical mobility - Moved from different state (%) - Hispanic or Latino
Geographical mobility - Moved from different state (%) - American Indian and Alaska Native
Geographical mobility - Moved from different state (%) - Multirace
Geographical mobility - Moved from different state (%) - Other Race
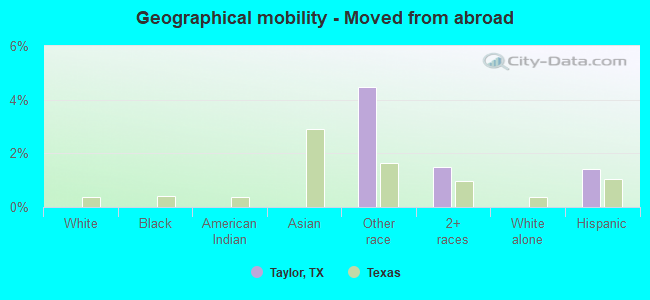
Geographical mobility - Moved from abroad (%)
Geographical mobility - Moved from abroad (%) - White
Geographical mobility - Moved from abroad (%) - Black or African American
Geographical mobility - Moved from abroad (%) - Asian
Geographical mobility - Moved from abroad (%) - Hispanic or Latino
Geographical mobility - Moved from abroad (%) - American Indian and Alaska Native
Geographical mobility - Moved from abroad (%) - Multirace
Geographical mobility - Moved from abroad (%) - Other Race
Place of birth for the foreign-born population - Ireland (%)
Place of birth for the foreign-born population - Denmark (%)
Place of birth for the foreign-born population - Norway (%)
Place of birth for the foreign-born population - Sweden (%)
Place of birth for the foreign-born population - United Kingdom (%)
Place of birth for the foreign-born population - England (%)
Place of birth for the foreign-born population - Scotland (%)
Place of birth for the foreign-born population - Other Northern Europe (%)
Place of birth for the foreign-born population - Austria (%)
Place of birth for the foreign-born population - Belgium (%)
Place of birth for the foreign-born population - France (%)
Place of birth for the foreign-born population - Germany (%)
Place of birth for the foreign-born population - Netherlands (%)
Place of birth for the foreign-born population - Switzerland (%)
Place of birth for the foreign-born population - Other Western Europe (%)
Place of birth for the foreign-born population - Greece (%)
Place of birth for the foreign-born population - Italy (%)
Place of birth for the foreign-born population - Portugal (%)
Place of birth for the foreign-born population - Spain (%)
Place of birth for the foreign-born population - Other Southern Europe (%)
Place of birth for the foreign-born population - Albania (%)
Place of birth for the foreign-born population - Belarus (%)
Place of birth for the foreign-born population - Bosnia and Herzegovina (%)
Place of birth for the foreign-born population - Bulgaria (%)
Place of birth for the foreign-born population - Croatia (%)
Place of birth for the foreign-born population - Czechoslovakia (%)
Place of birth for the foreign-born population - Hungary (%)
Place of birth for the foreign-born population - Latvia (%)
Place of birth for the foreign-born population - Lithuania (%)
Place of birth for the foreign-born population - North Macedonia (Macedonia) (%)
Place of birth for the foreign-born population - Moldova (%)
Place of birth for the foreign-born population - Poland (%)
Place of birth for the foreign-born population - Romania (%)
Place of birth for the foreign-born population - Russia (%)
Place of birth for the foreign-born population - Serbia (%)
Place of birth for the foreign-born population - Ukraine (%)
Place of birth for the foreign-born population - Other Eastern Europe (%)
Place of birth for the foreign-born population - China (%)
Place of birth for the foreign-born population - Hong Kong (%)
Place of birth for the foreign-born population - Taiwan (%)
Place of birth for the foreign-born population - Japan (%)
Place of birth for the foreign-born population - Korea (%)
Place of birth for the foreign-born population - Other Eastern Asia (%)
Place of birth for the foreign-born population - Afghanistan (%)
Place of birth for the foreign-born population - Bangladesh (%)
Place of birth for the foreign-born population - India (%)
Place of birth for the foreign-born population - Iran (%)
Place of birth for the foreign-born population - Kazakhstan (%)
Place of birth for the foreign-born population - Nepal (%)
Place of birth for the foreign-born population - Pakistan (%)
Place of birth for the foreign-born population - Sri Lanka (%)
Place of birth for the foreign-born population - Uzbekistan (%)
Place of birth for the foreign-born population - Other South Central Asia (%)
Place of birth for the foreign-born population - Burma (%)
Place of birth for the foreign-born population - Cambodia (%)
Place of birth for the foreign-born population - Indonesia (%)
Place of birth for the foreign-born population - Laos (%)
Place of birth for the foreign-born population - Malaysia (%)
Place of birth for the foreign-born population - Philippines (%)
Place of birth for the foreign-born population - Singapore (%)
Place of birth for the foreign-born population - Thailand (%)
Place of birth for the foreign-born population - Vietnam (%)
Place of birth for the foreign-born population - Other South Eastern Asia (%)
Place of birth for the foreign-born population - Armenia (%)
Place of birth for the foreign-born population - Iraq (%)
Place of birth for the foreign-born population - Israel (%)
Place of birth for the foreign-born population - Jordan (%)
Place of birth for the foreign-born population - Kuwait (%)
Place of birth for the foreign-born population - Lebanon (%)
Place of birth for the foreign-born population - Saudi Arabia (%)
Place of birth for the foreign-born population - Syria (%)
Place of birth for the foreign-born population - Turkey (%)
Place of birth for the foreign-born population - Yemen (%)
Place of birth for the foreign-born population - Other Western Asia (%)
Place of birth for the foreign-born population - Eritrea (%)
Place of birth for the foreign-born population - Ethiopia (%)
Place of birth for the foreign-born population - Kenya (%)
Place of birth for the foreign-born population - Somalia (%)
Place of birth for the foreign-born population - Uganda (%)
Place of birth for the foreign-born population - Zimbabwe (%)
Place of birth for the foreign-born population - Other Eastern Africa (%)
Place of birth for the foreign-born population - Cameroon (%)
Place of birth for the foreign-born population - Congo (%)
Place of birth for the foreign-born population - Democratic Republic of Congo (Zaire) (%)
Place of birth for the foreign-born population - Other Middle Africa (%)
Place of birth for the foreign-born population - Egypt (%)
Place of birth for the foreign-born population - Morocco (%)
Place of birth for the foreign-born population - Sudan (%)
Place of birth for the foreign-born population - Other Northern Africa (%)
Place of birth for the foreign-born population - South Africa (%)
Place of birth for the foreign-born population - Other Southern Africa (%)
Place of birth for the foreign-born population - Cabo Verde (%)
Place of birth for the foreign-born population - Ghana (%)
Place of birth for the foreign-born population - Liberia (%)
Place of birth for the foreign-born population - Nigeria (%)
Place of birth for the foreign-born population - Senegal (%)
Place of birth for the foreign-born population - Sierra Leone (%)
Place of birth for the foreign-born population - Other Western Africa (%)
Place of birth for the foreign-born population - Australia (%)
Place of birth for the foreign-born population - New Zealand (%)
Place of birth for the foreign-born population - Fiji (%)
Place of birth for the foreign-born population - Micronesia (%)
Place of birth for the foreign-born population - Bahamas (%)
Place of birth for the foreign-born population - Barbados (%)
Place of birth for the foreign-born population - Cuba (%)
Place of birth for the foreign-born population - Dominica (%)
Place of birth for the foreign-born population - Dominican Republic (%)
Place of birth for the foreign-born population - Grenada (%)
Place of birth for the foreign-born population - Haiti (%)
Place of birth for the foreign-born population - Jamaica (%)
Place of birth for the foreign-born population - St. Vincent and the Grenadines (%)
Place of birth for the foreign-born population - Trinidad and Tobago (%)
Place of birth for the foreign-born population - West Indies (%)
Place of birth for the foreign-born population - Other Caribbean (%)
Place of birth for the foreign-born population - Belize (%)
Place of birth for the foreign-born population - Costa Rica (%)
Place of birth for the foreign-born population - El Salvador (%)
Place of birth for the foreign-born population - Guatemala (%)
Place of birth for the foreign-born population - Honduras (%)
Place of birth for the foreign-born population - Mexico (%)
Place of birth for the foreign-born population - Nicaragua (%)
Place of birth for the foreign-born population - Panama (%)
Place of birth for the foreign-born population - Other Central America (%)
Place of birth for the foreign-born population - Argentina (%)
Place of birth for the foreign-born population - Bolivia (%)
Place of birth for the foreign-born population - Brazil (%)
Place of birth for the foreign-born population - Chile (%)
Place of birth for the foreign-born population - Colombia (%)
Place of birth for the foreign-born population - Ecuador (%)
Place of birth for the foreign-born population - Guyana (%)
Place of birth for the foreign-born population - Peru (%)
Place of birth for the foreign-born population - Uruguay (%)
Place of birth for the foreign-born population - Venezuela (%)
Place of birth for the foreign-born population - Other South America (%)
Place of birth for the foreign-born population - Canada (%)
Place of birth for the foreign-born population - Other Northern America (%)
Place of birth for the foreign-born population - Other (%)
Latest news about races in Taylor, TX collected exclusively by city-data.com from local newspapers, TV, and radio stations
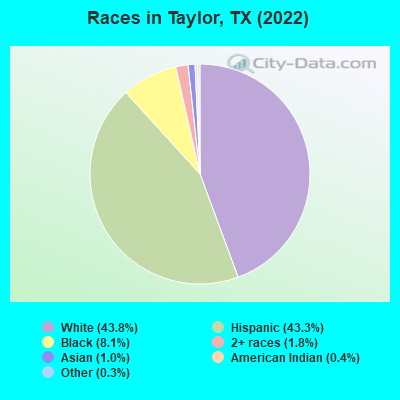
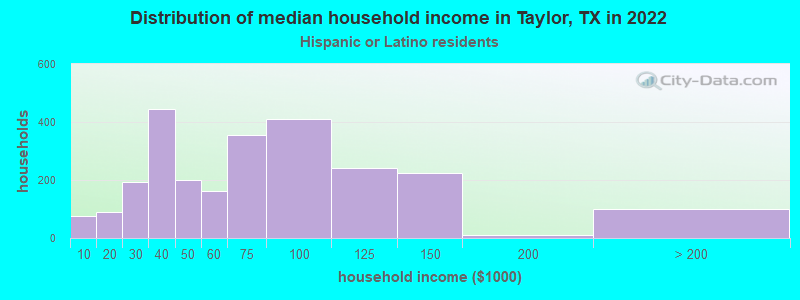
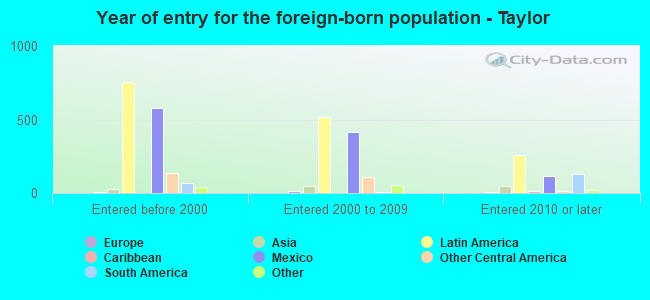
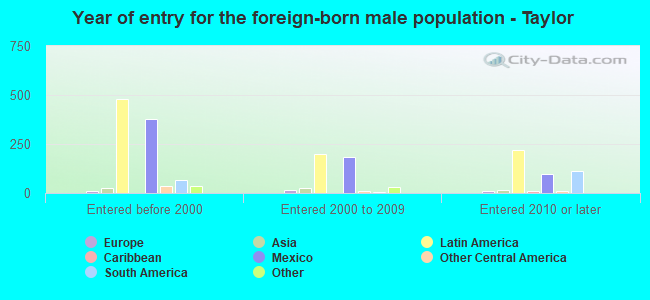
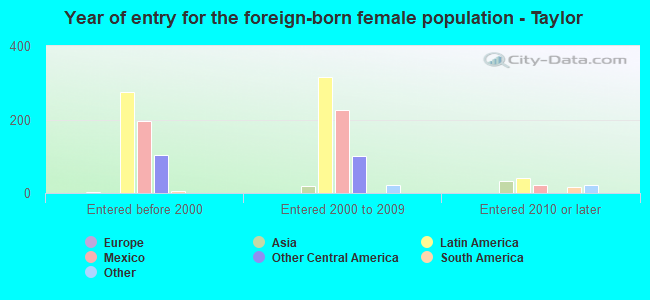
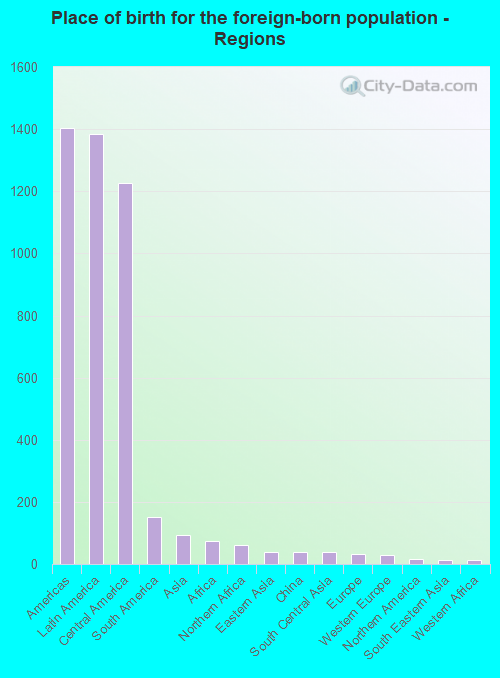
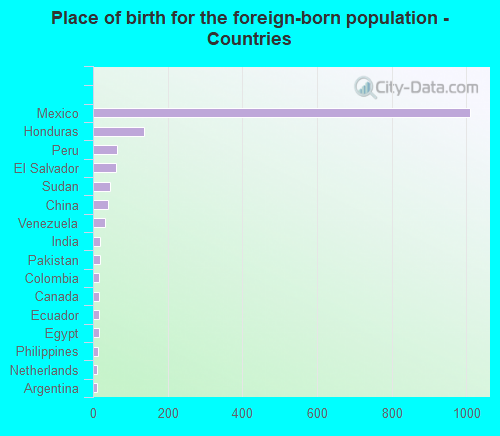
According to 2022 data, the most numerous races in Taylor, TX are Hispanic (7,747 residents), White alone (7,840 residents), and Black alone (1,441 residents). 71.2% of Taylor residents speak English at home. 9.0% of Taylor, TX residents are foreign-born (8.1% born in Latin America), which is 89.7% less than the foreign-born rate of 17.0% across the entire state of Texas.
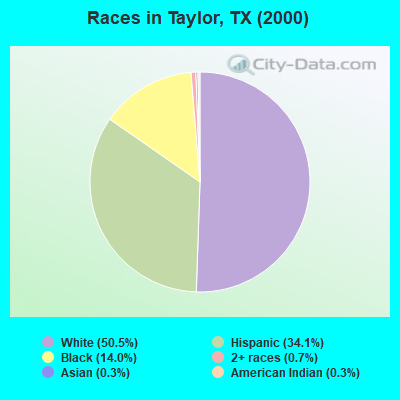
Race distribution in Taylor
2000 2022
10,933,313 52.4% White alone 6,669,666 32.0% Hispanic 2,364,255 11.3% Black alone 554,445 2.7% Asian alone 230,567 1.1% Two or more races 68,859 0.3% American Indian alone 19,958 0.10% Other race alone 10,757 0.05% Native Hawaiian and Other
12,070,642 40.2% Hispanic 11,683,430 38.9% White alone 3,508,706 11.7% Black alone 1,608,173 5.4% Asian alone 956,560 3.2% Two or more races 125,763 0.4% Other race alone 47,023 0.2% American Indian alone 29,275 0.10% Native Hawaiian and Other
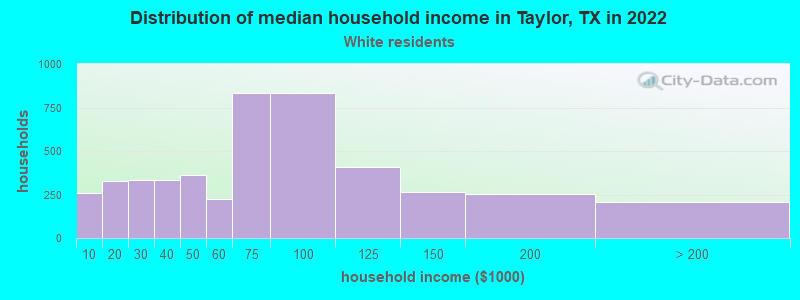
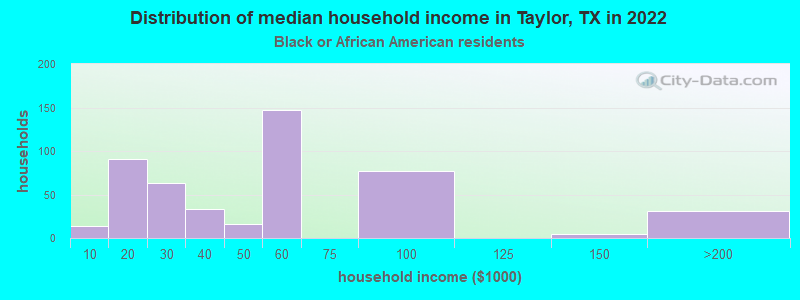
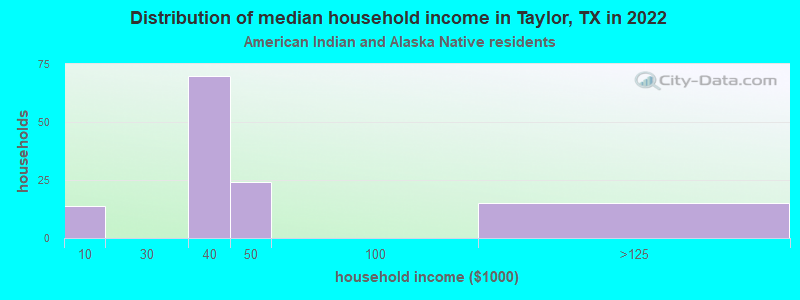
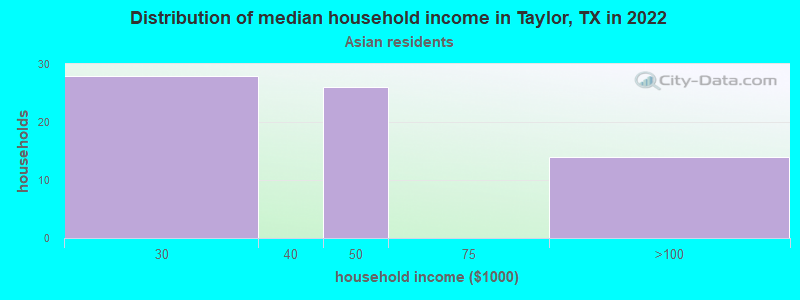
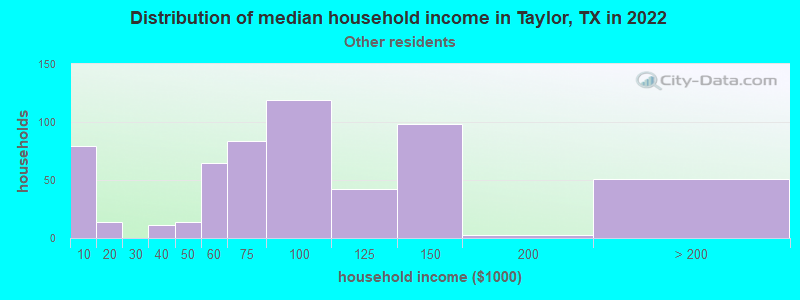
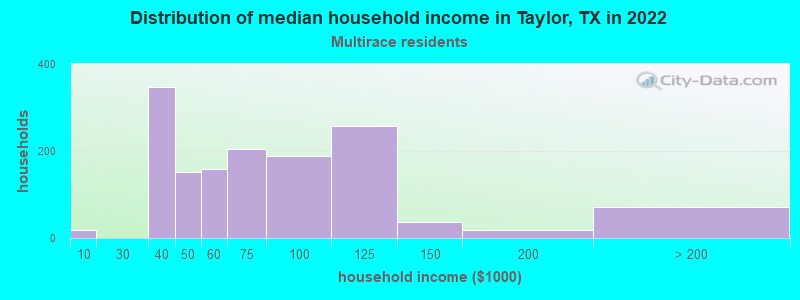
Income and house value in Taylor Median household income in 2022 $67,288 White non-Hispanic householders$38,638 Black householders$55,552 American Indian and Alaska Native householders$41,369 Asian householders$75,964 Some other race householders$62,984 Two or more races householders$65,675 Hispanic or Latino race householdersMedian 2022 house value $328,150 White Non-Hispanic householders$158,262 Black or African American householders $356,278 Asian householders$206,266 Some other race householders$356,278 Two or more races householders$214,516 Hispanic or Latino householders
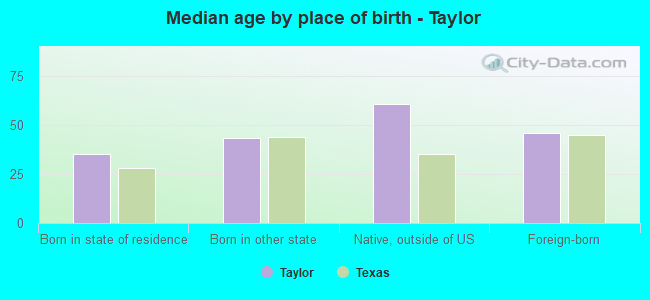
Median age by race in Taylor
44.2 Median age for White residents43.3 44.7 37.4 Median age for Black or African American residents33.7 44.8 53.3 Median age for American Indian / Alaska Native residents-897,347,173.3 37.2 36.8 Median age for Asian residents47.8 27.8 -682,125,603.2 Median age for Native Hawaiian / Pacific Islander residents-612,729,233.5 -577,777,777.2 45.5 Median age for Other race residents45.6 45.7 27.2 Median age for Two or more races residents21.9 33.9 51.1 Median age for White alone residents50.7 51.7 30.5 Median age for Hispanic or Latino residents28.0 30.6
Owner/renter occupied households by race in Taylor
House owners and renters - White residents 3,461 74.9% Owner occupied1,160 25.1% Renter occupiedHouse owners and renters - Black or African American residents 208 45.5% Owner occupied249 54.5% Renter occupiedHouse owners and renters - American Indian / Alaska Native residents 97 74.7% Owner occupied33 25.3% Renter occupiedHouse owners and renters - Asian residents 41 65.5% Owner occupied22 34.5% Renter occupiedHouse owners and renters - Other race residents 559 81.9% Owner occupied124 18.1% Renter occupiedHouse owners and renters - Two or more races residents 712 49.9% Owner occupied714 50.1% Renter occupiedHouse owners and renters - White alone residents 3,199 82.6% Owner occupied676 17.4% Renter occupiedHouse owners and renters - Hispanic or Latino residents 1,326 51.9% Owner occupied1,229 48.1% Renter occupied
Language usage in Taylor
English speakers - Total 71.2% of residents of Taylor speak English at home.
23.6% of residents speak Spanish at home 2,407 61.4% Speak English very well1,515 38.6% Speak English less than very well4.3% of residents speak other language at home 550 77.5% Speak English very well160 22.5% Speak English less than very well
English speakers - Born in the United States 89.6% of residents of Taylor speak English at home.
8.7% of residents speak Spanish at home 233 73.3% Speak English very well85 26.7% Speak English less than very well1.8% of residents speak other language at home 64 100.0% Speak English very well
English speakers - Native, born elsewhere 70.2% of residents of Taylor speak English at home.
19.3% of residents speak Spanish at home 11 50.0% Speak English very well11 50.0% Speak English less than very well
English speakers - Foreign-born 9.3% of residents of Taylor speak English at home.
71.2% of residents speak Spanish at home 191 14.1% Speak English very well1,165 85.9% Speak English less than very well14.0% of residents speak other language at home 125 46.8% Speak English very well142 53.2% Speak English less than very well
White (Caucasian) - Speak only English Native:
87.7% (7,939)Foreign-born:
10.7% (56)
White (Caucasian) - Speak another language Native:
10.0% (902)Foreign-born:
86.5% (455)
Black or African American - Speak another language Native:
5.2% (63)Foreign-born:
95.7% (109)
American Indian / Alaska Native - Speak another language Native:
13.4% (17)Foreign-born:
98.9% (145)
Asian - Speak another language Native:
57.8% (34)Foreign-born:
100.0% (117)
Other race - Speak only English Native:
47.8% (604)Foreign-born:
2.1% (11)
Other race - Speak another language Native:
51.8% (654)Foreign-born:
99.2% (526)
Two or more races - Speak only English Native:
62.6% (2,050)Foreign-born:
15.7% (85)
Two or more races - Speak another language Native:
37.9% (1,243)Foreign-born:
76.6% (416)
White alone - Speak only English Native:
95.0% (7,156)Foreign-born:
41.9% (21)
White alone - Speak another language Native:
4.9% (371)Foreign-born:
55.8% (28)
Hispanic or Latino - Speak only English Native:
53.3% (2,807)Foreign-born:
6.7% (100)
Hispanic or Latino - Speak another language Native:
47.2% (2,485)Foreign-born:
91.7% (1,368)
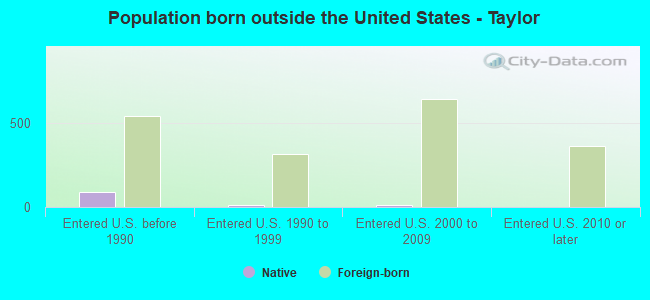
Foreign-born residents in Taylor 1,603 residents are foreign born (8.1% Latin America ).
This city:
9.0%Texas:
17.1%
Marital status for residents in Taylor Marital status - White (Caucasian) population 15 years and over
Males 22.5% Never married56.2% Now married2.5% Separated5.3% Widowed13.6% DivorcedFemales 24.4% Never married47.2% Now married1.3% Separated11.2% Widowed16.0% DivorcedWomen who gave birth in the past 12 months Now married:
62.4% (108)Unmarried:
37.6% (65)
Women who did not give birth in the past 12 months Now married:
41.2% (840)Unmarried:
58.8% (1,198)
Marital status - Black or African American population 15 years and over
Males 36.8% Never married51.6% Now married0.0% Separated5.4% Widowed6.2% DivorcedFemales 27.3% Never married44.0% Now married16.7% Separated10.3% Widowed1.6% DivorcedWomen who gave birth in the past 12 months Now married:
100.0% (26)Unmarried:
0.0% (0)
Women who did not give birth in the past 12 months Now married:
52.9% (163)Unmarried:
47.1% (145)
Marital status - American Indian / Alaska Native population 15 years and over
Males 0.0% Never married100.0% Now married0.0% Separated0.0% Widowed0.0% DivorcedFemales 26.9% Never married73.1% Now married0.0% Separated0.0% Widowed0.0% DivorcedWomen who did not give birth in the past 12 months Now married:
60.3% (63)Unmarried:
39.7% (42)
Marital status - Asian population 15 years and over
Males 0.0% Never married100.0% Now married0.0% Separated0.0% Widowed0.0% DivorcedFemales 0.0% Never married100.0% Now married0.0% Separated0.0% Widowed0.0% DivorcedWomen who did not give birth in the past 12 months Now married:
100.0% (54)Unmarried:
0.0% (0)
Marital status - Other race population 15 years and over
Males 21.5% Never married60.9% Now married9.7% Separated0.0% Widowed7.9% DivorcedFemales 13.5% Never married51.1% Now married11.0% Separated3.3% Widowed21.2% DivorcedWomen who gave birth in the past 12 months Now married:
100.0% (29)Unmarried:
0.0% (0)
Women who did not give birth in the past 12 months Now married:
65.3% (166)Unmarried:
34.7% (88)
Marital status - Two or more races population 15 years and over
Males 45.0% Never married38.2% Now married4.2% Separated0.8% Widowed11.6% DivorcedFemales 28.1% Never married33.8% Now married4.3% Separated16.1% Widowed17.8% DivorcedWomen who did not give birth in the past 12 months Now married:
28.8% (326)Unmarried:
71.2% (807)
Marital status - White alone, not Hispanic / Latino population 15 years and over
Males 20.0% Never married57.8% Now married2.6% Separated6.4% Widowed13.2% DivorcedFemales 21.3% Never married52.2% Now married0.6% Separated13.1% Widowed13.0% DivorcedWomen who gave birth in the past 12 months Now married:
84.2% (81)Unmarried:
15.8% (15)
Women who did not give birth in the past 12 months Now married:
46.0% (690)Unmarried:
54.0% (810)
Marital status - Hispanic or Latino population 15 years and over
Males 34.1% Never married49.3% Now married3.9% Separated0.4% Widowed12.2% DivorcedFemales 28.8% Never married35.5% Now married4.9% Separated9.5% Widowed21.3% DivorcedWomen who gave birth in the past 12 months Now married:
49.5% (62)Unmarried:
50.5% (63)
Women who did not give birth in the past 12 months Now married:
33.5% (592)Unmarried:
66.5% (1,177)
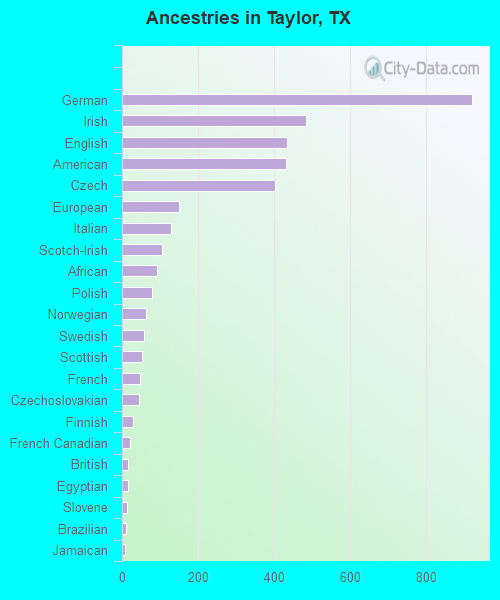
Ancestries in Taylor
920 10.2% German484 5.4% Irish434 4.8% English432 4.8% American402 4.5% Czech150 1.7% European129 1.4% Italian105 1.2% Scotch-Irish91 1.0% African80 0.9% Polish63 0.7% Norwegian58 0.6% Swedish53 0.6% Scottish47 0.5% French45 0.5% Czechoslovakian28 0.3% Finnish22 0.2% French Canadian16 0.2% British15 0.2% Egyptian12 0.1% Slovene10 0.1% Brazilian9 0.10% Jamaican8 0.09% Croatian8 0.09% Portuguese5 0.06% Hungarian3 0.03% Ethiopian2 0.02% Eastern European2 0.02% Scandinavian
Geographical mobility in Taylor Same house 1 year ago 9,108 91.9% White (Caucasian)1,271 87.7% Black or African American222 85.8% American Indian / Alaska Native168 96.2% Asian1,662 90.6% Other race4,196 92.5% Two or more races7,050 90.6% White alone, not Hispanic / Latino7,066 92.8% Hispanic or LatinoMoved within same county 317 3.2% White / Caucasian60 4.2% Black or African American14 5.5% American Indian / Alaska Native7 0.4% Other race99 2.2% Two or more races311 4.0% White alone, not Hispanic / Latino123 1.6% Hispanic or LatinoMoved within same state 372 3.7% White / Caucasian69 4.7% Black or African American22 8.4% American Indian / Alaska Native47 2.6% Other race114 2.5% Two or more races283 3.6% White alone, not Hispanic / Latino269 3.5% Hispanic or LatinoMoved from different state 174 1.8% White / Caucasian49 1.1% Two or more races159 2.0% White alone, not Hispanic / Latino16 0.2% Hispanic or LatinoMoved from abroad 82 4.5% Other race68 1.5% Two or more races108 1.4% Hispanic or Latino
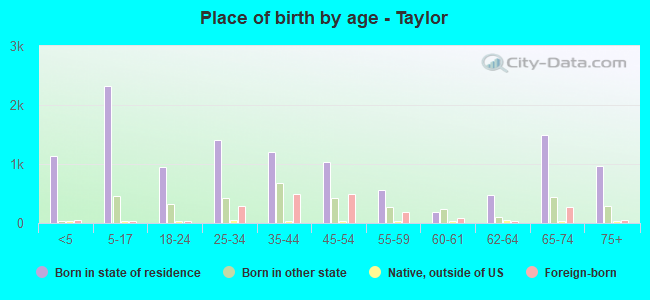
Children Nativity (place of birth) in Taylor
Children under 6 years - Living with two parents Both parents native 482 100.0% NativeBoth parents foreign-born 72 100.0% NativeOne native, one foreign-born parent 52 100.0% NativeChildren under 6 years - Living with one parent Native parent 510 100.0% NativeForeign-born parent 194 83.6% Native38 16.4% Foreign-bornChildren 6 to 17 years - Living with two parents Both parents native 1,014 100.0% NativeBoth parents foreign-born 168 100.0% NativeOne native, one foreign-born parent 150 100.0% NativeChildren 6 to 17 years - Living with one parent Native parent 590 100.0% NativeForeign-born parent 604 48.1% Native651 51.9% Foreign-born
Grandparents responsible for own grandchildren in Taylor
Grandparents (30 to 59 years) White / Caucasian 4 8.0% Responsible for grandchildren40 92.0% Not responsible for grandchildrenBlack or African American 7 100.0% Not responsible for grandchildrenTwo or more races 10 100.0% Responsible for grandchildrenWhite alone, not Hispanic / Latino 11 100.0% Not responsible for grandchildrenHispanic or Latino 3 6.1% Responsible for grandchildren52 93.9% Not responsible for grandchildrenGrandparents (60 years and over) White / Caucasian 49 38.7% Responsible for grandchildren77 61.3% Not responsible for grandchildrenBlack or African American 31 100.0% Responsible for grandchildrenTwo or more races 15 100.0% Responsible for grandchildrenWhite alone, not Hispanic / Latino 28 31.1% Responsible for grandchildren61 68.9% Not responsible for grandchildrenHispanic or Latino 4 18.9% Responsible for grandchildren18 81.1% Not responsible for grandchildren