Races in The Colony, Texas (TX) Detailed Stats
Data:
Races - White alone (%)
Races - White alone (% change since 2000)
Races - Black alone (%)
Races - Black alone (% change since 2000)
Races - American Indian alone (%)
Races - American Indian alone (% change since 2000)
Races - Asian alone (%)
Races - Asian alone (% change since 2000)
Races - Hispanic (%)
Races - Hispanic (% change since 2000)
Races - Native Hawaiian and Other Pacific Islander alone (%)
Races - Native Hawaiian and Other Pacific Islander alone (% change since 2000)
Races - Two or more races(%)
Races - Two or more races(% change since 2000)
Races - Other race alone (%)
Races - Other race alone (% change since 2000)
Racial diversity
Place of birth - Born in state of residence (%)
Place of birth - Born in state of residence (%) - White
Place of birth - Born in state of residence (%) - Black or African American
Place of birth - Born in state of residence (%) - Asian
Place of birth - Born in state of residence (%) - Hispanic or Latino
Place of birth - Born in state of residence (%) - American Indian and Alaska Native
Place of birth - Born in state of residence (%) - Multirace
Place of birth - Born in state of residence (%) - Other Race
Place of birth - Born in other state (%)
Place of birth - Born in other state (%) - White
Place of birth - Born in other state (%) - Black or African American
Place of birth - Born in other state (%) - Asian
Place of birth - Born in other state (%) - Hispanic or Latino
Place of birth - Born in other state (%) - American Indian and Alaska Native
Place of birth - Born in other state (%) - Multirace
Place of birth - Born in other state (%) - Other Race
Place of birth - Native, outside of US (%)
Place of birth - Native, outside of US (%) - White
Place of birth - Native, outside of US (%) - Black or African American
Place of birth - Native, outside of US (%) - Asian
Place of birth - Native, outside of US (%) - Hispanic or Latino
Place of birth - Native, outside of US (%) - American Indian and Alaska Native
Place of birth - Native, outside of US (%) - Multirace
Place of birth - Native, outside of US (%) - Other Race
Place of birth - Foreign born (%)
Place of birth - Foreign born (%) - White
Place of birth - Foreign born (%) - Black or African American
Place of birth - Foreign born (%) - Asian
Place of birth - Foreign born (%) - Hispanic or Latino
Place of birth - Foreign born (%) - American Indian and Alaska Native
Place of birth - Foreign born (%) - Multirace
Place of birth - Foreign born (%) - Other Race
Residents speaking English at home (%)
Residents speaking English at home - Born in the United States (%)
Residents speaking English at home - Native, born elsewhere (%)
Residents speaking English at home - Foreign born (%)
Residents speaking Spanish at home (%)
Residents speaking Spanish at home - Born in the United States (%)
Residents speaking Spanish at home - Native, born elsewhere (%)
Residents speaking Spanish at home - Foreign born (%)
Residents speaking other language at home (%)
Residents speaking other language at home - Born in the United States (%)
Residents speaking other language at home - Native, born elsewhere (%)
Residents speaking other language at home - Foreign born (%)
Marital status - Never married (%)
Marital status - Now married (%)
Marital status - Separated (%)
Marital status - Widowed (%)
Marital status - Divorced (%)
Ancestries Reported - Arab (%)
Ancestries Reported - Czech (%)
Ancestries Reported - Danish (%)
Ancestries Reported - Dutch (%)
Ancestries Reported - English (%)
Ancestries Reported - French (%)
Ancestries Reported - French Canadian (%)
Ancestries Reported - German (%)
Ancestries Reported - Greek (%)
Ancestries Reported - Hungarian (%)
Ancestries Reported - Irish (%)
Ancestries Reported - Italian (%)
Ancestries Reported - Lithuanian (%)
Ancestries Reported - Norwegian (%)
Ancestries Reported - Polish (%)
Ancestries Reported - Portuguese (%)
Ancestries Reported - Russian (%)
Ancestries Reported - Scotch-Irish (%)
Ancestries Reported - Scottish (%)
Ancestries Reported - Slovak (%)
Ancestries Reported - Subsaharan African (%)
Ancestries Reported - Swedish (%)
Ancestries Reported - Swiss (%)
Ancestries Reported - Ukrainian (%)
Ancestries Reported - United States (%)
Ancestries Reported - Welsh (%)
Ancestries Reported - West Indian (%)
Ancestries Reported - Other (%)
Geographical mobility - Same house 1 year ago (%)
Geographical mobility - Same house 1 year ago (%) - White
Geographical mobility - Same house 1 year ago (%) - Black or African American
Geographical mobility - Same house 1 year ago (%) - Asian
Geographical mobility - Same house 1 year ago (%) - Hispanic or Latino
Geographical mobility - Same house 1 year ago (%) - American Indian and Alaska Native
Geographical mobility - Same house 1 year ago (%) - Multirace
Geographical mobility - Same house 1 year ago (%) - Other Race
Geographical mobility - Moved within same county (%)
Geographical mobility - Moved within same county (%) - White
Geographical mobility - Moved within same county (%) - Black or African American
Geographical mobility - Moved within same county (%) - Asian
Geographical mobility - Moved within same county (%) - Hispanic or Latino
Geographical mobility - Moved within same county (%) - American Indian and Alaska Native
Geographical mobility - Moved within same county (%) - Multirace
Geographical mobility - Moved within same county (%) - Other Race
Geographical mobility - Moved from different county within same state (%)
Geographical mobility - Moved from different county within same state (%) - White
Geographical mobility - Moved from different county within same state (%) - Black or African American
Geographical mobility - Moved from different county within same state (%) - Asian
Geographical mobility - Moved from different county within same state (%) - Hispanic or Latino
Geographical mobility - Moved from different county within same state (%) - American Indian and Alaska Native
Geographical mobility - Moved from different county within same state (%) - Multirace
Geographical mobility - Moved from different county within same state (%) - Other Race
Geographical mobility - Moved from different state (%)
Geographical mobility - Moved from different state (%) - White
Geographical mobility - Moved from different state (%) - Black or African American
Geographical mobility - Moved from different state (%) - Asian
Geographical mobility - Moved from different state (%) - Hispanic or Latino
Geographical mobility - Moved from different state (%) - American Indian and Alaska Native
Geographical mobility - Moved from different state (%) - Multirace
Geographical mobility - Moved from different state (%) - Other Race
Geographical mobility - Moved from abroad (%)
Geographical mobility - Moved from abroad (%) - White
Geographical mobility - Moved from abroad (%) - Black or African American
Geographical mobility - Moved from abroad (%) - Asian
Geographical mobility - Moved from abroad (%) - Hispanic or Latino
Geographical mobility - Moved from abroad (%) - American Indian and Alaska Native
Geographical mobility - Moved from abroad (%) - Multirace
Geographical mobility - Moved from abroad (%) - Other Race
Place of birth for the foreign-born population - Ireland (%)
Place of birth for the foreign-born population - Denmark (%)
Place of birth for the foreign-born population - Norway (%)
Place of birth for the foreign-born population - Sweden (%)
Place of birth for the foreign-born population - United Kingdom (%)
Place of birth for the foreign-born population - England (%)
Place of birth for the foreign-born population - Scotland (%)
Place of birth for the foreign-born population - Other Northern Europe (%)
Place of birth for the foreign-born population - Austria (%)
Place of birth for the foreign-born population - Belgium (%)
Place of birth for the foreign-born population - France (%)
Place of birth for the foreign-born population - Germany (%)
Place of birth for the foreign-born population - Netherlands (%)
Place of birth for the foreign-born population - Switzerland (%)
Place of birth for the foreign-born population - Other Western Europe (%)
Place of birth for the foreign-born population - Greece (%)
Place of birth for the foreign-born population - Italy (%)
Place of birth for the foreign-born population - Portugal (%)
Place of birth for the foreign-born population - Spain (%)
Place of birth for the foreign-born population - Other Southern Europe (%)
Place of birth for the foreign-born population - Albania (%)
Place of birth for the foreign-born population - Belarus (%)
Place of birth for the foreign-born population - Bosnia and Herzegovina (%)
Place of birth for the foreign-born population - Bulgaria (%)
Place of birth for the foreign-born population - Croatia (%)
Place of birth for the foreign-born population - Czechoslovakia (%)
Place of birth for the foreign-born population - Hungary (%)
Place of birth for the foreign-born population - Latvia (%)
Place of birth for the foreign-born population - Lithuania (%)
Place of birth for the foreign-born population - North Macedonia (Macedonia) (%)
Place of birth for the foreign-born population - Moldova (%)
Place of birth for the foreign-born population - Poland (%)
Place of birth for the foreign-born population - Romania (%)
Place of birth for the foreign-born population - Russia (%)
Place of birth for the foreign-born population - Serbia (%)
Place of birth for the foreign-born population - Ukraine (%)
Place of birth for the foreign-born population - Other Eastern Europe (%)
Place of birth for the foreign-born population - China (%)
Place of birth for the foreign-born population - Hong Kong (%)
Place of birth for the foreign-born population - Taiwan (%)
Place of birth for the foreign-born population - Japan (%)
Place of birth for the foreign-born population - Korea (%)
Place of birth for the foreign-born population - Other Eastern Asia (%)
Place of birth for the foreign-born population - Afghanistan (%)
Place of birth for the foreign-born population - Bangladesh (%)
Place of birth for the foreign-born population - India (%)
Place of birth for the foreign-born population - Iran (%)
Place of birth for the foreign-born population - Kazakhstan (%)
Place of birth for the foreign-born population - Nepal (%)
Place of birth for the foreign-born population - Pakistan (%)
Place of birth for the foreign-born population - Sri Lanka (%)
Place of birth for the foreign-born population - Uzbekistan (%)
Place of birth for the foreign-born population - Other South Central Asia (%)
Place of birth for the foreign-born population - Burma (%)
Place of birth for the foreign-born population - Cambodia (%)
Place of birth for the foreign-born population - Indonesia (%)
Place of birth for the foreign-born population - Laos (%)
Place of birth for the foreign-born population - Malaysia (%)
Place of birth for the foreign-born population - Philippines (%)
Place of birth for the foreign-born population - Singapore (%)
Place of birth for the foreign-born population - Thailand (%)
Place of birth for the foreign-born population - Vietnam (%)
Place of birth for the foreign-born population - Other South Eastern Asia (%)
Place of birth for the foreign-born population - Armenia (%)
Place of birth for the foreign-born population - Iraq (%)
Place of birth for the foreign-born population - Israel (%)
Place of birth for the foreign-born population - Jordan (%)
Place of birth for the foreign-born population - Kuwait (%)
Place of birth for the foreign-born population - Lebanon (%)
Place of birth for the foreign-born population - Saudi Arabia (%)
Place of birth for the foreign-born population - Syria (%)
Place of birth for the foreign-born population - Turkey (%)
Place of birth for the foreign-born population - Yemen (%)
Place of birth for the foreign-born population - Other Western Asia (%)
Place of birth for the foreign-born population - Eritrea (%)
Place of birth for the foreign-born population - Ethiopia (%)
Place of birth for the foreign-born population - Kenya (%)
Place of birth for the foreign-born population - Somalia (%)
Place of birth for the foreign-born population - Uganda (%)
Place of birth for the foreign-born population - Zimbabwe (%)
Place of birth for the foreign-born population - Other Eastern Africa (%)
Place of birth for the foreign-born population - Cameroon (%)
Place of birth for the foreign-born population - Congo (%)
Place of birth for the foreign-born population - Democratic Republic of Congo (Zaire) (%)
Place of birth for the foreign-born population - Other Middle Africa (%)
Place of birth for the foreign-born population - Egypt (%)
Place of birth for the foreign-born population - Morocco (%)
Place of birth for the foreign-born population - Sudan (%)
Place of birth for the foreign-born population - Other Northern Africa (%)
Place of birth for the foreign-born population - South Africa (%)
Place of birth for the foreign-born population - Other Southern Africa (%)
Place of birth for the foreign-born population - Cabo Verde (%)
Place of birth for the foreign-born population - Ghana (%)
Place of birth for the foreign-born population - Liberia (%)
Place of birth for the foreign-born population - Nigeria (%)
Place of birth for the foreign-born population - Senegal (%)
Place of birth for the foreign-born population - Sierra Leone (%)
Place of birth for the foreign-born population - Other Western Africa (%)
Place of birth for the foreign-born population - Australia (%)
Place of birth for the foreign-born population - New Zealand (%)
Place of birth for the foreign-born population - Fiji (%)
Place of birth for the foreign-born population - Micronesia (%)
Place of birth for the foreign-born population - Bahamas (%)
Place of birth for the foreign-born population - Barbados (%)
Place of birth for the foreign-born population - Cuba (%)
Place of birth for the foreign-born population - Dominica (%)
Place of birth for the foreign-born population - Dominican Republic (%)
Place of birth for the foreign-born population - Grenada (%)
Place of birth for the foreign-born population - Haiti (%)
Place of birth for the foreign-born population - Jamaica (%)
Place of birth for the foreign-born population - St. Vincent and the Grenadines (%)
Place of birth for the foreign-born population - Trinidad and Tobago (%)
Place of birth for the foreign-born population - West Indies (%)
Place of birth for the foreign-born population - Other Caribbean (%)
Place of birth for the foreign-born population - Belize (%)
Place of birth for the foreign-born population - Costa Rica (%)
Place of birth for the foreign-born population - El Salvador (%)
Place of birth for the foreign-born population - Guatemala (%)
Place of birth for the foreign-born population - Honduras (%)
Place of birth for the foreign-born population - Mexico (%)
Place of birth for the foreign-born population - Nicaragua (%)
Place of birth for the foreign-born population - Panama (%)
Place of birth for the foreign-born population - Other Central America (%)
Place of birth for the foreign-born population - Argentina (%)
Place of birth for the foreign-born population - Bolivia (%)
Place of birth for the foreign-born population - Brazil (%)
Place of birth for the foreign-born population - Chile (%)
Place of birth for the foreign-born population - Colombia (%)
Place of birth for the foreign-born population - Ecuador (%)
Place of birth for the foreign-born population - Guyana (%)
Place of birth for the foreign-born population - Peru (%)
Place of birth for the foreign-born population - Uruguay (%)
Place of birth for the foreign-born population - Venezuela (%)
Place of birth for the foreign-born population - Other South America (%)
Place of birth for the foreign-born population - Canada (%)
Place of birth for the foreign-born population - Other Northern America (%)
Place of birth for the foreign-born population - Other (%)
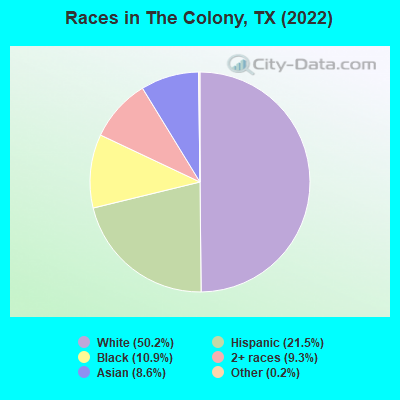
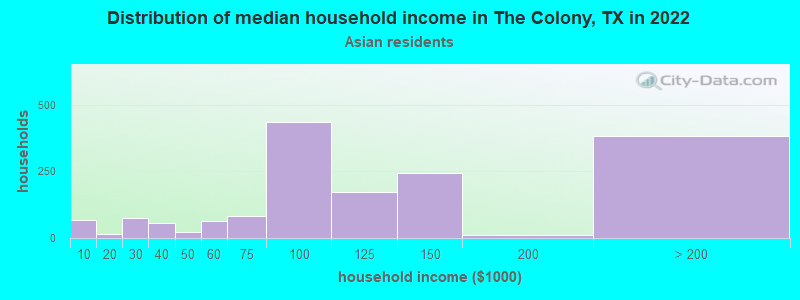
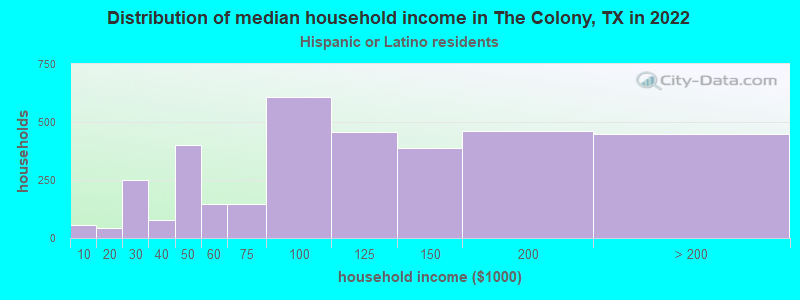
According to 2022 data, the most numerous races in The Colony, TX are Hispanic (10,175 residents), White alone (23,773 residents), and Black alone (5,174 residents). 77.3% of The Colony residents speak English at home. 13.2% of The Colony, TX residents are foreign-born (5.8% born in Latin America, 5.7% born in Asia), which is 28.3% less than the foreign-born rate of 17.0% across the entire state of Texas.
Race distribution in The Colony
2000 2022
10,933,313 52.4% White alone 6,669,666 32.0% Hispanic 2,364,255 11.3% Black alone 554,445 2.7% Asian alone 230,567 1.1% Two or more races 68,859 0.3% American Indian alone 19,958 0.10% Other race alone 10,757 0.05% Native Hawaiian and Other
12,070,642 40.2% Hispanic 11,683,430 38.9% White alone 3,508,706 11.7% Black alone 1,608,173 5.4% Asian alone 956,560 3.2% Two or more races 125,763 0.4% Other race alone 47,023 0.2% American Indian alone 29,275 0.10% Native Hawaiian and Other
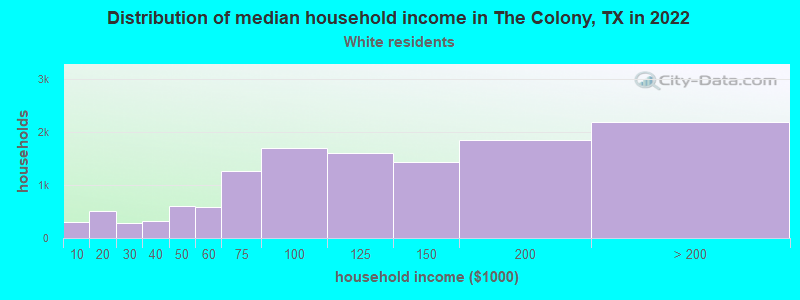
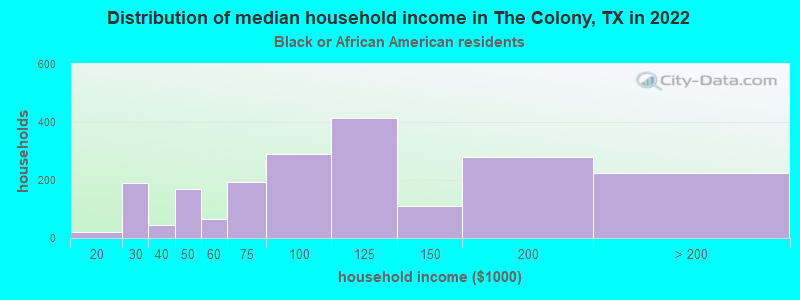
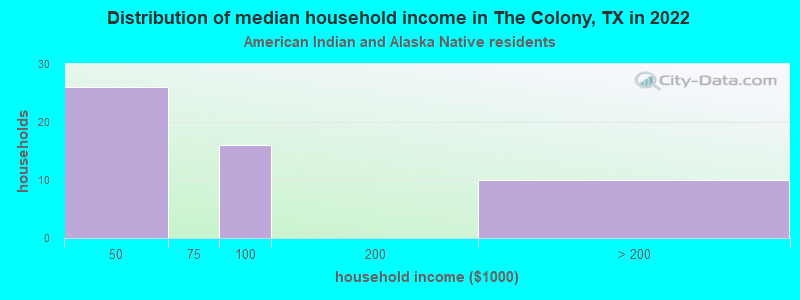
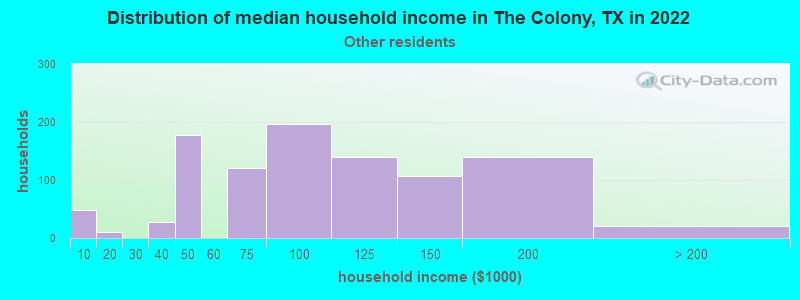
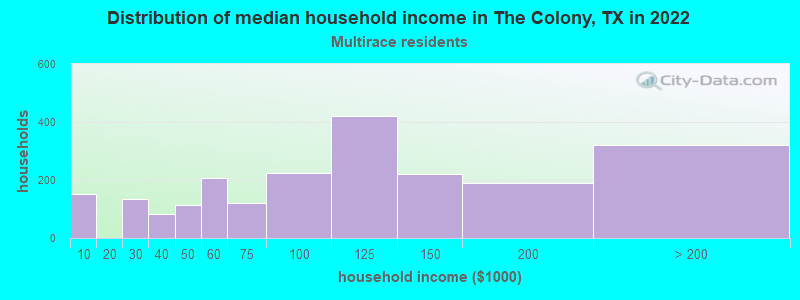
Income and house value in The Colony Median household income in 2022 $113,857 White non-Hispanic householders$95,269 Black householders$100,277 Asian householders$90,784 Some other race householders$108,257 Two or more races householders$104,494 Hispanic or Latino race householdersMedian 2022 house value $369,559 White Non-Hispanic householders$399,742 Black or African American householders$332,796 American Indian or Alaska Native householders $478,685 Asian householders$361,045 Some other race householders$447,340 Two or more races householders$349,436 Hispanic or Latino householders
Median age by race in The Colony
41.0 Median age for White residents40.5 41.6 37.4 Median age for Black or African American residents36.2 41.8 49.2 Median age for American Indian / Alaska Native residents49.8 54.1 39.8 Median age for Asian residents42.1 38.4 -305,343,511.1 Median age for Native Hawaiian / Pacific Islander residents-601,801,801.2 -656,771,799.0 34.1 Median age for Other race residents33.3 34.8 25.0 Median age for Two or more races residents27.8 24.0 40.1 Median age for White alone residents39.8 40.5 38.1 Median age for Hispanic or Latino residents38.4 37.9
Owner/renter occupied households by race in The Colony
House owners and renters - White residents 7,645 60.1% Owner occupied5,085 39.9% Renter occupiedHouse owners and renters - Black or African American residents 1,295 64.3% Owner occupied719 35.7% Renter occupiedHouse owners and renters - American Indian / Alaska Native residents 67 100.0% Owner occupiedHouse owners and renters - Asian residents 1,241 78.1% Owner occupied348 21.9% Renter occupiedHouse owners and renters - Other race residents 502 50.2% Owner occupied499 49.8% Renter occupiedHouse owners and renters - Two or more races residents 991 47.9% Owner occupied1,078 52.1% Renter occupiedHouse owners and renters - White alone residents 6,949 60.6% Owner occupied4,515 39.4% Renter occupiedHouse owners and renters - Hispanic or Latino residents 1,973 56.6% Owner occupied1,511 43.4% Renter occupied
Language usage in The Colony
English speakers - Total 77.3% of residents of The Colony speak English at home.
13.7% of residents speak Spanish at home 3,923 64.8% Speak English very well2,128 35.2% Speak English less than very well8.8% of residents speak other language at home 2,183 56.3% Speak English very well1,692 43.7% Speak English less than very well
English speakers - Born in the United States 94.3% of residents of The Colony speak English at home.
4.1% of residents speak Spanish at home 533 75.9% Speak English very well169 24.1% Speak English less than very well1.4% of residents speak other language at home 159 66.2% Speak English very well81 33.8% Speak English less than very well
English speakers - Native, born elsewhere 48.5% of residents of The Colony speak English at home.
43.9% of residents speak Spanish at home 261 100.0% Speak English very well4.7% of residents speak other language at home 28 100.0% Speak English very well
English speakers - Foreign-born 12.8% of residents of The Colony speak English at home.
39.4% of residents speak Spanish at home 978 37.3% Speak English very well1,643 62.7% Speak English less than very well46.9% of residents speak other language at home 1,570 50.4% Speak English very well1,548 49.6% Speak English less than very well
White (Caucasian) - Speak only English Native:
95.7% (23,103)Foreign-born:
26.9% (365)
White (Caucasian) - Speak another language Native:
4.1% (988)Foreign-born:
71.5% (970)
Black or African American - Speak only English Native:
97.2% (4,289)Foreign-born:
26.0% (97)
Black or African American - Speak another language Native:
2.7% (120)Foreign-born:
71.6% (267)
American Indian / Alaska Native - Speak another language Native:
30.1% (56)Foreign-born:
98.9% (122)
Asian - Speak only English Native:
72.5% (1,031)Foreign-born:
9.8% (249)
Asian - Speak another language Native:
29.3% (417)Foreign-born:
89.6% (2,267)
Other race - Speak only English Native:
28.4% (479)Foreign-born:
6.1% (79)
Other race - Speak another language Native:
70.2% (1,182)Foreign-born:
94.1% (1,214)
Two or more races - Speak only English Native:
77.3% (4,652)Foreign-born:
5.7% (48)
Two or more races - Speak another language Native:
23.1% (1,391)Foreign-born:
95.2% (814)
White alone - Speak only English Native:
98.6% (21,291)Foreign-born:
41.1% (394)
White alone - Speak another language Native:
1.5% (316)Foreign-born:
58.9% (565)
Hispanic or Latino - Speak only English Native:
53.7% (3,845)Foreign-born:
3.4% (90)
Hispanic or Latino - Speak another language Native:
46.3% (3,318)Foreign-born:
97.6% (2,583)
Foreign-born residents in The Colony 6,272 residents are foreign born (5.8% Latin America , 5.7% Asia ).
This city:
13.2%Texas:
17.1%
Marital status for residents in The Colony Marital status - White (Caucasian) population 15 years and over
Males 32.7% Never married50.3% Now married1.8% Separated0.7% Widowed14.5% DivorcedFemales 25.1% Never married52.9% Now married0.7% Separated6.7% Widowed14.6% DivorcedWomen who gave birth in the past 12 months Now married:
87.2% (384)Unmarried:
12.8% (57)
Women who did not give birth in the past 12 months Now married:
51.7% (3,468)Unmarried:
48.3% (3,242)
Marital status - Black or African American population 15 years and over
Males 17.0% Never married65.7% Now married1.8% Separated2.3% Widowed13.2% DivorcedFemales 24.0% Never married51.5% Now married0.9% Separated3.7% Widowed19.9% DivorcedWomen who did not give birth in the past 12 months Now married:
29.0% (300)Unmarried:
71.0% (732)
Marital status - American Indian / Alaska Native population 15 years and over
Males 0.0% Never married100.0% Now married0.0% Separated0.0% Widowed0.0% DivorcedFemales 0.0% Never married64.6% Now married0.0% Separated35.4% Widowed0.0% DivorcedWomen who gave birth in the past 12 months Now married:
100.0% (27)Unmarried:
0.0% (0)
Women who did not give birth in the past 12 months Now married:
100.0% (27)Unmarried:
0.0% (0)
Marital status - Asian population 15 years and over
Males 23.2% Never married67.9% Now married0.0% Separated4.4% Widowed4.6% DivorcedFemales 16.0% Never married75.8% Now married0.0% Separated0.8% Widowed7.4% DivorcedWomen who gave birth in the past 12 months Now married:
100.0% (120)Unmarried:
0.0% (0)
Women who did not give birth in the past 12 months Now married:
67.9% (725)Unmarried:
32.1% (343)
Marital status - Other race population 15 years and over
Males 52.1% Never married39.5% Now married0.0% Separated0.0% Widowed8.3% DivorcedFemales 51.1% Never married40.5% Now married7.5% Separated0.9% Widowed0.0% DivorcedWomen who gave birth in the past 12 months Now married:
14.1% (18)Unmarried:
85.9% (113)
Women who did not give birth in the past 12 months Now married:
34.1% (333)Unmarried:
65.9% (644)
Marital status - Two or more races population 15 years and over
Males 34.7% Never married56.4% Now married1.8% Separated2.5% Widowed4.5% DivorcedFemales 55.0% Never married32.0% Now married1.1% Separated1.1% Widowed10.8% DivorcedWomen who gave birth in the past 12 months Now married:
63.4% (92)Unmarried:
36.6% (53)
Women who did not give birth in the past 12 months Now married:
25.0% (528)Unmarried:
75.0% (1,588)
Marital status - White alone, not Hispanic / Latino population 15 years and over
Males 31.4% Never married51.5% Now married1.7% Separated0.5% Widowed14.9% DivorcedFemales 24.4% Never married54.5% Now married0.6% Separated6.1% Widowed14.3% DivorcedWomen who gave birth in the past 12 months Now married:
97.1% (419)Unmarried:
2.9% (13)
Women who did not give birth in the past 12 months Now married:
53.4% (3,251)Unmarried:
46.6% (2,841)
Marital status - Hispanic or Latino population 15 years and over
Males 41.9% Never married45.5% Now married1.2% Separated2.2% Widowed9.2% DivorcedFemales 40.1% Never married41.5% Now married2.4% Separated6.0% Widowed10.1% DivorcedWomen who gave birth in the past 12 months Now married:
20.4% (33)Unmarried:
79.6% (127)
Women who did not give birth in the past 12 months Now married:
36.8% (1,134)Unmarried:
63.2% (1,944)
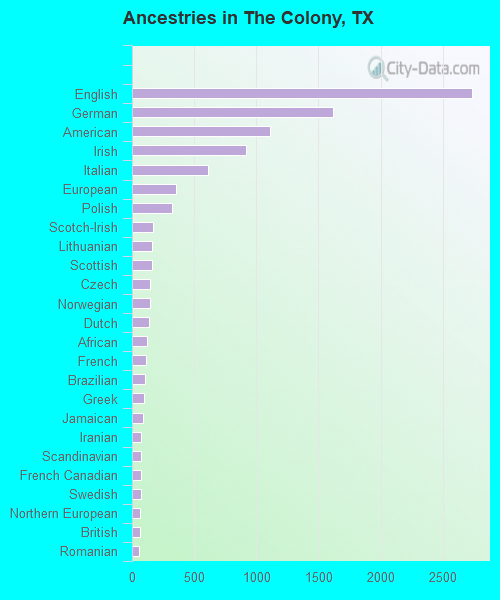
Ancestries in The Colony
2,735 12.9% English1,616 7.7% German1,107 5.2% American920 4.4% Irish608 2.9% Italian353 1.7% European319 1.5% Polish172 0.8% Scotch-Irish162 0.8% Lithuanian159 0.8% Scottish147 0.7% Czech142 0.7% Norwegian140 0.7% Dutch121 0.6% African111 0.5% French101 0.5% Brazilian94 0.4% Greek91 0.4% Jamaican75 0.4% Iranian74 0.4% Scandinavian70 0.3% French Canadian69 0.3% Swedish66 0.3% Northern European66 0.3% British54 0.3% Romanian49 0.2% Portuguese46 0.2% Canadian43 0.2% Jordanian42 0.2% Slovak34 0.2% Ukrainian28 0.1% Kenyan27 0.1% Eastern European25 0.1% Russian18 0.09% Lebanese17 0.08% Welsh8 0.04% Belgian8 0.04% Armenian8 0.04% Arab6 0.03% Albanian5 0.02% Ethiopian2 0.01% Carpatho Rusyn
Geographical mobility in The Colony Same house 1 year ago 22,411 85.4% White (Caucasian)4,071 79.8% Black or African American299 88.8% American Indian / Alaska Native3,249 80.4% Asian2,847 93.0% Other race6,383 81.4% Two or more races19,678 84.1% White alone, not Hispanic / Latino9,245 93.1% Hispanic or LatinoMoved within same county 1,234 4.7% White / Caucasian307 6.0% Black or African American111 2.8% Asian101 3.3% Other race191 2.4% Two or more races1,293 5.5% White alone, not Hispanic / Latino154 1.6% Hispanic or LatinoMoved within same state 1,788 6.8% White / Caucasian487 9.5% Black or African American11 3.4% American Indian / Alaska Native407 10.1% Asian136 4.4% Other race520 6.6% Two or more races1,626 6.9% White alone, not Hispanic / Latino464 4.7% Hispanic or LatinoMoved from different state 856 3.3% White / Caucasian237 4.6% Black or African American35 10.4% American Indian / Alaska Native281 7.0% Asian23 0.7% Other race999 12.7% Two or more races783 3.3% White alone, not Hispanic / Latino150 1.5% Hispanic or LatinoMoved from abroad 21 0.1% White58 0.6% Hispanic or Latino
Children Nativity (place of birth) in The Colony
Children under 6 years - Living with two parents Both parents native 1,596 100.0% NativeBoth parents foreign-born 327 100.0% NativeOne native, one foreign-born parent 224 100.0% NativeChildren under 6 years - Living with one parent Native parent 1,232 100.0% NativeForeign-born parent 203 83.9% Native39 16.1% Foreign-bornChildren 6 to 17 years - Living with two parents Both parents native 2,601 100.0% NativeBoth parents foreign-born 438 100.0% NativeOne native, one foreign-born parent 413 100.0% NativeChildren 6 to 17 years - Living with one parent Native parent 1,503 100.0% NativeForeign-born parent 337 53.1% Native298 46.9% Foreign-born
Grandparents responsible for own grandchildren in The Colony
Grandparents (30 to 59 years) White / Caucasian 150 63.8% Responsible for grandchildren85 36.2% Not responsible for grandchildrenAsian 61 100.0% Not responsible for grandchildrenOther race 33 100.0% Not responsible for grandchildrenTwo or more races 5 15.8% Responsible for grandchildren28 84.2% Not responsible for grandchildrenWhite alone, not Hispanic / Latino 161 72.9% Responsible for grandchildren60 27.1% Not responsible for grandchildrenHispanic or Latino 64 100.0% Not responsible for grandchildrenGrandparents (60 years and over) White / Caucasian 36 18.9% Responsible for grandchildren156 81.1% Not responsible for grandchildrenAsian 116 100.0% Not responsible for grandchildrenTwo or more races 310 100.0% Not responsible for grandchildrenWhite alone, not Hispanic / Latino 30 22.2% Responsible for grandchildren106 77.8% Not responsible for grandchildrenHispanic or Latino 16 6.6% Responsible for grandchildren229 93.4% Not responsible for grandchildren