Races in Thermalito, California (CA) Detailed Stats
Data:
Races - White alone (%)
Races - White alone (% change since 2000)
Races - Black alone (%)
Races - Black alone (% change since 2000)
Races - American Indian alone (%)
Races - American Indian alone (% change since 2000)
Races - Asian alone (%)
Races - Asian alone (% change since 2000)
Races - Hispanic (%)
Races - Hispanic (% change since 2000)
Races - Native Hawaiian and Other Pacific Islander alone (%)
Races - Native Hawaiian and Other Pacific Islander alone (% change since 2000)
Races - Two or more races(%)
Races - Two or more races(% change since 2000)
Races - Other race alone (%)
Races - Other race alone (% change since 2000)
Racial diversity
Place of birth - Born in state of residence (%)
Place of birth - Born in state of residence (%) - White
Place of birth - Born in state of residence (%) - Black or African American
Place of birth - Born in state of residence (%) - Asian
Place of birth - Born in state of residence (%) - Hispanic or Latino
Place of birth - Born in state of residence (%) - American Indian and Alaska Native
Place of birth - Born in state of residence (%) - Multirace
Place of birth - Born in state of residence (%) - Other Race
Place of birth - Born in other state (%)
Place of birth - Born in other state (%) - White
Place of birth - Born in other state (%) - Black or African American
Place of birth - Born in other state (%) - Asian
Place of birth - Born in other state (%) - Hispanic or Latino
Place of birth - Born in other state (%) - American Indian and Alaska Native
Place of birth - Born in other state (%) - Multirace
Place of birth - Born in other state (%) - Other Race
Place of birth - Native, outside of US (%)
Place of birth - Native, outside of US (%) - White
Place of birth - Native, outside of US (%) - Black or African American
Place of birth - Native, outside of US (%) - Asian
Place of birth - Native, outside of US (%) - Hispanic or Latino
Place of birth - Native, outside of US (%) - American Indian and Alaska Native
Place of birth - Native, outside of US (%) - Multirace
Place of birth - Native, outside of US (%) - Other Race
Place of birth - Foreign born (%)
Place of birth - Foreign born (%) - White
Place of birth - Foreign born (%) - Black or African American
Place of birth - Foreign born (%) - Asian
Place of birth - Foreign born (%) - Hispanic or Latino
Place of birth - Foreign born (%) - American Indian and Alaska Native
Place of birth - Foreign born (%) - Multirace
Place of birth - Foreign born (%) - Other Race
Residents speaking English at home (%)
Residents speaking English at home - Born in the United States (%)
Residents speaking English at home - Native, born elsewhere (%)
Residents speaking English at home - Foreign born (%)
Residents speaking Spanish at home (%)
Residents speaking Spanish at home - Born in the United States (%)
Residents speaking Spanish at home - Native, born elsewhere (%)
Residents speaking Spanish at home - Foreign born (%)
Residents speaking other language at home (%)
Residents speaking other language at home - Born in the United States (%)
Residents speaking other language at home - Native, born elsewhere (%)
Residents speaking other language at home - Foreign born (%)
Marital status - Never married (%)
Marital status - Now married (%)
Marital status - Separated (%)
Marital status - Widowed (%)
Marital status - Divorced (%)
Ancestries Reported - Arab (%)
Ancestries Reported - Czech (%)
Ancestries Reported - Danish (%)
Ancestries Reported - Dutch (%)
Ancestries Reported - English (%)
Ancestries Reported - French (%)
Ancestries Reported - French Canadian (%)
Ancestries Reported - German (%)
Ancestries Reported - Greek (%)
Ancestries Reported - Hungarian (%)
Ancestries Reported - Irish (%)
Ancestries Reported - Italian (%)
Ancestries Reported - Lithuanian (%)
Ancestries Reported - Norwegian (%)
Ancestries Reported - Polish (%)
Ancestries Reported - Portuguese (%)
Ancestries Reported - Russian (%)
Ancestries Reported - Scotch-Irish (%)
Ancestries Reported - Scottish (%)
Ancestries Reported - Slovak (%)
Ancestries Reported - Subsaharan African (%)
Ancestries Reported - Swedish (%)
Ancestries Reported - Swiss (%)
Ancestries Reported - Ukrainian (%)
Ancestries Reported - United States (%)
Ancestries Reported - Welsh (%)
Ancestries Reported - West Indian (%)
Ancestries Reported - Other (%)
Geographical mobility - Same house 1 year ago (%)
Geographical mobility - Same house 1 year ago (%) - White
Geographical mobility - Same house 1 year ago (%) - Black or African American
Geographical mobility - Same house 1 year ago (%) - Asian
Geographical mobility - Same house 1 year ago (%) - Hispanic or Latino
Geographical mobility - Same house 1 year ago (%) - American Indian and Alaska Native
Geographical mobility - Same house 1 year ago (%) - Multirace
Geographical mobility - Same house 1 year ago (%) - Other Race
Geographical mobility - Moved within same county (%)
Geographical mobility - Moved within same county (%) - White
Geographical mobility - Moved within same county (%) - Black or African American
Geographical mobility - Moved within same county (%) - Asian
Geographical mobility - Moved within same county (%) - Hispanic or Latino
Geographical mobility - Moved within same county (%) - American Indian and Alaska Native
Geographical mobility - Moved within same county (%) - Multirace
Geographical mobility - Moved within same county (%) - Other Race
Geographical mobility - Moved from different county within same state (%)
Geographical mobility - Moved from different county within same state (%) - White
Geographical mobility - Moved from different county within same state (%) - Black or African American
Geographical mobility - Moved from different county within same state (%) - Asian
Geographical mobility - Moved from different county within same state (%) - Hispanic or Latino
Geographical mobility - Moved from different county within same state (%) - American Indian and Alaska Native
Geographical mobility - Moved from different county within same state (%) - Multirace
Geographical mobility - Moved from different county within same state (%) - Other Race
Geographical mobility - Moved from different state (%)
Geographical mobility - Moved from different state (%) - White
Geographical mobility - Moved from different state (%) - Black or African American
Geographical mobility - Moved from different state (%) - Asian
Geographical mobility - Moved from different state (%) - Hispanic or Latino
Geographical mobility - Moved from different state (%) - American Indian and Alaska Native
Geographical mobility - Moved from different state (%) - Multirace
Geographical mobility - Moved from different state (%) - Other Race
Geographical mobility - Moved from abroad (%)
Geographical mobility - Moved from abroad (%) - White
Geographical mobility - Moved from abroad (%) - Black or African American
Geographical mobility - Moved from abroad (%) - Asian
Geographical mobility - Moved from abroad (%) - Hispanic or Latino
Geographical mobility - Moved from abroad (%) - American Indian and Alaska Native
Geographical mobility - Moved from abroad (%) - Multirace
Geographical mobility - Moved from abroad (%) - Other Race
Place of birth for the foreign-born population - Ireland (%)
Place of birth for the foreign-born population - Denmark (%)
Place of birth for the foreign-born population - Norway (%)
Place of birth for the foreign-born population - Sweden (%)
Place of birth for the foreign-born population - United Kingdom (%)
Place of birth for the foreign-born population - England (%)
Place of birth for the foreign-born population - Scotland (%)
Place of birth for the foreign-born population - Other Northern Europe (%)
Place of birth for the foreign-born population - Austria (%)
Place of birth for the foreign-born population - Belgium (%)
Place of birth for the foreign-born population - France (%)
Place of birth for the foreign-born population - Germany (%)
Place of birth for the foreign-born population - Netherlands (%)
Place of birth for the foreign-born population - Switzerland (%)
Place of birth for the foreign-born population - Other Western Europe (%)
Place of birth for the foreign-born population - Greece (%)
Place of birth for the foreign-born population - Italy (%)
Place of birth for the foreign-born population - Portugal (%)
Place of birth for the foreign-born population - Spain (%)
Place of birth for the foreign-born population - Other Southern Europe (%)
Place of birth for the foreign-born population - Albania (%)
Place of birth for the foreign-born population - Belarus (%)
Place of birth for the foreign-born population - Bosnia and Herzegovina (%)
Place of birth for the foreign-born population - Bulgaria (%)
Place of birth for the foreign-born population - Croatia (%)
Place of birth for the foreign-born population - Czechoslovakia (%)
Place of birth for the foreign-born population - Hungary (%)
Place of birth for the foreign-born population - Latvia (%)
Place of birth for the foreign-born population - Lithuania (%)
Place of birth for the foreign-born population - North Macedonia (Macedonia) (%)
Place of birth for the foreign-born population - Moldova (%)
Place of birth for the foreign-born population - Poland (%)
Place of birth for the foreign-born population - Romania (%)
Place of birth for the foreign-born population - Russia (%)
Place of birth for the foreign-born population - Serbia (%)
Place of birth for the foreign-born population - Ukraine (%)
Place of birth for the foreign-born population - Other Eastern Europe (%)
Place of birth for the foreign-born population - China (%)
Place of birth for the foreign-born population - Hong Kong (%)
Place of birth for the foreign-born population - Taiwan (%)
Place of birth for the foreign-born population - Japan (%)
Place of birth for the foreign-born population - Korea (%)
Place of birth for the foreign-born population - Other Eastern Asia (%)
Place of birth for the foreign-born population - Afghanistan (%)
Place of birth for the foreign-born population - Bangladesh (%)
Place of birth for the foreign-born population - India (%)
Place of birth for the foreign-born population - Iran (%)
Place of birth for the foreign-born population - Kazakhstan (%)
Place of birth for the foreign-born population - Nepal (%)
Place of birth for the foreign-born population - Pakistan (%)
Place of birth for the foreign-born population - Sri Lanka (%)
Place of birth for the foreign-born population - Uzbekistan (%)
Place of birth for the foreign-born population - Other South Central Asia (%)
Place of birth for the foreign-born population - Burma (%)
Place of birth for the foreign-born population - Cambodia (%)
Place of birth for the foreign-born population - Indonesia (%)
Place of birth for the foreign-born population - Laos (%)
Place of birth for the foreign-born population - Malaysia (%)
Place of birth for the foreign-born population - Philippines (%)
Place of birth for the foreign-born population - Singapore (%)
Place of birth for the foreign-born population - Thailand (%)
Place of birth for the foreign-born population - Vietnam (%)
Place of birth for the foreign-born population - Other South Eastern Asia (%)
Place of birth for the foreign-born population - Armenia (%)
Place of birth for the foreign-born population - Iraq (%)
Place of birth for the foreign-born population - Israel (%)
Place of birth for the foreign-born population - Jordan (%)
Place of birth for the foreign-born population - Kuwait (%)
Place of birth for the foreign-born population - Lebanon (%)
Place of birth for the foreign-born population - Saudi Arabia (%)
Place of birth for the foreign-born population - Syria (%)
Place of birth for the foreign-born population - Turkey (%)
Place of birth for the foreign-born population - Yemen (%)
Place of birth for the foreign-born population - Other Western Asia (%)
Place of birth for the foreign-born population - Eritrea (%)
Place of birth for the foreign-born population - Ethiopia (%)
Place of birth for the foreign-born population - Kenya (%)
Place of birth for the foreign-born population - Somalia (%)
Place of birth for the foreign-born population - Uganda (%)
Place of birth for the foreign-born population - Zimbabwe (%)
Place of birth for the foreign-born population - Other Eastern Africa (%)
Place of birth for the foreign-born population - Cameroon (%)
Place of birth for the foreign-born population - Congo (%)
Place of birth for the foreign-born population - Democratic Republic of Congo (Zaire) (%)
Place of birth for the foreign-born population - Other Middle Africa (%)
Place of birth for the foreign-born population - Egypt (%)
Place of birth for the foreign-born population - Morocco (%)
Place of birth for the foreign-born population - Sudan (%)
Place of birth for the foreign-born population - Other Northern Africa (%)
Place of birth for the foreign-born population - South Africa (%)
Place of birth for the foreign-born population - Other Southern Africa (%)
Place of birth for the foreign-born population - Cabo Verde (%)
Place of birth for the foreign-born population - Ghana (%)
Place of birth for the foreign-born population - Liberia (%)
Place of birth for the foreign-born population - Nigeria (%)
Place of birth for the foreign-born population - Senegal (%)
Place of birth for the foreign-born population - Sierra Leone (%)
Place of birth for the foreign-born population - Other Western Africa (%)
Place of birth for the foreign-born population - Australia (%)
Place of birth for the foreign-born population - New Zealand (%)
Place of birth for the foreign-born population - Fiji (%)
Place of birth for the foreign-born population - Micronesia (%)
Place of birth for the foreign-born population - Bahamas (%)
Place of birth for the foreign-born population - Barbados (%)
Place of birth for the foreign-born population - Cuba (%)
Place of birth for the foreign-born population - Dominica (%)
Place of birth for the foreign-born population - Dominican Republic (%)
Place of birth for the foreign-born population - Grenada (%)
Place of birth for the foreign-born population - Haiti (%)
Place of birth for the foreign-born population - Jamaica (%)
Place of birth for the foreign-born population - St. Vincent and the Grenadines (%)
Place of birth for the foreign-born population - Trinidad and Tobago (%)
Place of birth for the foreign-born population - West Indies (%)
Place of birth for the foreign-born population - Other Caribbean (%)
Place of birth for the foreign-born population - Belize (%)
Place of birth for the foreign-born population - Costa Rica (%)
Place of birth for the foreign-born population - El Salvador (%)
Place of birth for the foreign-born population - Guatemala (%)
Place of birth for the foreign-born population - Honduras (%)
Place of birth for the foreign-born population - Mexico (%)
Place of birth for the foreign-born population - Nicaragua (%)
Place of birth for the foreign-born population - Panama (%)
Place of birth for the foreign-born population - Other Central America (%)
Place of birth for the foreign-born population - Argentina (%)
Place of birth for the foreign-born population - Bolivia (%)
Place of birth for the foreign-born population - Brazil (%)
Place of birth for the foreign-born population - Chile (%)
Place of birth for the foreign-born population - Colombia (%)
Place of birth for the foreign-born population - Ecuador (%)
Place of birth for the foreign-born population - Guyana (%)
Place of birth for the foreign-born population - Peru (%)
Place of birth for the foreign-born population - Uruguay (%)
Place of birth for the foreign-born population - Venezuela (%)
Place of birth for the foreign-born population - Other South America (%)
Place of birth for the foreign-born population - Canada (%)
Place of birth for the foreign-born population - Other Northern America (%)
Place of birth for the foreign-born population - Other (%)
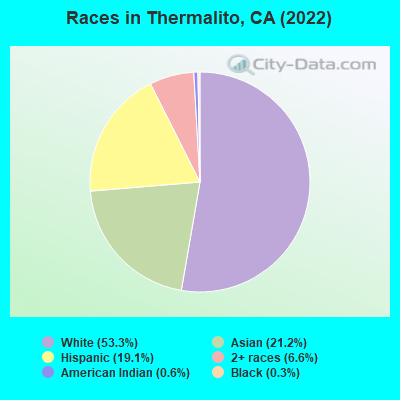
According to 2022 data, the most numerous races in Thermalito, CA are Hispanic (784 residents), White alone (3,763 residents), and Asian alone (1,473 residents). 76.8% of Thermalito residents speak English at home. 12.5% of Thermalito, CA residents are foreign-born (10.5% born in Asia, 1.3% born in Latin America), which is 107.3% less than the foreign-born rate of 26.0% across the entire state of California.
Race distribution in Thermalito
2000 2022
15,816,790 46.7% White alone 10,966,556 32.4% Hispanic 3,648,860 10.8% Asian alone 2,181,926 6.4% Black alone 903,115 2.7% Two or more races 178,984 0.5% American Indian alone 103,736 0.3% Native Hawaiian and Other 71,681 0.2% Other race alone
15,732,184 40.3% Hispanic 13,160,426 33.7% White alone 5,957,867 15.3% Asian alone 2,025,218 5.2% Black alone 1,663,222 4.3% Two or more races 251,618 0.6% Other race alone 135,777 0.3% Native Hawaiian and Other 103,030 0.3% American Indian alone
Income and house value in Thermalito Median household income in 2022 $57,833 White non-Hispanic householders$35,100 Black householders$134,586 American Indian and Alaska Native householders$47,312 Asian householders$16,577 Some other race householders$39,489 Two or more races householders$52,391 Hispanic or Latino race householdersMedian 2022 house value $292,982 White Non-Hispanic householders$334,374 American Indian or Alaska Native householders $458,910 Asian householders$287,943 Some other race householders$269,947 Two or more races householders$294,062 Hispanic or Latino householders
Median age by race in Thermalito
50.6 Median age for White residents50.9 49.9 61.3 Median age for Black or African American residents22.0 Median age for American Indian / Alaska Native residents25.2 Median age for Asian residents25.7 22.3 72.3 Median age for Native Hawaiian / Pacific Islander residents36.4 Median age for Other race residents17.8 39.9 33.9 Median age for Two or more races residents23.0 53.0 48.5 Median age for White alone residents49.1 48.7 26.2 Median age for Hispanic or Latino residents20.8 32.2
Owner/renter occupied households by race in Thermalito
House owners and renters - White residents 956 69.6% Owner occupied417 30.4% Renter occupiedHouse owners and renters - Black or African American residents 29 90.9% Owner occupied3 9.1% Renter occupiedHouse owners and renters - American Indian / Alaska Native residents 3 3.5% Owner occupied86 96.5% Renter occupiedHouse owners and renters - Asian residents 144 59.5% Owner occupied98 40.5% Renter occupiedHouse owners and renters - Other race residents 58 85.9% Owner occupied10 14.1% Renter occupiedHouse owners and renters - Two or more races residents 265 82.0% Owner occupied58 18.0% Renter occupiedHouse owners and renters - White alone residents 964 69.1% Owner occupied431 30.9% Renter occupiedHouse owners and renters - Hispanic or Latino residents 152 61.9% Owner occupied94 38.1% Renter occupied
Language usage in Thermalito
English speakers - Total 76.8% of residents of Thermalito speak English at home.
4.0% of residents speak Spanish at home 168 64.9% Speak English very well91 35.1% Speak English less than very well19.6% of residents speak other language at home 479 37.3% Speak English very well804 62.7% Speak English less than very well
English speakers - Born in the United States 86.2% of residents of Thermalito speak English at home.
6.1% of residents speak Spanish at home 31 50.0% Speak English very well31 50.0% Speak English less than very well7.7% of residents speak other language at home 68 86.1% Speak English very well11 13.9% Speak English less than very well
English speakers - Native, born elsewhere 5.2% of residents of Thermalito speak English at home.
92.0% of residents speak other language at home 196 100.0% Speak English less than very well
English speakers - Foreign-born 14.7% of residents of Thermalito speak English at home.
5.8% of residents speak Spanish at home 27 56.3% Speak English very well21 43.8% Speak English less than very well80.4% of residents speak other language at home 111 16.8% Speak English very well551 83.2% Speak English less than very well
White (Caucasian) - Speak only English Native:
100.0% (3,470)Foreign-born:
84.2% (33)
White (Caucasian) - Speak another language Native:
1.4% (47)Foreign-born:
25.5% (10)
Asian - Speak only English Native:
18.5% (178)Foreign-born:
14.7% (72)
Asian - Speak another language Native:
64.5% (621)Foreign-born:
85.5% (421)
Other race - Speak only English Native:
24.7% (53)Foreign-born:
12.4% (10)
Other race - Speak another language Native:
66.7% (144)Foreign-born:
82.0% (65)
White alone - Speak only English Native:
99.7% (3,532)Foreign-born:
74.7% (36)
Hispanic or Latino - Speak only English Native:
64.3% (403)Foreign-born:
12.5% (9)
Hispanic or Latino - Speak another language Native:
36.0% (225)Foreign-born:
84.4% (59)
Foreign-born residents in Thermalito 841 residents are foreign born (10.5% Asia , 1.3% Latin America ).
This city:
12.5%California:
100.0%
Marital status for residents in Thermalito Marital status - White (Caucasian) population 15 years and over
Males 34.2% Never married41.5% Now married2.1% Separated4.2% Widowed18.0% DivorcedFemales 23.0% Never married38.7% Now married1.6% Separated14.5% Widowed22.2% DivorcedWomen who gave birth in the past 12 months Now married:
76.2% (36)Unmarried:
23.8% (11)
Women who did not give birth in the past 12 months Now married:
30.0% (178)Unmarried:
70.0% (417)
Marital status - Black or African American population 15 years and over
Males 0.0% Never married0.0% Now married0.0% Separated0.0% Widowed100.0% DivorcedFemales 46.2% Never married0.0% Now married10.8% Separated12.3% Widowed30.8% DivorcedMarital status - American Indian / Alaska Native population 15 years and over
Males 100.0% Never married0.0% Now married0.0% Separated0.0% Widowed0.0% DivorcedFemales 67.9% Never married0.0% Now married0.0% Separated0.0% Widowed32.1% DivorcedWomen who did not give birth in the past 12 months Now married:
0.0% (0)Unmarried:
100.0% (77)
Marital status - Asian population 15 years and over
Males 67.4% Never married29.3% Now married1.0% Separated0.0% Widowed2.3% DivorcedFemales 56.1% Never married35.2% Now married1.0% Separated4.9% Widowed2.8% DivorcedWomen who did not give birth in the past 12 months Now married:
27.4% (147)Unmarried:
72.6% (388)
Marital status - Other race population 15 years and over
Males 59.2% Never married40.8% Now married0.0% Separated0.0% Widowed0.0% DivorcedFemales 8.3% Never married80.6% Now married0.0% Separated0.0% Widowed11.1% DivorcedWomen who did not give birth in the past 12 months Now married:
76.3% (57)Unmarried:
23.7% (18)
Marital status - Two or more races population 15 years and over
Males 48.1% Never married37.7% Now married0.0% Separated0.0% Widowed14.2% DivorcedFemales 8.3% Never married27.8% Now married0.0% Separated12.5% Widowed51.4% DivorcedWomen who did not give birth in the past 12 months Now married:
57.7% (44)Unmarried:
42.3% (33)
Marital status - White alone, not Hispanic / Latino population 15 years and over
Males 33.4% Never married41.5% Now married2.2% Separated4.0% Widowed18.9% DivorcedFemales 23.6% Never married37.0% Now married1.7% Separated15.2% Widowed22.5% DivorcedWomen who gave birth in the past 12 months Now married:
57.1% (18)Unmarried:
42.9% (13)
Women who did not give birth in the past 12 months Now married:
29.7% (201)Unmarried:
70.3% (477)
Marital status - Hispanic or Latino population 15 years and over
Males 53.0% Never married35.2% Now married0.0% Separated3.0% Widowed8.7% DivorcedFemales 21.9% Never married59.9% Now married0.0% Separated4.1% Widowed14.0% DivorcedWomen who gave birth in the past 12 months Now married:
100.0% (29)Unmarried:
0.0% (0)
Women who did not give birth in the past 12 months Now married:
49.1% (59)Unmarried:
50.9% (61)
Ancestries in Thermalito
759 21.3% American181 5.1% English136 3.8% European123 3.4% German116 3.2% Irish31 0.9% Swedish29 0.8% British27 0.8% Polish26 0.7% Portuguese23 0.6% Danish23 0.6% Ukrainian20 0.6% Norwegian19 0.5% French Canadian18 0.5% Italian15 0.4% Greek11 0.3% French10 0.3% Eastern European9 0.3% Bulgarian8 0.2% Russian7 0.2% Dutch7 0.2% Scotch-Irish6 0.2% Canadian
Children Nativity (place of birth) in Thermalito
Children under 6 years - Living with two parents Both parents native 126 100.0% NativeBoth parents foreign-born 15 100.0% NativeChildren under 6 years - Living with one parent Native parent 197 100.0% NativeForeign-born parent 10 100.0% NativeChildren 6 to 17 years - Living with two parents Both parents native 378 100.0% Native0 0.0% Foreign-bornBoth parents foreign-born 154 89.8% Native17 10.2% Foreign-bornOne native, one foreign-born parent 60 100.0% NativeChildren 6 to 17 years - Living with one parent Native parent 150 100.0% NativeForeign-born parent 20 50.0% Native20 50.0% Foreign-born
Grandparents responsible for own grandchildren in Thermalito
Grandparents (30 to 59 years) White / Caucasian 3 100.0% Responsible for grandchildrenAsian 9 100.0% Responsible for grandchildrenTwo or more races 82 100.0% Responsible for grandchildrenWhite alone, not Hispanic / Latino 4 100.0% Responsible for grandchildrenHispanic or Latino 19 100.0% Responsible for grandchildrenGrandparents (60 years and over) White / Caucasian 46 70.5% Responsible for grandchildren19 29.5% Not responsible for grandchildrenAsian 5 21.9% Responsible for grandchildren16 78.1% Not responsible for grandchildrenWhite alone, not Hispanic / Latino 14 32.9% Responsible for grandchildren28 67.1% Not responsible for grandchildrenHispanic or Latino 47 100.0% Responsible for grandchildren