Races in Thompson, New York (NY) Detailed Stats
Ancestries, Foreign-born residents, place of birth

Recent posts about races in Thompson, New York on our local forum with over 2,400,000 registered users:
 | smaller Upstate NY cities and towns/African American communities (5932 replies) |
| Buffalo-Boom/Bust II (577 replies) |
| Diversity in the Sedgwick Farms Neighborhood, Syracuse, NY (57 replies) |
| Syracuse Construction Update (4323 replies) |
| Lesser known eating joints (370 replies) |
| Are Most Blacks in NYC of West Indian Descent? (321 replies) |
Latest news about races in Thompson, NY collected exclusively by city-data.com from local newspapers, TV, and radio stations
9.8% of Thompson, NY residents are foreign-born (4.3% born in Latin America, 3.9% born in Europe, 1.5% born in Asia), which is 123.4% less than the foreign-born rate of 22.0% across the entire state of New York.
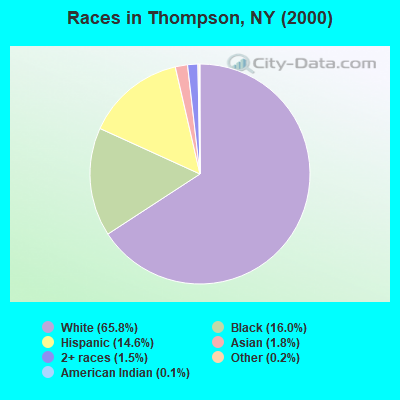
Race distribution in Thompson

- 9,33365.8%White alone
- 2,26816.0%Black alone
- 2,06614.6%Hispanic
- 2601.8%Asian alone
- 2091.5%Two or more races
- 320.2%Other race alone
- 190.1%American Indian alone
- 20.01%Native Hawaiian and Other
Pacific Islander alone
2000
2022
-
- 11,760,98162.0%White alone
- 2,867,58315.1%Hispanic
- 2,812,62314.8%Black alone
- 1,035,9265.5%Asian alone
- 366,1161.9%Two or more races
- 75,4990.4%Other race alone
- 52,4990.3%American Indian alone
- 5,2300.03%Native Hawaiian and Other
Pacific Islander alone

-
- 10,408,93352.9%White alone
- 3,867,29919.7%Hispanic
- 2,633,84013.4%Black alone
- 1,776,2869.0%Asian alone
- 732,6703.7%Two or more races
- 216,1101.1%Other race alone
- 35,0820.2%American Indian alone
- 6,9310.04%Native Hawaiian and Other
Pacific Islander alone

Income and house value in Thompson
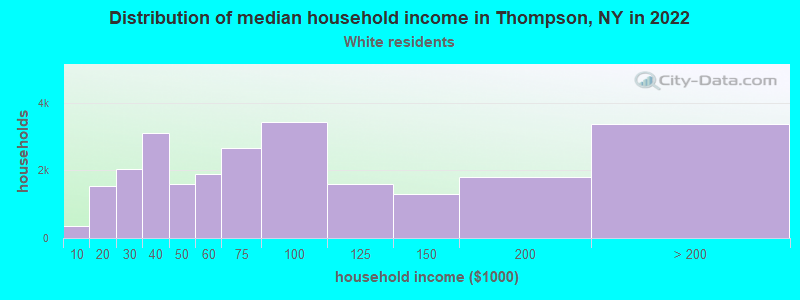
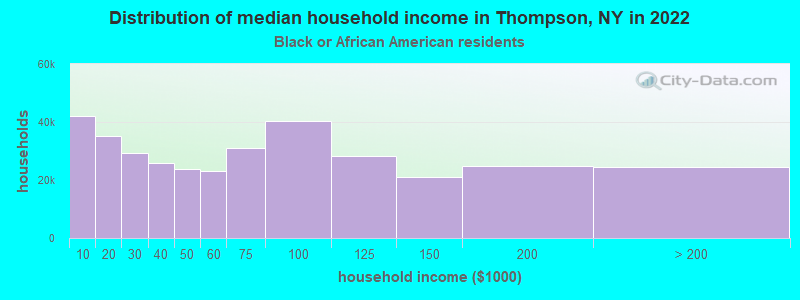
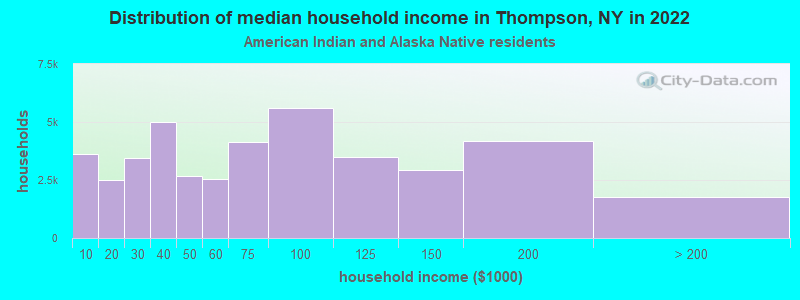
- Median household income in 2022
- $71,244White non-Hispanic householders
- $35,575Black householders
- $113,293American Indian and Alaska Native householders
- $178,163Asian householders
- $38,552Some other race householders
- $40,804Two or more races householders
- $40,503Hispanic or Latino race householders
- Median 2022 house value
- $282,399White Non-Hispanic householders
- $265,376Black or African American householders
- $338,940Asian householders
- $297,294Some other race householders
- $430,742Two or more races householders
- $286,351Hispanic or Latino householders
Household income for White non-Hispanic householders
Household income for Black householders
Household income for American Indian and Alaska Native householders
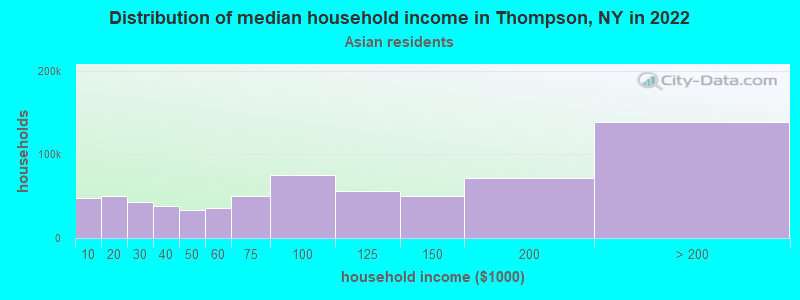
Household income for Asian householders
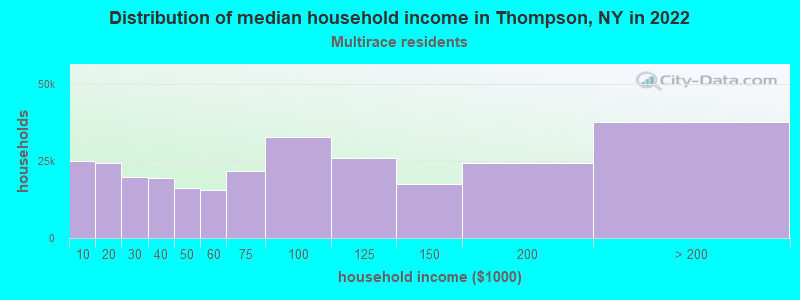
Household income for Two or more races householders
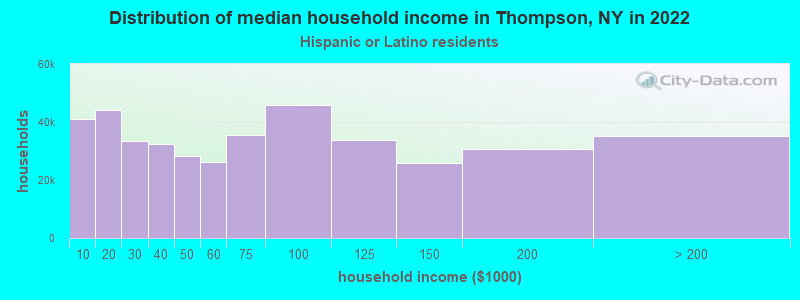
Household income for Hispanic or Latino race householders
Foreign-born residents in Thompson
1,397 residents are foreign born (4.3% Latin America, 3.9% Europe, 1.5% Asia).
| This city: | 9.8% |
| New York: | 20.4% |
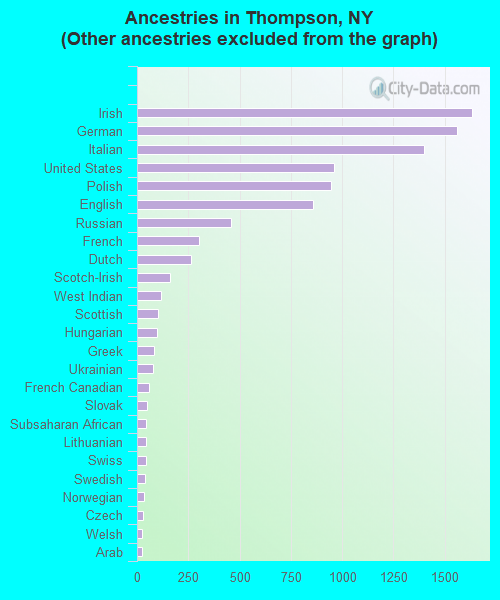
Ancestries in Thompson

- 4,81033.8%Other
- 1,63411.5%Irish
- 1,56111.0%German
- 1,3999.8%Italian
- 9626.8%United States
- 9456.6%Polish
- 8606.0%English
- 4573.2%Russian
- 3042.1%French
- 2631.8%Dutch
- 1621.1%Scotch-Irish
- 1170.8%West Indian
- 1010.7%Scottish
- 980.7%Hungarian
- 830.6%Greek
- 800.6%Ukrainian
- 590.4%French Canadian
- 470.3%Slovak
- 450.3%Subsaharan African
- 440.3%Lithuanian
- 440.3%Swiss
- 390.3%Swedish
- 320.2%Norwegian
- 270.2%Czech
- 250.2%Welsh
- 240.2%Arab
- 180.1%Danish
- 70.05%Portuguese
Zip codes: 12701.