Races in Tidehaven, Texas (TX) Detailed Stats
Ancestries, Foreign-born residents, place of birth
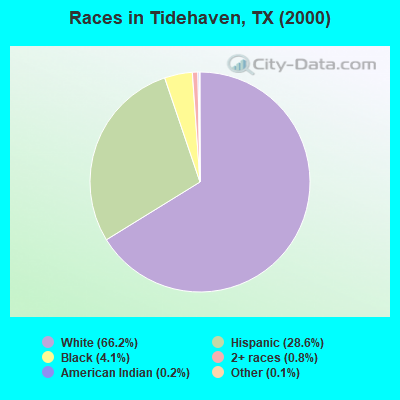
Race distribution in Tidehaven

- 2,80466.2%White alone
- 1,21228.6%Hispanic
- 1754.1%Black alone
- 320.8%Two or more races
- 80.2%American Indian alone
- 50.1%Other race alone
- 20.05%Asian alone
2000
2022
-
- 10,933,31352.4%White alone
- 6,669,66632.0%Hispanic
- 2,364,25511.3%Black alone
- 554,4452.7%Asian alone
- 230,5671.1%Two or more races
- 68,8590.3%American Indian alone
- 19,9580.10%Other race alone
- 10,7570.05%Native Hawaiian and Other
Pacific Islander alone

-
- 12,070,64240.2%Hispanic
- 11,683,43038.9%White alone
- 3,508,70611.7%Black alone
- 1,608,1735.4%Asian alone
- 956,5603.2%Two or more races
- 125,7630.4%Other race alone
- 47,0230.2%American Indian alone
- 29,2750.10%Native Hawaiian and Other
Pacific Islander alone

Income and house value in Tidehaven
- Median household income in 2022
- $71,756White non-Hispanic householders
- $54,063Black householders
- $63,406American Indian and Alaska Native householders
- $56,778Some other race householders
- $103,530Two or more races householders
- $69,706Hispanic or Latino race householders
- Median 2022 house value
- $174,837White Non-Hispanic householders
- $104,522Black or African American householders
- $89,952Some other race householders
- $91,536Two or more races householders
- $140,946Hispanic or Latino householders
Household income for White non-Hispanic householders

Household income for Black householders

Household income for American Indian and Alaska Native householders

Household income for Two or more races householders

Household income for Hispanic or Latino race householders

Zip code: 77456