Races in Timonium, Maryland (MD) Detailed Stats
Data:
Races - White alone (%)
Races - White alone (% change since 2000)
Races - Black alone (%)
Races - Black alone (% change since 2000)
Races - American Indian alone (%)
Races - American Indian alone (% change since 2000)
Races - Asian alone (%)
Races - Asian alone (% change since 2000)
Races - Hispanic (%)
Races - Hispanic (% change since 2000)
Races - Native Hawaiian and Other Pacific Islander alone (%)
Races - Native Hawaiian and Other Pacific Islander alone (% change since 2000)
Races - Two or more races(%)
Races - Two or more races(% change since 2000)
Races - Other race alone (%)
Races - Other race alone (% change since 2000)
Racial diversity
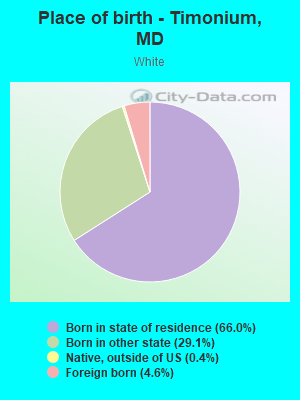
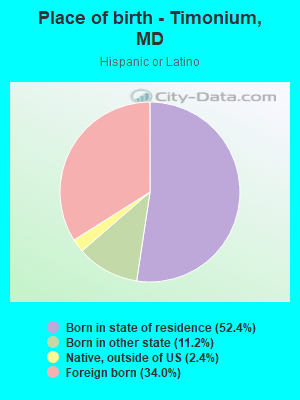
Place of birth - Born in state of residence (%)
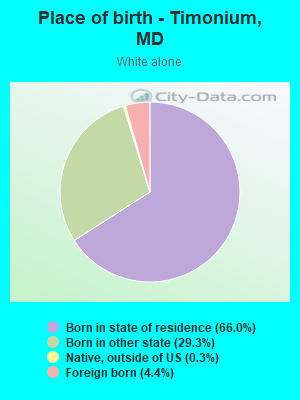
Place of birth - Born in state of residence (%) - White
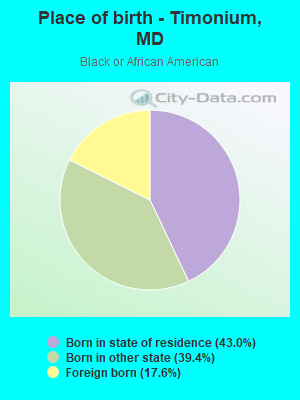
Place of birth - Born in state of residence (%) - Black or African American
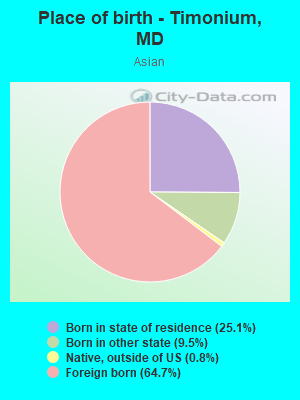
Place of birth - Born in state of residence (%) - Asian
Place of birth - Born in state of residence (%) - Hispanic or Latino
Place of birth - Born in state of residence (%) - American Indian and Alaska Native
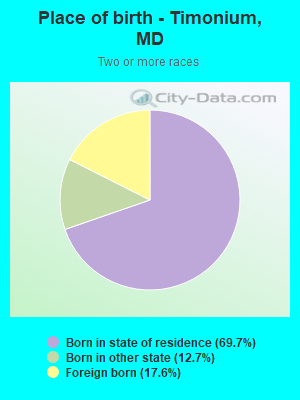
Place of birth - Born in state of residence (%) - Multirace
Place of birth - Born in state of residence (%) - Other Race
Place of birth - Born in other state (%)
Place of birth - Born in other state (%) - White
Place of birth - Born in other state (%) - Black or African American
Place of birth - Born in other state (%) - Asian
Place of birth - Born in other state (%) - Hispanic or Latino
Place of birth - Born in other state (%) - American Indian and Alaska Native
Place of birth - Born in other state (%) - Multirace
Place of birth - Born in other state (%) - Other Race
Place of birth - Native, outside of US (%)
Place of birth - Native, outside of US (%) - White
Place of birth - Native, outside of US (%) - Black or African American
Place of birth - Native, outside of US (%) - Asian
Place of birth - Native, outside of US (%) - Hispanic or Latino
Place of birth - Native, outside of US (%) - American Indian and Alaska Native
Place of birth - Native, outside of US (%) - Multirace
Place of birth - Native, outside of US (%) - Other Race
Place of birth - Foreign born (%)
Place of birth - Foreign born (%) - White
Place of birth - Foreign born (%) - Black or African American
Place of birth - Foreign born (%) - Asian
Place of birth - Foreign born (%) - Hispanic or Latino
Place of birth - Foreign born (%) - American Indian and Alaska Native
Place of birth - Foreign born (%) - Multirace
Place of birth - Foreign born (%) - Other Race
Residents speaking English at home (%)
Residents speaking English at home - Born in the United States (%)
Residents speaking English at home - Native, born elsewhere (%)
Residents speaking English at home - Foreign born (%)
Residents speaking Spanish at home (%)
Residents speaking Spanish at home - Born in the United States (%)
Residents speaking Spanish at home - Native, born elsewhere (%)
Residents speaking Spanish at home - Foreign born (%)
Residents speaking other language at home (%)
Residents speaking other language at home - Born in the United States (%)
Residents speaking other language at home - Native, born elsewhere (%)
Residents speaking other language at home - Foreign born (%)
Marital status - Never married (%)
Marital status - Now married (%)
Marital status - Separated (%)
Marital status - Widowed (%)
Marital status - Divorced (%)
Ancestries Reported - Arab (%)
Ancestries Reported - Czech (%)
Ancestries Reported - Danish (%)
Ancestries Reported - Dutch (%)
Ancestries Reported - English (%)
Ancestries Reported - French (%)
Ancestries Reported - French Canadian (%)
Ancestries Reported - German (%)
Ancestries Reported - Greek (%)
Ancestries Reported - Hungarian (%)
Ancestries Reported - Irish (%)
Ancestries Reported - Italian (%)
Ancestries Reported - Lithuanian (%)
Ancestries Reported - Norwegian (%)
Ancestries Reported - Polish (%)
Ancestries Reported - Portuguese (%)
Ancestries Reported - Russian (%)
Ancestries Reported - Scotch-Irish (%)
Ancestries Reported - Scottish (%)
Ancestries Reported - Slovak (%)
Ancestries Reported - Subsaharan African (%)
Ancestries Reported - Swedish (%)
Ancestries Reported - Swiss (%)
Ancestries Reported - Ukrainian (%)
Ancestries Reported - United States (%)
Ancestries Reported - Welsh (%)
Ancestries Reported - West Indian (%)
Ancestries Reported - Other (%)
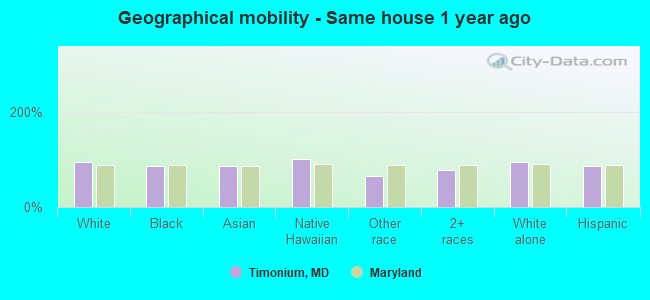
Geographical mobility - Same house 1 year ago (%)
Geographical mobility - Same house 1 year ago (%) - White
Geographical mobility - Same house 1 year ago (%) - Black or African American
Geographical mobility - Same house 1 year ago (%) - Asian
Geographical mobility - Same house 1 year ago (%) - Hispanic or Latino
Geographical mobility - Same house 1 year ago (%) - American Indian and Alaska Native
Geographical mobility - Same house 1 year ago (%) - Multirace
Geographical mobility - Same house 1 year ago (%) - Other Race
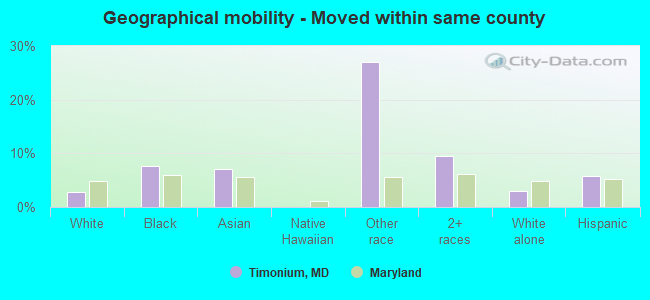
Geographical mobility - Moved within same county (%)
Geographical mobility - Moved within same county (%) - White
Geographical mobility - Moved within same county (%) - Black or African American
Geographical mobility - Moved within same county (%) - Asian
Geographical mobility - Moved within same county (%) - Hispanic or Latino
Geographical mobility - Moved within same county (%) - American Indian and Alaska Native
Geographical mobility - Moved within same county (%) - Multirace
Geographical mobility - Moved within same county (%) - Other Race
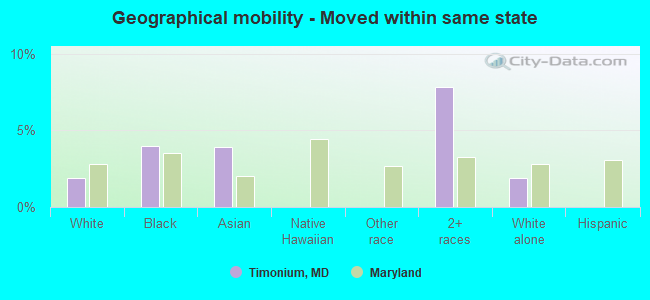
Geographical mobility - Moved from different county within same state (%)
Geographical mobility - Moved from different county within same state (%) - White
Geographical mobility - Moved from different county within same state (%) - Black or African American
Geographical mobility - Moved from different county within same state (%) - Asian
Geographical mobility - Moved from different county within same state (%) - Hispanic or Latino
Geographical mobility - Moved from different county within same state (%) - American Indian and Alaska Native
Geographical mobility - Moved from different county within same state (%) - Multirace
Geographical mobility - Moved from different county within same state (%) - Other Race
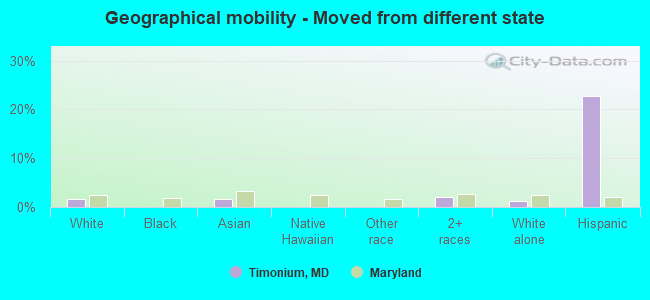
Geographical mobility - Moved from different state (%)
Geographical mobility - Moved from different state (%) - White
Geographical mobility - Moved from different state (%) - Black or African American
Geographical mobility - Moved from different state (%) - Asian
Geographical mobility - Moved from different state (%) - Hispanic or Latino
Geographical mobility - Moved from different state (%) - American Indian and Alaska Native
Geographical mobility - Moved from different state (%) - Multirace
Geographical mobility - Moved from different state (%) - Other Race
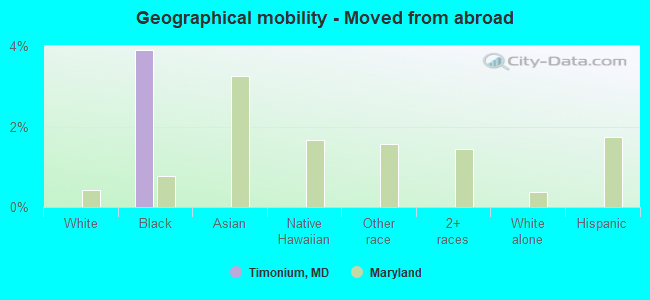
Geographical mobility - Moved from abroad (%)
Geographical mobility - Moved from abroad (%) - White
Geographical mobility - Moved from abroad (%) - Black or African American
Geographical mobility - Moved from abroad (%) - Asian
Geographical mobility - Moved from abroad (%) - Hispanic or Latino
Geographical mobility - Moved from abroad (%) - American Indian and Alaska Native
Geographical mobility - Moved from abroad (%) - Multirace
Geographical mobility - Moved from abroad (%) - Other Race
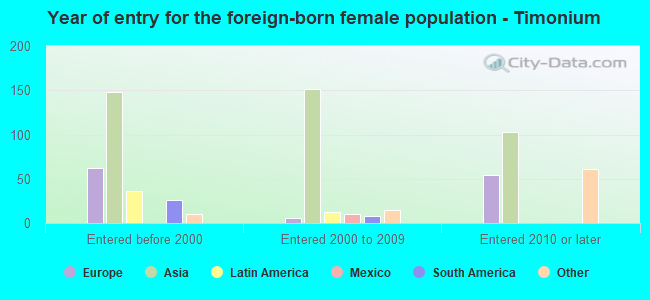
Place of birth for the foreign-born population - Ireland (%)
Place of birth for the foreign-born population - Denmark (%)
Place of birth for the foreign-born population - Norway (%)
Place of birth for the foreign-born population - Sweden (%)
Place of birth for the foreign-born population - United Kingdom (%)
Place of birth for the foreign-born population - England (%)
Place of birth for the foreign-born population - Scotland (%)
Place of birth for the foreign-born population - Other Northern Europe (%)
Place of birth for the foreign-born population - Austria (%)
Place of birth for the foreign-born population - Belgium (%)
Place of birth for the foreign-born population - France (%)
Place of birth for the foreign-born population - Germany (%)
Place of birth for the foreign-born population - Netherlands (%)
Place of birth for the foreign-born population - Switzerland (%)
Place of birth for the foreign-born population - Other Western Europe (%)
Place of birth for the foreign-born population - Greece (%)
Place of birth for the foreign-born population - Italy (%)
Place of birth for the foreign-born population - Portugal (%)
Place of birth for the foreign-born population - Spain (%)
Place of birth for the foreign-born population - Other Southern Europe (%)
Place of birth for the foreign-born population - Albania (%)
Place of birth for the foreign-born population - Belarus (%)
Place of birth for the foreign-born population - Bosnia and Herzegovina (%)
Place of birth for the foreign-born population - Bulgaria (%)
Place of birth for the foreign-born population - Croatia (%)
Place of birth for the foreign-born population - Czechoslovakia (%)
Place of birth for the foreign-born population - Hungary (%)
Place of birth for the foreign-born population - Latvia (%)
Place of birth for the foreign-born population - Lithuania (%)
Place of birth for the foreign-born population - North Macedonia (Macedonia) (%)
Place of birth for the foreign-born population - Moldova (%)
Place of birth for the foreign-born population - Poland (%)
Place of birth for the foreign-born population - Romania (%)
Place of birth for the foreign-born population - Russia (%)
Place of birth for the foreign-born population - Serbia (%)
Place of birth for the foreign-born population - Ukraine (%)
Place of birth for the foreign-born population - Other Eastern Europe (%)
Place of birth for the foreign-born population - China (%)
Place of birth for the foreign-born population - Hong Kong (%)
Place of birth for the foreign-born population - Taiwan (%)
Place of birth for the foreign-born population - Japan (%)
Place of birth for the foreign-born population - Korea (%)
Place of birth for the foreign-born population - Other Eastern Asia (%)
Place of birth for the foreign-born population - Afghanistan (%)
Place of birth for the foreign-born population - Bangladesh (%)
Place of birth for the foreign-born population - India (%)
Place of birth for the foreign-born population - Iran (%)
Place of birth for the foreign-born population - Kazakhstan (%)
Place of birth for the foreign-born population - Nepal (%)
Place of birth for the foreign-born population - Pakistan (%)
Place of birth for the foreign-born population - Sri Lanka (%)
Place of birth for the foreign-born population - Uzbekistan (%)
Place of birth for the foreign-born population - Other South Central Asia (%)
Place of birth for the foreign-born population - Burma (%)
Place of birth for the foreign-born population - Cambodia (%)
Place of birth for the foreign-born population - Indonesia (%)
Place of birth for the foreign-born population - Laos (%)
Place of birth for the foreign-born population - Malaysia (%)
Place of birth for the foreign-born population - Philippines (%)
Place of birth for the foreign-born population - Singapore (%)
Place of birth for the foreign-born population - Thailand (%)
Place of birth for the foreign-born population - Vietnam (%)
Place of birth for the foreign-born population - Other South Eastern Asia (%)
Place of birth for the foreign-born population - Armenia (%)
Place of birth for the foreign-born population - Iraq (%)
Place of birth for the foreign-born population - Israel (%)
Place of birth for the foreign-born population - Jordan (%)
Place of birth for the foreign-born population - Kuwait (%)
Place of birth for the foreign-born population - Lebanon (%)
Place of birth for the foreign-born population - Saudi Arabia (%)
Place of birth for the foreign-born population - Syria (%)
Place of birth for the foreign-born population - Turkey (%)
Place of birth for the foreign-born population - Yemen (%)
Place of birth for the foreign-born population - Other Western Asia (%)
Place of birth for the foreign-born population - Eritrea (%)
Place of birth for the foreign-born population - Ethiopia (%)
Place of birth for the foreign-born population - Kenya (%)
Place of birth for the foreign-born population - Somalia (%)
Place of birth for the foreign-born population - Uganda (%)
Place of birth for the foreign-born population - Zimbabwe (%)
Place of birth for the foreign-born population - Other Eastern Africa (%)
Place of birth for the foreign-born population - Cameroon (%)
Place of birth for the foreign-born population - Congo (%)
Place of birth for the foreign-born population - Democratic Republic of Congo (Zaire) (%)
Place of birth for the foreign-born population - Other Middle Africa (%)
Place of birth for the foreign-born population - Egypt (%)
Place of birth for the foreign-born population - Morocco (%)
Place of birth for the foreign-born population - Sudan (%)
Place of birth for the foreign-born population - Other Northern Africa (%)
Place of birth for the foreign-born population - South Africa (%)
Place of birth for the foreign-born population - Other Southern Africa (%)
Place of birth for the foreign-born population - Cabo Verde (%)
Place of birth for the foreign-born population - Ghana (%)
Place of birth for the foreign-born population - Liberia (%)
Place of birth for the foreign-born population - Nigeria (%)
Place of birth for the foreign-born population - Senegal (%)
Place of birth for the foreign-born population - Sierra Leone (%)
Place of birth for the foreign-born population - Other Western Africa (%)
Place of birth for the foreign-born population - Australia (%)
Place of birth for the foreign-born population - New Zealand (%)
Place of birth for the foreign-born population - Fiji (%)
Place of birth for the foreign-born population - Micronesia (%)
Place of birth for the foreign-born population - Bahamas (%)
Place of birth for the foreign-born population - Barbados (%)
Place of birth for the foreign-born population - Cuba (%)
Place of birth for the foreign-born population - Dominica (%)
Place of birth for the foreign-born population - Dominican Republic (%)
Place of birth for the foreign-born population - Grenada (%)
Place of birth for the foreign-born population - Haiti (%)
Place of birth for the foreign-born population - Jamaica (%)
Place of birth for the foreign-born population - St. Vincent and the Grenadines (%)
Place of birth for the foreign-born population - Trinidad and Tobago (%)
Place of birth for the foreign-born population - West Indies (%)
Place of birth for the foreign-born population - Other Caribbean (%)
Place of birth for the foreign-born population - Belize (%)
Place of birth for the foreign-born population - Costa Rica (%)
Place of birth for the foreign-born population - El Salvador (%)
Place of birth for the foreign-born population - Guatemala (%)
Place of birth for the foreign-born population - Honduras (%)
Place of birth for the foreign-born population - Mexico (%)
Place of birth for the foreign-born population - Nicaragua (%)
Place of birth for the foreign-born population - Panama (%)
Place of birth for the foreign-born population - Other Central America (%)
Place of birth for the foreign-born population - Argentina (%)
Place of birth for the foreign-born population - Bolivia (%)
Place of birth for the foreign-born population - Brazil (%)
Place of birth for the foreign-born population - Chile (%)
Place of birth for the foreign-born population - Colombia (%)
Place of birth for the foreign-born population - Ecuador (%)
Place of birth for the foreign-born population - Guyana (%)
Place of birth for the foreign-born population - Peru (%)
Place of birth for the foreign-born population - Uruguay (%)
Place of birth for the foreign-born population - Venezuela (%)
Place of birth for the foreign-born population - Other South America (%)
Place of birth for the foreign-born population - Canada (%)
Place of birth for the foreign-born population - Other Northern America (%)
Place of birth for the foreign-born population - Other (%)
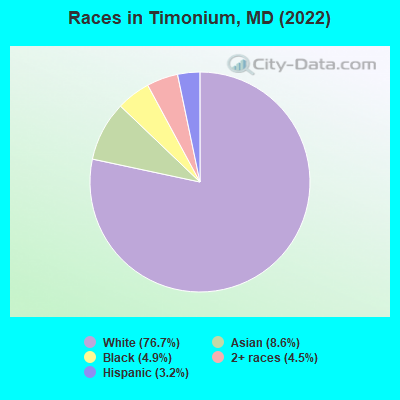
According to 2022 data, the most numerous races in Timonium, MD are White alone (8,228 residents), Black alone (522 residents), and Hispanic (348 residents). 87.1% of Timonium residents speak English at home.
Race distribution in Timonium 8,228 76.7% White alone 928 8.6% Asian alone 522 4.9% Black alone 483 4.5% Two or more races 348 3.2% Hispanic 4 0.04% Native Hawaiian and Other
2000 2022
3,286,547 62.1% White alone 1,464,735 27.7% Black alone 227,916 4.3% Hispanic 209,738 4.0% Asian alone 82,946 1.6% Two or more races 13,312 0.3% American Indian alone 9,379 0.2% Other race alone 1,913 0.04% Native Hawaiian and Other
2,906,492 47.1% White alone 1,800,914 29.2% Black alone 705,842 11.4% Hispanic 401,818 6.5% Asian alone 291,317 4.7% Two or more races 46,930 0.8% Other race alone 8,930 0.1% American Indian alone 2,417 0.04% Native Hawaiian and Other
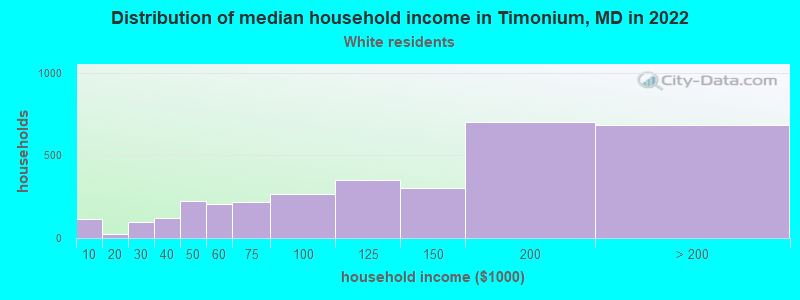
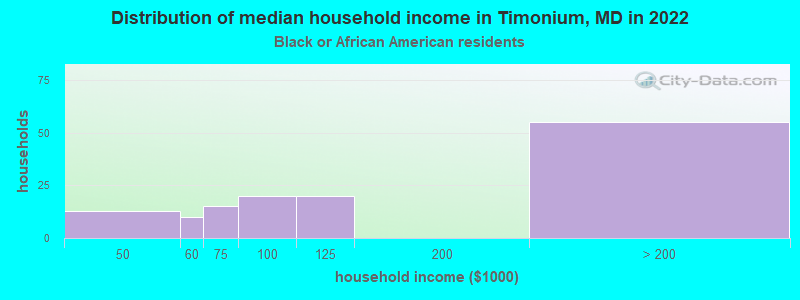
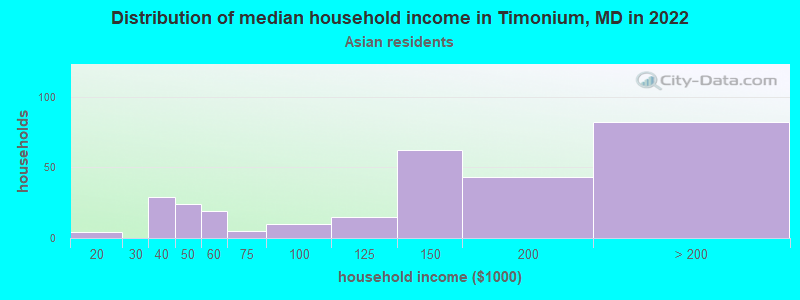
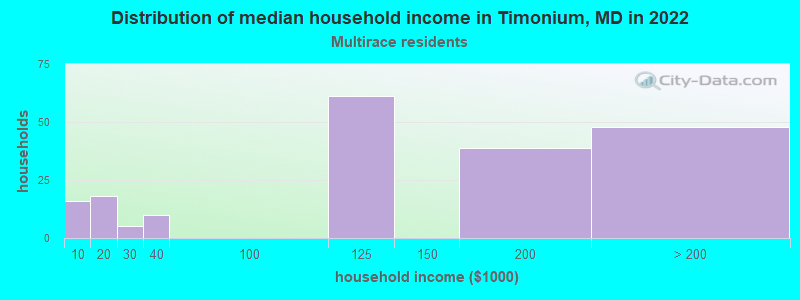
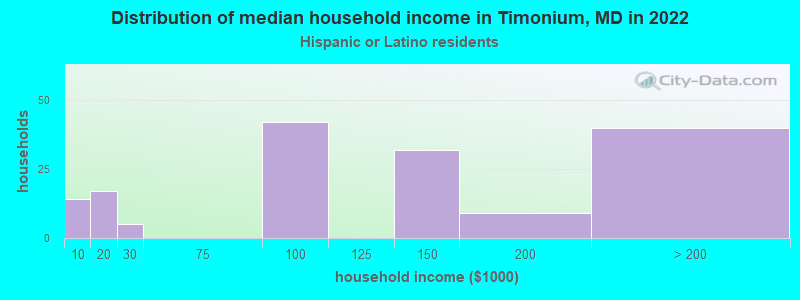
Income and house value in Timonium Median household income in 2022 $123,824 White non-Hispanic householders$118,690 Black householders$146,279 Asian householders$142,360 Two or more races householders$121,850 Hispanic or Latino race householders
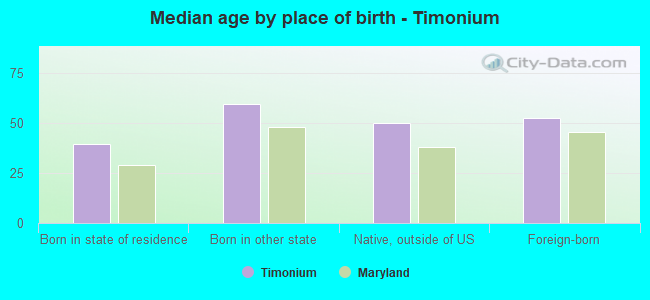
Median age by race in Timonium
51.0 Median age for White residents49.2 53.2 46.3 Median age for Black or African American residents46.1 41.1 -768,041,236.3 Median age for American Indian / Alaska Native residents-867,632,849.4 -677,419,354.2 45.1 Median age for Asian residents42.7 47.2 -1,541,125,539.6 Median age for Native Hawaiian / Pacific Islander residents-790,901,136.6 -760,942,760.2 38.1 Median age for Other race residents-733,333,332.6 39.4 17.5 Median age for Two or more races residents26.4 15.0 50.8 Median age for White alone residents48.7 53.8 39.3 Median age for Hispanic or Latino residents54.1 35.1
Owner/renter occupied households by race in Timonium
House owners and renters - White residents 2,778 82.0% Owner occupied608 18.0% Renter occupiedHouse owners and renters - Black or African American residents 49 39.4% Owner occupied75 60.6% Renter occupiedHouse owners and renters - Asian residents 256 89.7% Owner occupied29 10.3% Renter occupiedHouse owners and renters - Other race residents 30 100.0% Renter occupiedHouse owners and renters - Two or more races residents 143 83.3% Owner occupied29 16.7% Renter occupiedHouse owners and renters - White alone residents 2,759 82.5% Owner occupied584 17.5% Renter occupiedHouse owners and renters - Hispanic or Latino residents 78 50.3% Owner occupied77 49.7% Renter occupied
Language usage in Timonium
English speakers - Total 87.1% of residents of Timonium speak English at home.
1.9% of residents speak Spanish at home 169 84.5% Speak English very well31 15.5% Speak English less than very well11.1% of residents speak other language at home 698 60.5% Speak English very well455 39.5% Speak English less than very well
English speakers - Born in the United States 97.8% of residents of Timonium speak English at home.
0.3% of residents speak Spanish at home 9 100.0% Speak English less than very well2.6% of residents speak other language at home 45 63.4% Speak English very well26 36.6% Speak English less than very well
English speakers - Native, born elsewhere 50.0% of residents of Timonium speak English at home.
12.5% of residents speak Spanish at home 7 100.0% Speak English very well19.6% of residents speak other language at home 11 100.0% Speak English very well
English speakers - Foreign-born 23.3% of residents of Timonium speak English at home.
9.1% of residents speak Spanish at home 90 79.6% Speak English very well23 20.4% Speak English less than very well66.3% of residents speak other language at home 444 54.2% Speak English very well375 45.8% Speak English less than very well
White (Caucasian) - Speak only English Native:
98.4% (7,528)Foreign-born:
41.4% (159)
White (Caucasian) - Speak another language Native:
1.9% (142)Foreign-born:
60.0% (230)
Black or African American - Speak only English Native:
100.0% (437)Foreign-born:
7.3% (7)
Asian - Speak only English Native:
61.9% (175)Foreign-born:
13.2% (78)
Asian - Speak another language Native:
38.4% (108)Foreign-born:
86.8% (511)
Two or more races - Speak another language Native:
17.6% (83)Foreign-born:
81.8% (85)
White alone - Speak only English Native:
98.3% (7,503)Foreign-born:
42.3% (154)
White alone - Speak another language Native:
1.8% (136)Foreign-born:
56.9% (207)
Hispanic or Latino - Speak only English Native:
46.9% (80)Foreign-born:
3.5% (4)
Hispanic or Latino - Speak another language Native:
50.1% (85)Foreign-born:
96.5% (117)
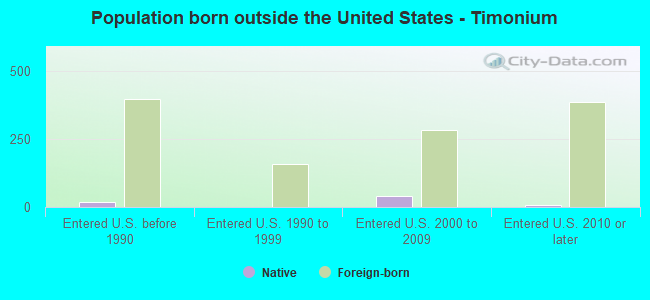
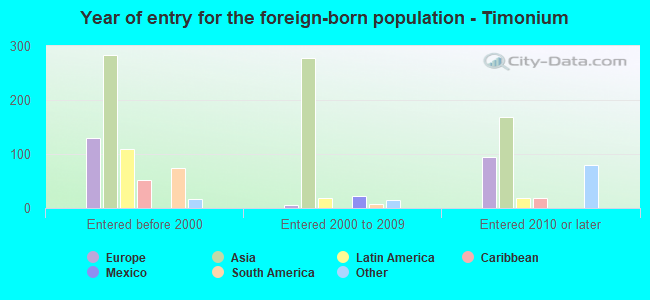
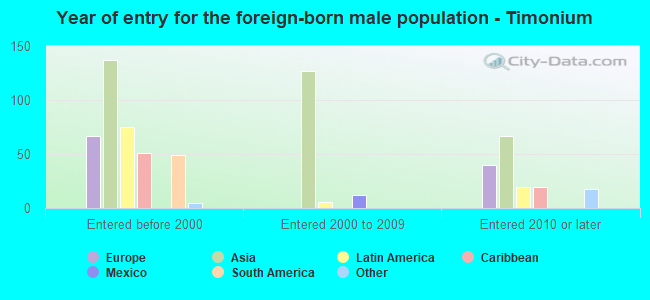
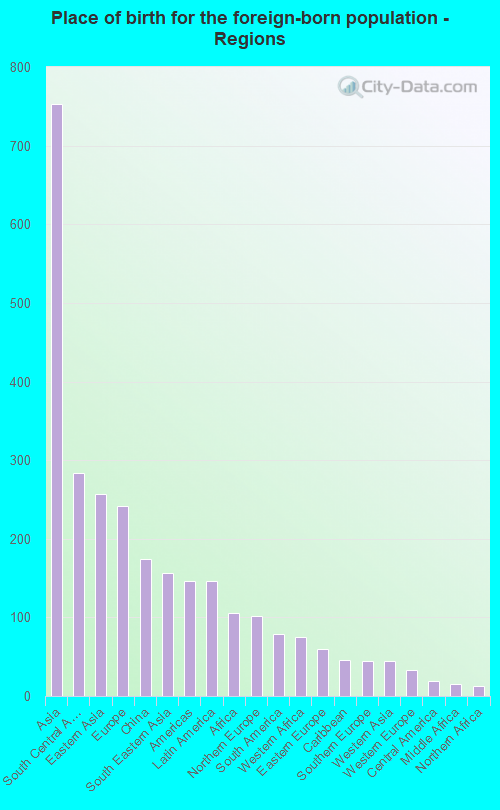
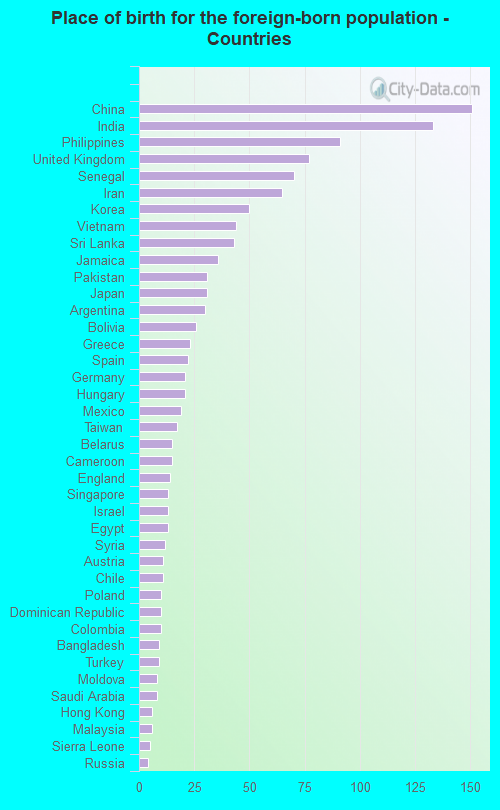
Foreign-born residents in Timonium
Marital status for residents in Timonium Marital status - White (Caucasian) population 15 years and over
Males 32.7% Never married56.8% Now married0.6% Separated4.8% Widowed5.1% DivorcedFemales 17.6% Never married57.0% Now married0.6% Separated14.8% Widowed10.0% DivorcedWomen who gave birth in the past 12 months Now married:
69.4% (70)Unmarried:
30.6% (31)
Women who did not give birth in the past 12 months Now married:
54.3% (694)Unmarried:
45.7% (584)
Marital status - Black or African American population 15 years and over
Males 47.9% Never married46.9% Now married0.0% Separated0.0% Widowed5.2% DivorcedFemales 50.8% Never married30.7% Now married0.0% Separated18.6% Widowed0.0% DivorcedWomen who did not give birth in the past 12 months Now married:
34.0% (51)Unmarried:
66.0% (99)
Marital status - Asian population 15 years and over
Males 17.5% Never married75.7% Now married0.0% Separated2.0% Widowed4.7% DivorcedFemales 21.4% Never married71.2% Now married1.4% Separated6.0% Widowed0.0% DivorcedWomen who gave birth in the past 12 months Now married:
100.0% (11)Unmarried:
0.0% (0)
Women who did not give birth in the past 12 months Now married:
66.3% (168)Unmarried:
33.7% (85)
Marital status - Two or more races population 15 years and over
Males 30.8% Never married69.2% Now married0.0% Separated0.0% Widowed0.0% DivorcedFemales 31.2% Never married47.9% Now married0.0% Separated0.0% Widowed20.8% DivorcedWomen who did not give birth in the past 12 months Now married:
40.5% (65)Unmarried:
59.5% (95)
Marital status - White alone, not Hispanic / Latino population 15 years and over
Males 33.0% Never married56.5% Now married0.6% Separated4.8% Widowed5.2% DivorcedFemales 17.5% Never married57.2% Now married0.6% Separated14.5% Widowed10.2% DivorcedWomen who gave birth in the past 12 months Now married:
69.4% (71)Unmarried:
30.6% (31)
Women who did not give birth in the past 12 months Now married:
54.4% (680)Unmarried:
45.6% (569)
Marital status - Hispanic or Latino population 15 years and over
Males 12.6% Never married86.3% Now married0.0% Separated1.1% Widowed0.0% DivorcedFemales 28.0% Never married39.3% Now married0.0% Separated16.7% Widowed16.0% DivorcedWomen who did not give birth in the past 12 months Now married:
43.2% (34)Unmarried:
56.8% (45)
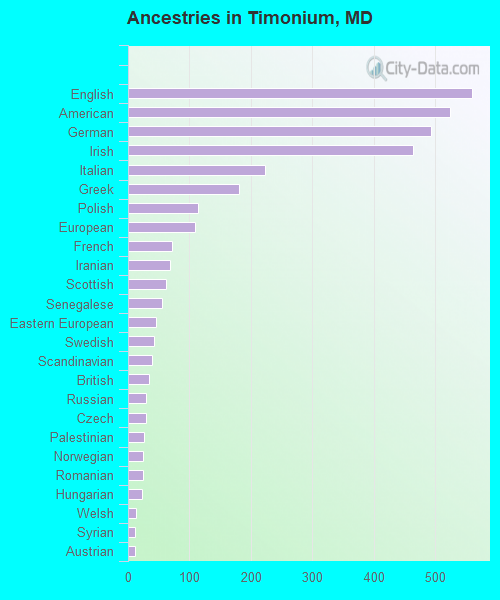
Ancestries in Timonium
560 11.2% English525 10.5% American494 9.9% German465 9.3% Irish223 4.4% Italian180 3.6% Greek114 2.3% Polish109 2.2% European72 1.4% French68 1.4% Iranian62 1.2% Scottish56 1.1% Senegalese46 0.9% Eastern European42 0.8% Swedish39 0.8% Scandinavian34 0.7% British30 0.6% Russian29 0.6% Czech26 0.5% Palestinian25 0.5% Norwegian25 0.5% Romanian23 0.5% Hungarian13 0.3% Welsh12 0.2% Syrian12 0.2% Austrian9 0.2% Dutch9 0.2% Lithuanian9 0.2% Turkish8 0.2% Latvian8 0.2% Jamaican6 0.1% Jordanian4 0.08% Czechoslovakian
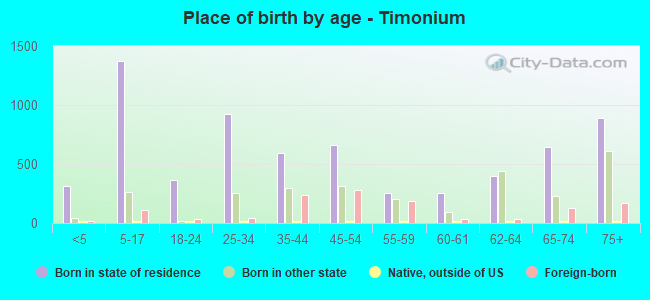
Children Nativity (place of birth) in Timonium
Children under 6 years - Living with two parents Both parents native 342 99.8% Native1 0.2% Foreign-bornBoth parents foreign-born 30 91.2% Native3 8.8% Foreign-bornOne native, one foreign-born parent 61 100.0% NativeChildren under 6 years - Living with one parent Native parent 44 100.0% NativeChildren 6 to 17 years - Living with two parents Both parents native 905 98.5% Native13 1.5% Foreign-bornBoth parents foreign-born 180 69.9% Native77 30.1% Foreign-bornOne native, one foreign-born parent 133 100.0% NativeChildren 6 to 17 years - Living with one parent Native parent 197 100.0% NativeForeign-born parent 54 54.2% Native46 45.8% Foreign-born