Races in Town and Country, Missouri (MO) Detailed Stats
Ancestries, Foreign-born residents, place of birth
Settings
X


Recent posts about races in Town and Country, Missouri on our local forum with over 2,400,000 registered users:
 | STL city falls below 300k in new census estimate... (40 replies) |
| moving to st louis (tentative) (5 replies) |
| Considering moving from Houston to St. Louis, need neighborhood advice (63 replies) |
| Saudia Arabia to Saint Louis (18 replies) |
| Where to buy a new construction house - work in Town & Country (11 replies) |
| St. Louis low cost of living...how? (57 replies) |
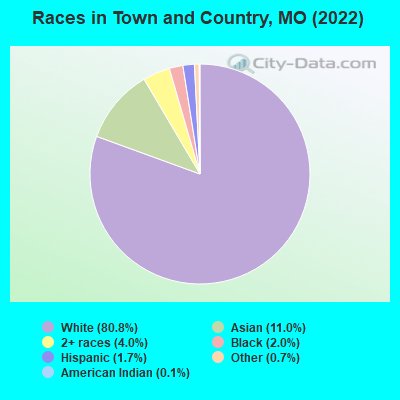
According to 2022 data, the most numerous races in Town and Country, MO are White alone (9,266 residents), Black alone (224 residents), and Two or more races (461 residents). 85.8% of Town and Country residents speak English at home. 12.0% of Town and Country, MO residents are foreign-born (10.3% born in Asia, 1.3% born in Europe), which is 66.6% greater than the foreign-born rate of 4.0% across the entire state of Missouri.
Race distribution in Town and Country
2000
2022

- 9,73889.4%White alone
- 6876.3%Asian alone
- 2182.0%Black alone
- 1241.1%Two or more races
- 1171.1%Hispanic
- 50.05%Other race alone
- 40.04%American Indian alone
- 10.01%Native Hawaiian and Other
Pacific Islander alone

-
- 9,26680.8%White alone
- 1,26111.0%Asian alone
- 4614.0%Two or more races
- 2242.0%Black alone
- 1941.7%Hispanic
- 790.7%Other race alone
- 140.1%American Indian alone
2000
2022
-
- 4,686,47483.8%White alone
- 625,66711.2%Black alone
- 118,5922.1%Hispanic
- 71,9051.3%Two or more races
- 61,0411.1%Asian alone
- 23,3020.4%American Indian alone
- 5,2910.09%Other race alone
- 2,9390.05%Native Hawaiian and Other
Pacific Islander alone

-
- 4,733,41176.6%White alone
- 656,73910.6%Black alone
- 316,3005.1%Two or more races
- 291,7634.7%Hispanic
- 132,4362.1%Asian alone
- 27,4670.4%Other race alone
- 12,3130.2%American Indian alone
- 7,5280.1%Native Hawaiian and Other
Pacific Islander alone

Income and house value in Town and Country
- Median household income in 2022
- over $200,000White non-Hispanic householders
- over $200,000Asian householders
- $167,079Hispanic or Latino race householders
- Median 2022 house value
- $920,830White Non-Hispanic householders
- $566,928Black or African American householders
- over $1,000,000Asian householders
- over $1,000,000Two or more races householders
- $340,197Hispanic or Latino householders
Household income for White non-Hispanic householders

Household income for Asian householders

Household income for Some other race householders

Household income for Two or more races householders

Household income for Hispanic or Latino race householders

Median age by race in Town and Country
- 52.6Median age for White residents
- 53.0Males
- 52.5Females
- 66.0Median age for Black or African American residents
- 74.3Males
- 59.0Females
- 6.5Median age for American Indian / Alaska Native residents
- 8.0Males
- -505,494,505.0Females
- 50.4Median age for Asian residents
- 48.2Males
- 54.7Females
- -710,303,029.6Median age for Native Hawaiian / Pacific Islander residents
- -1,449,781,657.9Males
- -752,136,751.4Females
- 44.7Median age for Other race residents
- 44.7Males
- 40.6Females
- 29.2Median age for Two or more races residents
- 19.8Males
- 26.9Females
- 52.7Median age for White alone residents
- 53.1Males
- 52.6Females
- 18.6Median age for Hispanic or Latino residents
- 20.4Males
- 14.9Females
Owner/renter occupied households by race in Town and Country
- House owners and renters - White residents
- 3,02388.8%Owner occupied
- 38011.2%Renter occupied
- House owners and renters - Black or African American residents
- 15100.0%Owner occupied
- House owners and renters - American Indian / Alaska Native residents
- 5100.0%Owner occupied
- House owners and renters - Asian residents
- 42486.0%Owner occupied
- 6914.0%Renter occupied
- House owners and renters - Other race residents
- 15100.0%Owner occupied
- House owners and renters - Two or more races residents
- 16471.1%Owner occupied
- 6728.9%Renter occupied
- House owners and renters - White alone residents
- 3,01688.7%Owner occupied
- 38611.3%Renter occupied
- House owners and renters - Hispanic or Latino residents
- 41100.0%Owner occupied
Language usage in Town and Country
- English speakers - Total
- 85.8% of residents of Town and Country speak English at home.
- 14.4% of residents speak other language at home
- 1,37185.2%Speak English very well
- 23914.8%Speak English less than very well
- English speakers - Born in the United States
- 97.1% of residents of Town and Country speak English at home.
- 3.2% of residents speak other language at home
- 126100.0%Speak English very well
All residents speak only English at home
- English speakers - Foreign-born
- 11.5% of residents of Town and Country speak English at home.
- 85.5% of residents speak other language at home
- 97882.1%Speak English very well
- 21317.9%Speak English less than very well
White (Caucasian) - Speak only English
| Native: | 98.3% (8,608) |
| Foreign-born: | 11.2% (42) |
White (Caucasian) - Speak another language
| Native: | 1.7% (152) |
| Foreign-born: | 91.1% (341) |
Asian - Speak only English
| Native: | 33.2% (105) |
| Foreign-born: | 13.7% (127) |
Asian - Speak another language
| Native: | 61.0% (194) |
| Foreign-born: | 85.5% (789) |
White alone - Speak only English
| Native: | 98.1% (8,562) |
| Foreign-born: | 9.2% (34) |
White alone - Speak another language
| Native: | 1.9% (162) |
| Foreign-born: | 93.9% (352) |
Hispanic or Latino - Speak only English
| Native: | 100.0% (169) |
| Foreign-born: | 85.0% (10) |
Foreign-born residents in Town and Country
1,373 residents are foreign born (10.3% Asia, 1.3% Europe).
| This city: | 12.0% |
| Missouri: | 4.2% |


Marital status for residents in Town and Country
Marital status - White (Caucasian) population 15 years and over
- Males
- 25.2%Never married
- 66.6%Now married
- 0.2%Separated
- 3.7%Widowed
- 4.3%Divorced
- Females
- 17.1%Never married
- 65.0%Now married
- 0.6%Separated
- 12.2%Widowed
- 5.0%Divorced
Women who gave birth in the past 12 months
| Now married: | 100.0% (37) |
| Unmarried: | 0.0% (0) |
Women who did not give birth in the past 12 months
| Now married: | 58.2% (873) |
| Unmarried: | 41.8% (628) |
Marital status - Black or African American population 15 years and over
- Males
- 57.3%Never married
- 20.2%Now married
- 0.0%Separated
- 4.5%Widowed
- 18.0%Divorced
- Females
- 67.9%Never married
- 3.1%Now married
- 0.0%Separated
- 6.1%Widowed
- 22.9%Divorced
Women who did not give birth in the past 12 months
| Now married: | 0.0% (0) |
| Unmarried: | 100.0% (47) |
Marital status - Asian population 15 years and over
- Males
- 10.9%Never married
- 89.1%Now married
- 0.0%Separated
- 0.0%Widowed
- 0.0%Divorced
- Females
- 12.8%Never married
- 84.0%Now married
- 0.0%Separated
- 3.2%Widowed
- 0.0%Divorced
Women who gave birth in the past 12 months
| Now married: | 100.0% (17) |
| Unmarried: | 0.0% (0) |
Women who did not give birth in the past 12 months
| Now married: | 72.5% (162) |
| Unmarried: | 27.5% (61) |
Marital status - Other race population 15 years and over
- Males
- 33.3%Never married
- 66.7%Now married
- 0.0%Separated
- 0.0%Widowed
- 0.0%Divorced
- Females
- 34.6%Never married
- 65.4%Now married
- 0.0%Separated
- 0.0%Widowed
- 0.0%Divorced
Women who did not give birth in the past 12 months
| Now married: | 47.1% (9) |
| Unmarried: | 52.9% (10) |
Marital status - Two or more races population 15 years and over
- Males
- 24.6%Never married
- 75.4%Now married
- 0.0%Separated
- 0.0%Widowed
- 0.0%Divorced
- Females
- 13.4%Never married
- 82.6%Now married
- 0.0%Separated
- 4.1%Widowed
- 0.0%Divorced
Women who did not give birth in the past 12 months
| Now married: | 85.2% (174) |
| Unmarried: | 14.8% (30) |
Marital status - White alone, not Hispanic / Latino population 15 years and over
- Males
- 24.8%Never married
- 67.0%Now married
- 0.2%Separated
- 3.7%Widowed
- 4.3%Divorced
- Females
- 17.2%Never married
- 65.1%Now married
- 0.7%Separated
- 12.3%Widowed
- 4.7%Divorced
Women who gave birth in the past 12 months
| Now married: | 100.0% (37) |
| Unmarried: | 0.0% (0) |
Women who did not give birth in the past 12 months
| Now married: | 57.6% (860) |
| Unmarried: | 42.4% (633) |
Marital status - Hispanic or Latino population 15 years and over
- Males
- 58.8%Never married
- 41.2%Now married
- 0.0%Separated
- 0.0%Widowed
- 0.0%Divorced
- Females
- 0.0%Never married
- 69.8%Now married
- 0.0%Separated
- 0.0%Widowed
- 30.2%Divorced
Women who did not give birth in the past 12 months
| Now married: | 100.0% (22) |
| Unmarried: | 0.0% (0) |
Ancestries in Town and Country

- 1,02815.9%German
- 1,02215.8%American
- 77912.0%English
- 5698.8%Irish
- 4907.6%Italian
- 2904.5%European
- 1442.2%Scottish
- 1392.1%Polish
- 801.2%Greek
- 751.2%Syrian
- 530.8%Jordanian
- 530.8%Norwegian
- 480.7%Russian
- 440.7%Hungarian
- 420.6%Iraqi
- 420.6%Scotch-Irish
- 410.6%Swiss
- 230.4%Armenian
- 210.3%Iranian
- 210.3%Swedish
- 190.3%Croatian
- 190.3%Northern European
- 170.3%French
- 160.2%Eastern European
- 150.2%Dutch
- 110.2%Lithuanian
- 100.2%Turkish
- 90.1%Austrian
- 80.1%Czechoslovakian
- 80.1%Scandinavian
- 70.1%British

Geographical mobility in Town and Country

- Same house 1 year ago
- 8,30989.5%White (Caucasian)
- 15368.3%Black or African American
- 1369.4%American Indian / Alaska Native
- 1,270100.0%Asian
- 5894.5%Other race
- 48779.1%Two or more races
- 8,31289.8%White alone, not Hispanic / Latino
- 16786.1%Hispanic or Latino

-
- Moved within same county
- 4324.7%White / Caucasian
- 4921.7%Black or African American
- 632.5%American Indian / Alaska Native
- 4284.6%White alone, not Hispanic / Latino

-
- Moved within same state
- 520.6%White / Caucasian
- 52.3%Black or African American
- 30.2%Asian
- 520.6%White alone, not Hispanic / Latino

-
- Moved from different state
- 4855.2%White / Caucasian
- 2210.0%Black or African American
- 60.5%Asian
- 13922.5%Two or more races
- 4775.2%White alone, not Hispanic / Latino
- 168.2%Hispanic or Latino

-
- Moved from abroad
- 70.1%White
- 141.1%Asian
- 189.1%Hispanic or Latino

Children Nativity (place of birth) in Town and Country
Place of birth for residents in Town and Country
![Place of birth for the foreign-born population - Regions]()
- 1,164Asia
- 584South Central Asia
- 227Western Asia
- 193Eastern Asia
- 193China
- 157South Eastern Asia
- 146Europe
- 55Southern Europe
- 46Western Europe
- 44Americas
- 37Eastern Europe
- 25Latin America
- 18Africa
- 18Northern America
- 17Southern Africa
- 14South America
- 10Central America
- 6Northern Europe

![Place of birth for the foreign-born population - Countries]()
- 385India
- 164China
- 144Pakistan
- 70Philippines
- 51Saudi Arabia
- 50Syria
- 43Indonesia
- 40Israel
- 38Uzbekistan
- 38Jordan
- 37Switzerland
- 33Greece
- 29Thailand
- 25Turkey
- 22Italy
- 21Iraq
- 19Poland
- 19Hong Kong
- 18Canada
- 17South Africa
- 16Iran
- 14Brazil
- 10Singapore
- 10Guatemala
- 9Germany
- 9Russia
- 9Taiwan
- 7Belarus
- 6England
- 1Burma (Myanmar)
- 1Vietnam

Zip codes: 63131.