Races in Towson, Maryland (MD) Detailed Stats
Data:
Races - White alone (%)
Races - White alone (% change since 2000)
Races - Black alone (%)
Races - Black alone (% change since 2000)
Races - American Indian alone (%)
Races - American Indian alone (% change since 2000)
Races - Asian alone (%)
Races - Asian alone (% change since 2000)
Races - Hispanic (%)
Races - Hispanic (% change since 2000)
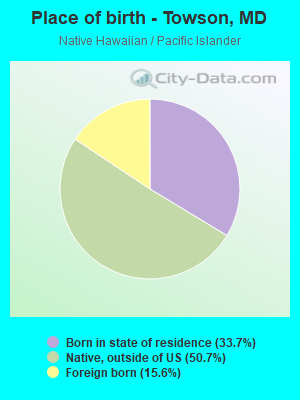
Races - Native Hawaiian and Other Pacific Islander alone (%)
Races - Native Hawaiian and Other Pacific Islander alone (% change since 2000)
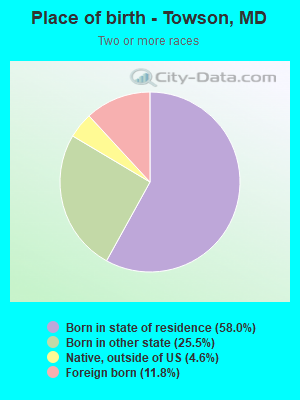
Races - Two or more races(%)
Races - Two or more races(% change since 2000)
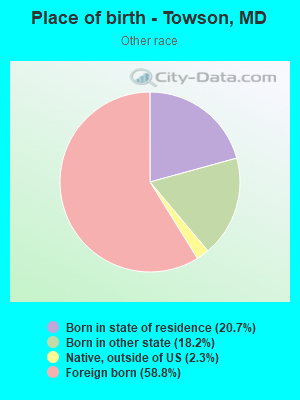
Races - Other race alone (%)
Races - Other race alone (% change since 2000)
Racial diversity
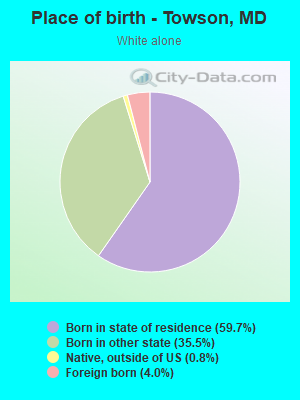
Place of birth - Born in state of residence (%)
Place of birth - Born in state of residence (%) - White
Place of birth - Born in state of residence (%) - Black or African American
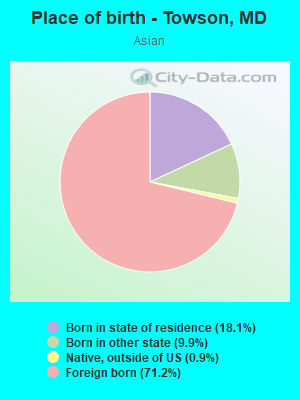
Place of birth - Born in state of residence (%) - Asian
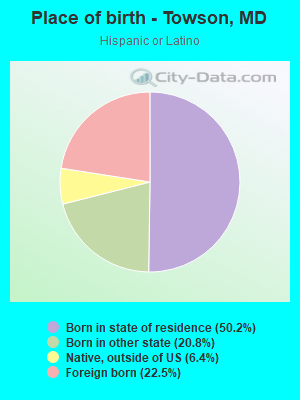
Place of birth - Born in state of residence (%) - Hispanic or Latino
Place of birth - Born in state of residence (%) - American Indian and Alaska Native
Place of birth - Born in state of residence (%) - Multirace
Place of birth - Born in state of residence (%) - Other Race
Place of birth - Born in other state (%)
Place of birth - Born in other state (%) - White
Place of birth - Born in other state (%) - Black or African American
Place of birth - Born in other state (%) - Asian
Place of birth - Born in other state (%) - Hispanic or Latino
Place of birth - Born in other state (%) - American Indian and Alaska Native
Place of birth - Born in other state (%) - Multirace
Place of birth - Born in other state (%) - Other Race
Place of birth - Native, outside of US (%)
Place of birth - Native, outside of US (%) - White
Place of birth - Native, outside of US (%) - Black or African American
Place of birth - Native, outside of US (%) - Asian
Place of birth - Native, outside of US (%) - Hispanic or Latino
Place of birth - Native, outside of US (%) - American Indian and Alaska Native
Place of birth - Native, outside of US (%) - Multirace
Place of birth - Native, outside of US (%) - Other Race
Place of birth - Foreign born (%)
Place of birth - Foreign born (%) - White
Place of birth - Foreign born (%) - Black or African American
Place of birth - Foreign born (%) - Asian
Place of birth - Foreign born (%) - Hispanic or Latino
Place of birth - Foreign born (%) - American Indian and Alaska Native
Place of birth - Foreign born (%) - Multirace
Place of birth - Foreign born (%) - Other Race
Residents speaking English at home (%)
Residents speaking English at home - Born in the United States (%)
Residents speaking English at home - Native, born elsewhere (%)
Residents speaking English at home - Foreign born (%)
Residents speaking Spanish at home (%)
Residents speaking Spanish at home - Born in the United States (%)
Residents speaking Spanish at home - Native, born elsewhere (%)
Residents speaking Spanish at home - Foreign born (%)
Residents speaking other language at home (%)
Residents speaking other language at home - Born in the United States (%)
Residents speaking other language at home - Native, born elsewhere (%)
Residents speaking other language at home - Foreign born (%)
Marital status - Never married (%)
Marital status - Now married (%)
Marital status - Separated (%)
Marital status - Widowed (%)
Marital status - Divorced (%)
Ancestries Reported - Arab (%)
Ancestries Reported - Czech (%)
Ancestries Reported - Danish (%)
Ancestries Reported - Dutch (%)
Ancestries Reported - English (%)
Ancestries Reported - French (%)
Ancestries Reported - French Canadian (%)
Ancestries Reported - German (%)
Ancestries Reported - Greek (%)
Ancestries Reported - Hungarian (%)
Ancestries Reported - Irish (%)
Ancestries Reported - Italian (%)
Ancestries Reported - Lithuanian (%)
Ancestries Reported - Norwegian (%)
Ancestries Reported - Polish (%)
Ancestries Reported - Portuguese (%)
Ancestries Reported - Russian (%)
Ancestries Reported - Scotch-Irish (%)
Ancestries Reported - Scottish (%)
Ancestries Reported - Slovak (%)
Ancestries Reported - Subsaharan African (%)
Ancestries Reported - Swedish (%)
Ancestries Reported - Swiss (%)
Ancestries Reported - Ukrainian (%)
Ancestries Reported - United States (%)
Ancestries Reported - Welsh (%)
Ancestries Reported - West Indian (%)
Ancestries Reported - Other (%)
Geographical mobility - Same house 1 year ago (%)
Geographical mobility - Same house 1 year ago (%) - White
Geographical mobility - Same house 1 year ago (%) - Black or African American
Geographical mobility - Same house 1 year ago (%) - Asian
Geographical mobility - Same house 1 year ago (%) - Hispanic or Latino
Geographical mobility - Same house 1 year ago (%) - American Indian and Alaska Native
Geographical mobility - Same house 1 year ago (%) - Multirace
Geographical mobility - Same house 1 year ago (%) - Other Race
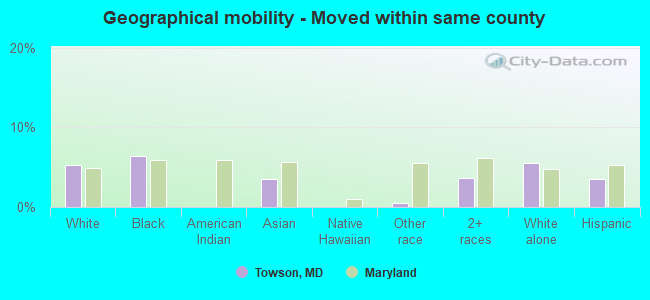
Geographical mobility - Moved within same county (%)
Geographical mobility - Moved within same county (%) - White
Geographical mobility - Moved within same county (%) - Black or African American
Geographical mobility - Moved within same county (%) - Asian
Geographical mobility - Moved within same county (%) - Hispanic or Latino
Geographical mobility - Moved within same county (%) - American Indian and Alaska Native
Geographical mobility - Moved within same county (%) - Multirace
Geographical mobility - Moved within same county (%) - Other Race
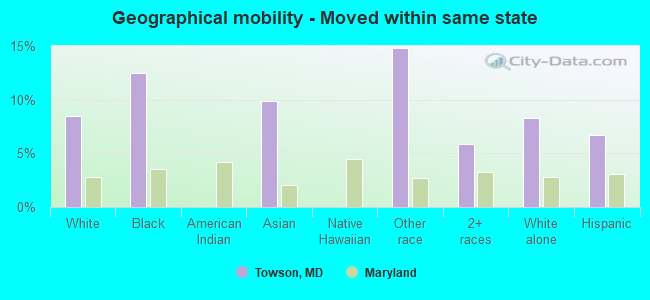
Geographical mobility - Moved from different county within same state (%)
Geographical mobility - Moved from different county within same state (%) - White
Geographical mobility - Moved from different county within same state (%) - Black or African American
Geographical mobility - Moved from different county within same state (%) - Asian
Geographical mobility - Moved from different county within same state (%) - Hispanic or Latino
Geographical mobility - Moved from different county within same state (%) - American Indian and Alaska Native
Geographical mobility - Moved from different county within same state (%) - Multirace
Geographical mobility - Moved from different county within same state (%) - Other Race
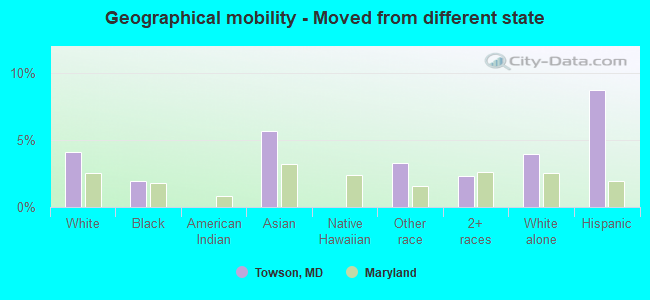
Geographical mobility - Moved from different state (%)
Geographical mobility - Moved from different state (%) - White
Geographical mobility - Moved from different state (%) - Black or African American
Geographical mobility - Moved from different state (%) - Asian
Geographical mobility - Moved from different state (%) - Hispanic or Latino
Geographical mobility - Moved from different state (%) - American Indian and Alaska Native
Geographical mobility - Moved from different state (%) - Multirace
Geographical mobility - Moved from different state (%) - Other Race
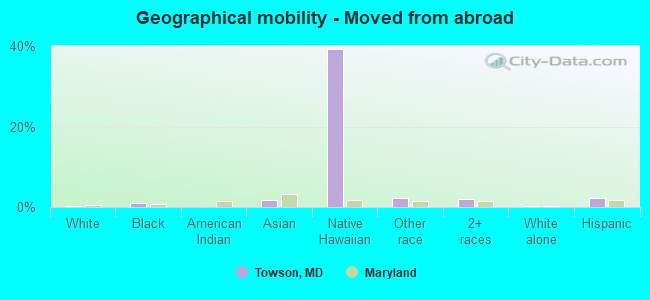
Geographical mobility - Moved from abroad (%)
Geographical mobility - Moved from abroad (%) - White
Geographical mobility - Moved from abroad (%) - Black or African American
Geographical mobility - Moved from abroad (%) - Asian
Geographical mobility - Moved from abroad (%) - Hispanic or Latino
Geographical mobility - Moved from abroad (%) - American Indian and Alaska Native
Geographical mobility - Moved from abroad (%) - Multirace
Geographical mobility - Moved from abroad (%) - Other Race
Place of birth for the foreign-born population - Ireland (%)
Place of birth for the foreign-born population - Denmark (%)
Place of birth for the foreign-born population - Norway (%)
Place of birth for the foreign-born population - Sweden (%)
Place of birth for the foreign-born population - United Kingdom (%)
Place of birth for the foreign-born population - England (%)
Place of birth for the foreign-born population - Scotland (%)
Place of birth for the foreign-born population - Other Northern Europe (%)
Place of birth for the foreign-born population - Austria (%)
Place of birth for the foreign-born population - Belgium (%)
Place of birth for the foreign-born population - France (%)
Place of birth for the foreign-born population - Germany (%)
Place of birth for the foreign-born population - Netherlands (%)
Place of birth for the foreign-born population - Switzerland (%)
Place of birth for the foreign-born population - Other Western Europe (%)
Place of birth for the foreign-born population - Greece (%)
Place of birth for the foreign-born population - Italy (%)
Place of birth for the foreign-born population - Portugal (%)
Place of birth for the foreign-born population - Spain (%)
Place of birth for the foreign-born population - Other Southern Europe (%)
Place of birth for the foreign-born population - Albania (%)
Place of birth for the foreign-born population - Belarus (%)
Place of birth for the foreign-born population - Bosnia and Herzegovina (%)
Place of birth for the foreign-born population - Bulgaria (%)
Place of birth for the foreign-born population - Croatia (%)
Place of birth for the foreign-born population - Czechoslovakia (%)
Place of birth for the foreign-born population - Hungary (%)
Place of birth for the foreign-born population - Latvia (%)
Place of birth for the foreign-born population - Lithuania (%)
Place of birth for the foreign-born population - North Macedonia (Macedonia) (%)
Place of birth for the foreign-born population - Moldova (%)
Place of birth for the foreign-born population - Poland (%)
Place of birth for the foreign-born population - Romania (%)
Place of birth for the foreign-born population - Russia (%)
Place of birth for the foreign-born population - Serbia (%)
Place of birth for the foreign-born population - Ukraine (%)
Place of birth for the foreign-born population - Other Eastern Europe (%)
Place of birth for the foreign-born population - China (%)
Place of birth for the foreign-born population - Hong Kong (%)
Place of birth for the foreign-born population - Taiwan (%)
Place of birth for the foreign-born population - Japan (%)
Place of birth for the foreign-born population - Korea (%)
Place of birth for the foreign-born population - Other Eastern Asia (%)
Place of birth for the foreign-born population - Afghanistan (%)
Place of birth for the foreign-born population - Bangladesh (%)
Place of birth for the foreign-born population - India (%)
Place of birth for the foreign-born population - Iran (%)
Place of birth for the foreign-born population - Kazakhstan (%)
Place of birth for the foreign-born population - Nepal (%)
Place of birth for the foreign-born population - Pakistan (%)
Place of birth for the foreign-born population - Sri Lanka (%)
Place of birth for the foreign-born population - Uzbekistan (%)
Place of birth for the foreign-born population - Other South Central Asia (%)
Place of birth for the foreign-born population - Burma (%)
Place of birth for the foreign-born population - Cambodia (%)
Place of birth for the foreign-born population - Indonesia (%)
Place of birth for the foreign-born population - Laos (%)
Place of birth for the foreign-born population - Malaysia (%)
Place of birth for the foreign-born population - Philippines (%)
Place of birth for the foreign-born population - Singapore (%)
Place of birth for the foreign-born population - Thailand (%)
Place of birth for the foreign-born population - Vietnam (%)
Place of birth for the foreign-born population - Other South Eastern Asia (%)
Place of birth for the foreign-born population - Armenia (%)
Place of birth for the foreign-born population - Iraq (%)
Place of birth for the foreign-born population - Israel (%)
Place of birth for the foreign-born population - Jordan (%)
Place of birth for the foreign-born population - Kuwait (%)
Place of birth for the foreign-born population - Lebanon (%)
Place of birth for the foreign-born population - Saudi Arabia (%)
Place of birth for the foreign-born population - Syria (%)
Place of birth for the foreign-born population - Turkey (%)
Place of birth for the foreign-born population - Yemen (%)
Place of birth for the foreign-born population - Other Western Asia (%)
Place of birth for the foreign-born population - Eritrea (%)
Place of birth for the foreign-born population - Ethiopia (%)
Place of birth for the foreign-born population - Kenya (%)
Place of birth for the foreign-born population - Somalia (%)
Place of birth for the foreign-born population - Uganda (%)
Place of birth for the foreign-born population - Zimbabwe (%)
Place of birth for the foreign-born population - Other Eastern Africa (%)
Place of birth for the foreign-born population - Cameroon (%)
Place of birth for the foreign-born population - Congo (%)
Place of birth for the foreign-born population - Democratic Republic of Congo (Zaire) (%)
Place of birth for the foreign-born population - Other Middle Africa (%)
Place of birth for the foreign-born population - Egypt (%)
Place of birth for the foreign-born population - Morocco (%)
Place of birth for the foreign-born population - Sudan (%)
Place of birth for the foreign-born population - Other Northern Africa (%)
Place of birth for the foreign-born population - South Africa (%)
Place of birth for the foreign-born population - Other Southern Africa (%)
Place of birth for the foreign-born population - Cabo Verde (%)
Place of birth for the foreign-born population - Ghana (%)
Place of birth for the foreign-born population - Liberia (%)
Place of birth for the foreign-born population - Nigeria (%)
Place of birth for the foreign-born population - Senegal (%)
Place of birth for the foreign-born population - Sierra Leone (%)
Place of birth for the foreign-born population - Other Western Africa (%)
Place of birth for the foreign-born population - Australia (%)
Place of birth for the foreign-born population - New Zealand (%)
Place of birth for the foreign-born population - Fiji (%)
Place of birth for the foreign-born population - Micronesia (%)
Place of birth for the foreign-born population - Bahamas (%)
Place of birth for the foreign-born population - Barbados (%)
Place of birth for the foreign-born population - Cuba (%)
Place of birth for the foreign-born population - Dominica (%)
Place of birth for the foreign-born population - Dominican Republic (%)
Place of birth for the foreign-born population - Grenada (%)
Place of birth for the foreign-born population - Haiti (%)
Place of birth for the foreign-born population - Jamaica (%)
Place of birth for the foreign-born population - St. Vincent and the Grenadines (%)
Place of birth for the foreign-born population - Trinidad and Tobago (%)
Place of birth for the foreign-born population - West Indies (%)
Place of birth for the foreign-born population - Other Caribbean (%)
Place of birth for the foreign-born population - Belize (%)
Place of birth for the foreign-born population - Costa Rica (%)
Place of birth for the foreign-born population - El Salvador (%)
Place of birth for the foreign-born population - Guatemala (%)
Place of birth for the foreign-born population - Honduras (%)
Place of birth for the foreign-born population - Mexico (%)
Place of birth for the foreign-born population - Nicaragua (%)
Place of birth for the foreign-born population - Panama (%)
Place of birth for the foreign-born population - Other Central America (%)
Place of birth for the foreign-born population - Argentina (%)
Place of birth for the foreign-born population - Bolivia (%)
Place of birth for the foreign-born population - Brazil (%)
Place of birth for the foreign-born population - Chile (%)
Place of birth for the foreign-born population - Colombia (%)
Place of birth for the foreign-born population - Ecuador (%)
Place of birth for the foreign-born population - Guyana (%)
Place of birth for the foreign-born population - Peru (%)
Place of birth for the foreign-born population - Uruguay (%)
Place of birth for the foreign-born population - Venezuela (%)
Place of birth for the foreign-born population - Other South America (%)
Place of birth for the foreign-born population - Canada (%)
Place of birth for the foreign-born population - Other Northern America (%)
Place of birth for the foreign-born population - Other (%)
Latest news about races in Towson, MD collected exclusively by city-data.com from local newspapers, TV, and radio stations
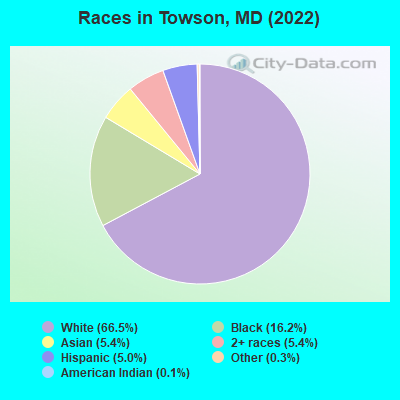
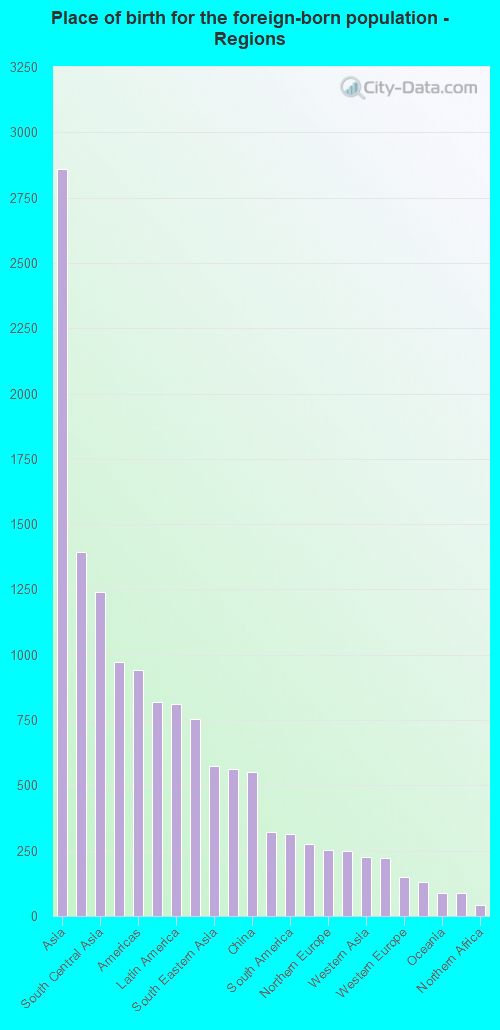
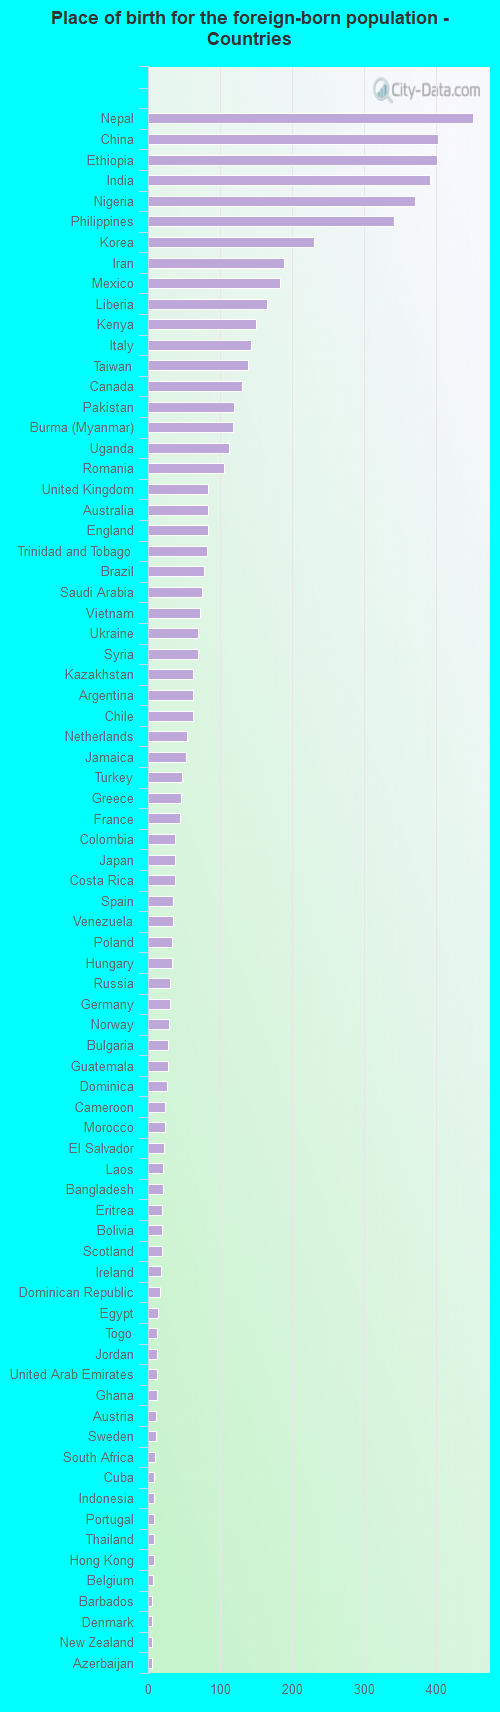
According to 2022 data, the most numerous races in Towson, MD are White alone (38,124 residents), Black alone (9,260 residents), and Hispanic (2,894 residents). 88.6% of Towson residents speak English at home. 10.9% of Towson, MD residents are foreign-born (4.7% born in Asia, 2.3% born in Africa, 1.6% born in Europe, 1.3% born in Latin America), which is 46.4% less than the foreign-born rate of 16.0% across the entire state of Maryland.
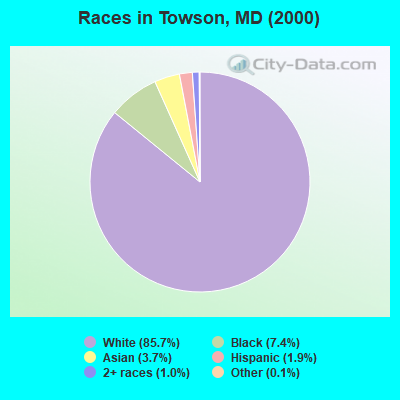
Race distribution in Towson
2000 2022
3,286,547 62.1% White alone 1,464,735 27.7% Black alone 227,916 4.3% Hispanic 209,738 4.0% Asian alone 82,946 1.6% Two or more races 13,312 0.3% American Indian alone 9,379 0.2% Other race alone 1,913 0.04% Native Hawaiian and Other
2,906,492 47.1% White alone 1,800,914 29.2% Black alone 705,842 11.4% Hispanic 401,818 6.5% Asian alone 291,317 4.7% Two or more races 46,930 0.8% Other race alone 8,930 0.1% American Indian alone 2,417 0.04% Native Hawaiian and Other
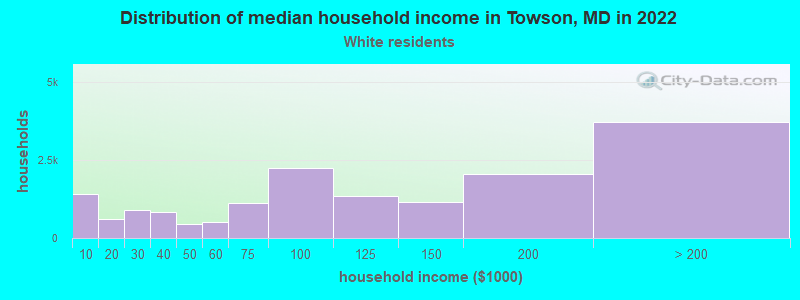
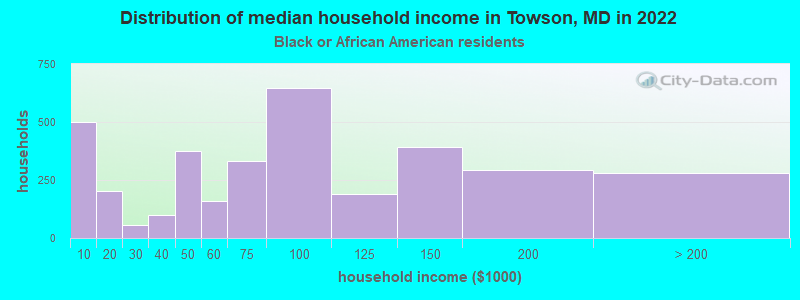
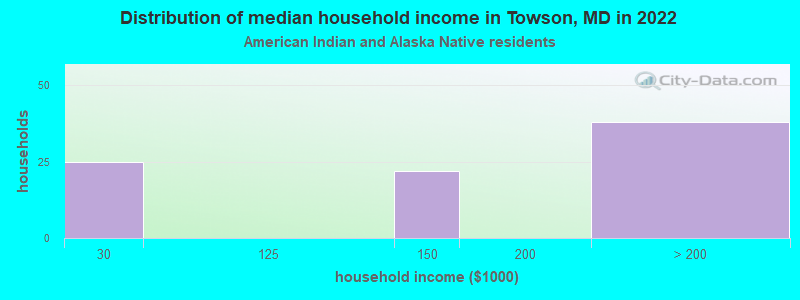
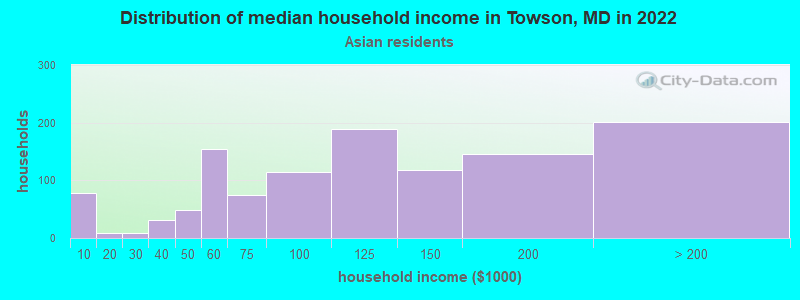
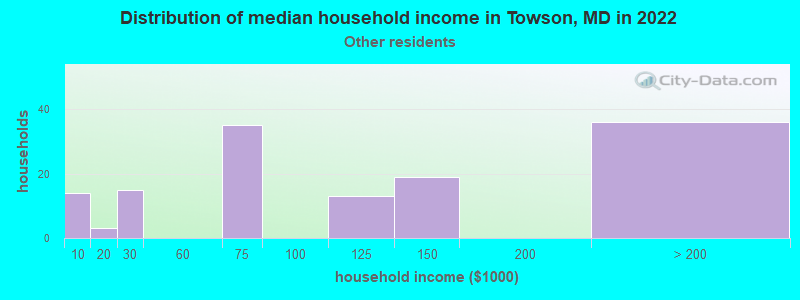
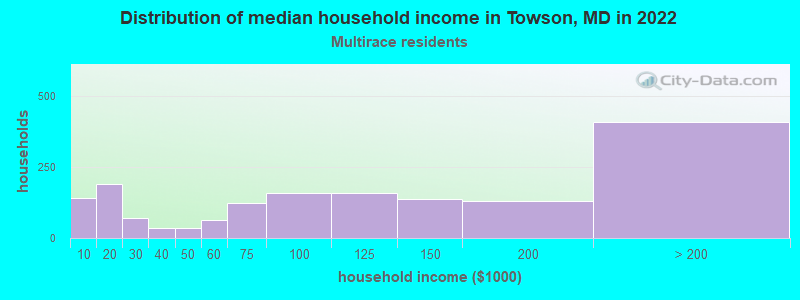
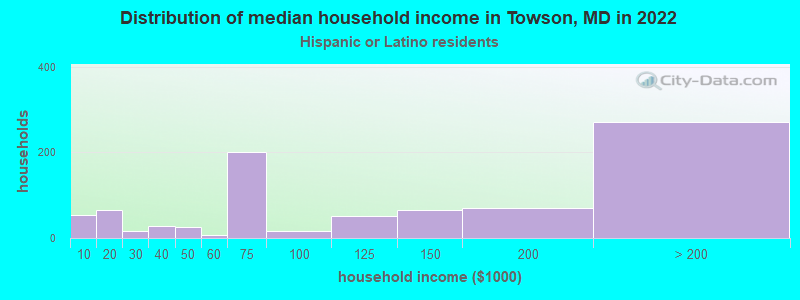
Income and house value in Towson Median household income in 2022 $99,460 White non-Hispanic householders$77,438 Black householders$112,441 American Indian and Alaska Native householders$110,726 Asian householders$106,001 Some other race householders$95,160 Two or more races householders$100,647 Hispanic or Latino race householdersMedian 2022 house value $443,619 White Non-Hispanic householders$352,784 Black or African American householders$312,505 American Indian or Alaska Native householders $407,507 Asian householders$347,228 Some other race householders$329,172 Two or more races householders$376,395 Hispanic or Latino householders
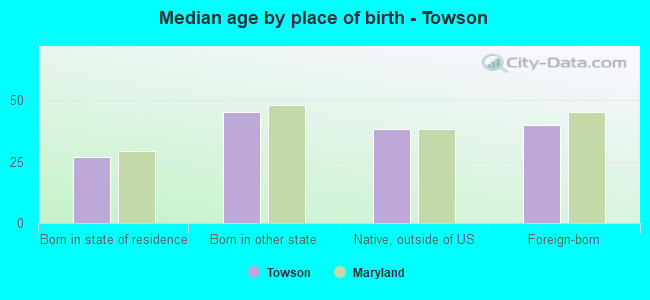
Median age by race in Towson
38.2 Median age for White residents36.9 39.4 28.5 Median age for Black or African American residents29.9 26.0 51.6 Median age for American Indian / Alaska Native residents37.0 62.7 33.8 Median age for Asian residents32.8 35.6 55.7 Median age for Native Hawaiian / Pacific Islander residents-790,901,136.6 -760,942,760.2 34.7 Median age for Other race residents43.1 31.2 22.0 Median age for Two or more races residents26.7 19.5 38.5 Median age for White alone residents36.9 40.0 23.6 Median age for Hispanic or Latino residents27.5 20.9
Owner/renter occupied households by race in Towson
House owners and renters - White residents 11,062 67.8% Owner occupied5,243 32.2% Renter occupiedHouse owners and renters - Black or African American residents 517 16.7% Owner occupied2,577 83.3% Renter occupiedHouse owners and renters - American Indian / Alaska Native residents 85 82.4% Owner occupied18 17.6% Renter occupiedHouse owners and renters - Asian residents 594 47.7% Owner occupied652 52.3% Renter occupiedHouse owners and renters - Native Hawaiian / Pacific Islander residents 9 100.0% Renter occupiedHouse owners and renters - Other race residents 98 57.5% Owner occupied72 42.5% Renter occupiedHouse owners and renters - Two or more races residents 761 46.6% Owner occupied873 53.4% Renter occupiedHouse owners and renters - White alone residents 10,929 67.7% Owner occupied5,222 32.3% Renter occupiedHouse owners and renters - Hispanic or Latino residents 612 61.5% Owner occupied383 38.5% Renter occupied
Language usage in Towson
English speakers - Total 88.6% of residents of Towson speak English at home.
2.3% of residents speak Spanish at home 1,059 84.1% Speak English very well200 15.9% Speak English less than very well9.1% of residents speak other language at home 3,612 72.2% Speak English very well1,388 27.8% Speak English less than very well
English speakers - Born in the United States 95.7% of residents of Towson speak English at home.
1.9% of residents speak Spanish at home 305 96.5% Speak English very well11 3.5% Speak English less than very well2.9% of residents speak other language at home 348 72.5% Speak English very well132 27.5% Speak English less than very well
English speakers - Native, born elsewhere 71.9% of residents of Towson speak English at home.
9.1% of residents speak Spanish at home 39 54.2% Speak English very well33 45.8% Speak English less than very well15.2% of residents speak other language at home 92 76.7% Speak English very well28 23.3% Speak English less than very well
English speakers - Foreign-born 35.6% of residents of Towson speak English at home.
7.0% of residents speak Spanish at home 371 86.1% Speak English very well60 13.9% Speak English less than very well57.1% of residents speak other language at home 2,467 69.7% Speak English very well1,070 30.3% Speak English less than very well
White (Caucasian) - Speak only English Native:
97.8% (35,064)Foreign-born:
43.6% (644)
White (Caucasian) - Speak another language Native:
2.3% (811)Foreign-born:
58.0% (858)
Black or African American - Speak only English Native:
95.5% (7,309)Foreign-born:
68.4% (977)
Black or African American - Speak another language Native:
4.0% (308)Foreign-born:
38.9% (555)
Asian - Speak only English Native:
36.8% (265)Foreign-born:
15.9% (356)
Asian - Speak another language Native:
63.1% (454)Foreign-born:
84.5% (1,894)
Other race - Speak only English Native:
67.7% (174)Foreign-born:
7.1% (26)
Other race - Speak another language Native:
32.9% (84)Foreign-born:
93.9% (352)
Two or more races - Speak only English Native:
89.2% (3,320)Foreign-born:
20.9% (102)
Two or more races - Speak another language Native:
9.8% (364)Foreign-born:
70.1% (342)
White alone - Speak only English Native:
98.1% (34,607)Foreign-born:
37.7% (578)
White alone - Speak another language Native:
1.9% (683)Foreign-born:
61.7% (946)
Hispanic or Latino - Speak only English Native:
74.4% (1,522)Foreign-born:
20.5% (129)
Hispanic or Latino - Speak another language Native:
30.1% (616)Foreign-born:
79.4% (500)
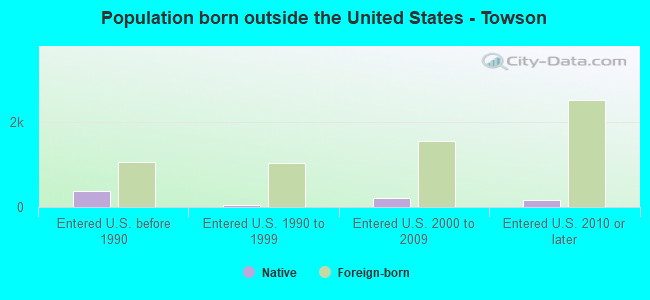
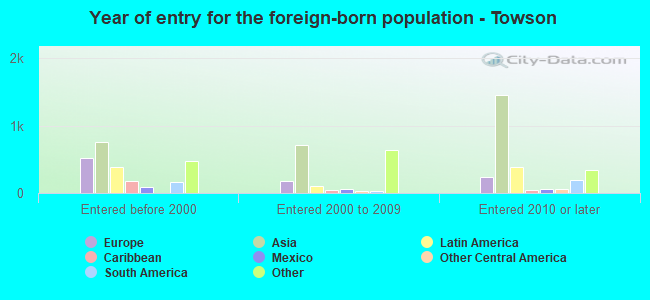
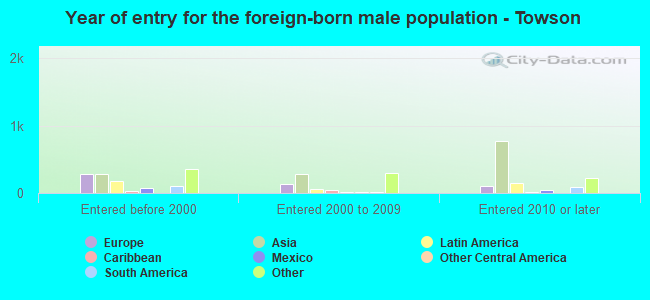
Foreign-born residents in Towson 6,264 residents are foreign born (4.7% Asia , 2.3% Africa , 1.6% Europe , 1.3% Latin America ).
This city:
10.9%Maryland:
15.7%
Marital status for residents in Towson Marital status - White (Caucasian) population 15 years and over
Males 39.9% Never married48.2% Now married1.8% Separated3.0% Widowed7.1% DivorcedFemales 37.1% Never married41.1% Now married1.1% Separated10.7% Widowed10.0% DivorcedWomen who gave birth in the past 12 months Now married:
77.1% (280)Unmarried:
22.9% (83)
Women who did not give birth in the past 12 months Now married:
35.3% (3,399)Unmarried:
64.7% (6,220)
Marital status - Black or African American population 15 years and over
Males 57.0% Never married22.1% Now married4.4% Separated3.2% Widowed13.4% DivorcedFemales 70.0% Never married12.1% Now married2.5% Separated7.8% Widowed7.7% DivorcedWomen who gave birth in the past 12 months Now married:
73.0% (54)Unmarried:
27.0% (20)
Women who did not give birth in the past 12 months Now married:
5.6% (176)Unmarried:
94.4% (3,000)
Marital status - American Indian / Alaska Native population 15 years and over
Males 59.0% Never married41.0% Now married0.0% Separated0.0% Widowed0.0% DivorcedFemales 28.1% Never married31.2% Now married0.0% Separated40.6% Widowed0.0% DivorcedWomen who did not give birth in the past 12 months Now married:
100.0% (15)Unmarried:
0.0% (0)
Marital status - Asian population 15 years and over
Males 37.6% Never married58.4% Now married0.0% Separated1.6% Widowed2.4% DivorcedFemales 32.6% Never married54.1% Now married0.0% Separated4.7% Widowed8.6% DivorcedWomen who gave birth in the past 12 months Now married:
100.0% (24)Unmarried:
0.0% (0)
Women who did not give birth in the past 12 months Now married:
52.0% (510)Unmarried:
48.0% (471)
Marital status - Native Hawaiian / Pacific Islander population 15 years and over
Males 38.5% Never married61.5% Now married0.0% Separated0.0% Widowed0.0% DivorcedFemales 0.0% Never married100.0% Now married0.0% Separated0.0% Widowed0.0% DivorcedWomen who did not give birth in the past 12 months Now married:
100.0% (7)Unmarried:
0.0% (0)
Marital status - Other race population 15 years and over
Males 37.8% Never married57.7% Now married0.0% Separated4.5% Widowed0.0% DivorcedFemales 64.5% Never married35.5% Now married0.0% Separated0.0% Widowed0.0% DivorcedWomen who did not give birth in the past 12 months Now married:
40.3% (91)Unmarried:
59.7% (135)
Marital status - Two or more races population 15 years and over
Males 58.7% Never married33.8% Now married0.0% Separated0.6% Widowed6.9% DivorcedFemales 54.6% Never married32.8% Now married2.4% Separated0.0% Widowed10.2% DivorcedWomen who gave birth in the past 12 months Now married:
100.0% (14)Unmarried:
0.0% (0)
Women who did not give birth in the past 12 months Now married:
29.5% (380)Unmarried:
70.5% (909)
Marital status - White alone, not Hispanic / Latino population 15 years and over
Males 40.0% Never married48.1% Now married1.7% Separated3.1% Widowed7.1% DivorcedFemales 36.6% Never married41.3% Now married1.1% Separated10.9% Widowed10.2% DivorcedWomen who gave birth in the past 12 months Now married:
76.8% (278)Unmarried:
23.2% (84)
Women who did not give birth in the past 12 months Now married:
35.6% (3,349)Unmarried:
64.4% (6,050)
Marital status - Hispanic or Latino population 15 years and over
Males 41.0% Never married49.6% Now married4.5% Separated0.0% Widowed4.8% DivorcedFemales 53.7% Never married35.7% Now married1.0% Separated0.8% Widowed8.8% DivorcedWomen who gave birth in the past 12 months Now married:
100.0% (9)Unmarried:
0.0% (0)
Women who did not give birth in the past 12 months Now married:
37.0% (341)Unmarried:
63.0% (581)
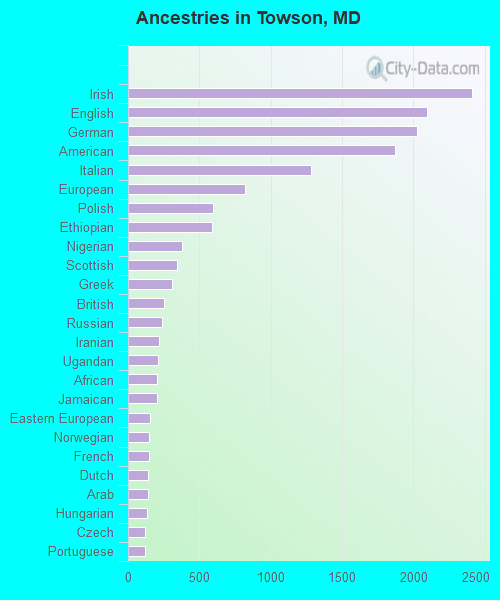
Ancestries in Towson
2,411 8.9% Irish2,096 7.7% English2,024 7.4% German1,869 6.9% American1,280 4.7% Italian823 3.0% European593 2.2% Polish592 2.2% Ethiopian379 1.4% Nigerian344 1.3% Scottish308 1.1% Greek251 0.9% British241 0.9% Russian215 0.8% Iranian207 0.8% Ugandan205 0.8% African204 0.7% Jamaican154 0.6% Eastern European147 0.5% Norwegian145 0.5% French143 0.5% Dutch137 0.5% Arab131 0.5% Hungarian122 0.4% Czech120 0.4% Portuguese110 0.4% Scotch-Irish106 0.4% Swedish104 0.4% Syrian101 0.4% Northern European98 0.4% Trinidadian and Tobagonian85 0.3% Ukrainian71 0.3% Romanian58 0.2% Turkish56 0.2% Haitian54 0.2% West Indian47 0.2% Brazilian43 0.2% Kenyan42 0.2% Lithuanian41 0.2% Welsh39 0.1% Israeli38 0.1% Armenian38 0.1% French Canadian31 0.1% Scandinavian27 0.10% Swiss26 0.10% Danish23 0.08% Egyptian22 0.08% Austrian21 0.08% Slavic17 0.06% Ghanaian16 0.06% Australian15 0.06% Canadian14 0.05% Latvian12 0.04% Maltese11 0.04% Czechoslovakian11 0.04% Finnish11 0.04% Estonian10 0.04% Belizean9 0.03% Belgian9 0.03% Lebanese9 0.03% Sierra Leonean9 0.03% Luxembourger8 0.03% Slovak7 0.03% German Russian6 0.02% Bulgarian4 0.01% Liberian3 0.01% Jordanian
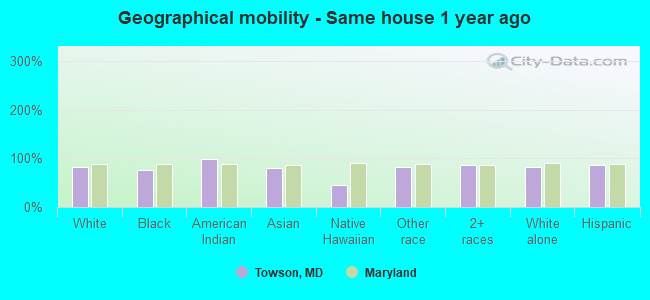
Geographical mobility in Towson Same house 1 year ago 31,524 82.2% White (Caucasian)7,139 76.3% Black or African American158 98.9% American Indian / Alaska Native2,475 79.9% Asian13 44.9% Native Hawaiian / Pacific Islander431 81.2% Other race3,759 85.4% Two or more races31,140 82.2% White alone, not Hispanic / Latino2,437 86.4% Hispanic or LatinoMoved within same county 2,004 5.2% White / Caucasian597 6.4% Black or African American109 3.5% Asian3 0.5% Other race160 3.6% Two or more races2,071 5.5% White alone, not Hispanic / Latino98 3.5% Hispanic or LatinoMoved within same state 3,263 8.5% White / Caucasian1,167 12.5% Black or African American307 9.9% Asian78 14.8% Other race258 5.9% Two or more races3,146 8.3% White alone, not Hispanic / Latino188 6.7% Hispanic or LatinoMoved from different state 1,569 4.1% White / Caucasian183 2.0% Black or African American175 5.7% Asian17 3.3% Other race100 2.3% Two or more races1,487 3.9% White alone, not Hispanic / Latino245 8.7% Hispanic or LatinoMoved from abroad 130 0.3% White83 0.9% Black or African American57 1.8% Asian11 39.2% Native Hawaiian / Pacific Islander12 2.2% Other race90 2.0% Two or more races129 0.3% White alone, not Hispanic / Latino63 2.2% Hispanic or Latino
Children Nativity (place of birth) in Towson
Children under 6 years - Living with two parents Both parents native 1,708 99.5% Native8 0.5% Foreign-bornBoth parents foreign-born 237 86.2% Native38 13.8% Foreign-bornOne native, one foreign-born parent 189 100.0% NativeChildren under 6 years - Living with one parent Native parent 617 100.0% NativeForeign-born parent 13 100.0% NativeChildren 6 to 17 years - Living with two parents Both parents native 4,293 99.1% Native39 0.9% Foreign-bornBoth parents foreign-born 311 73.9% Native110 26.1% Foreign-bornOne native, one foreign-born parent 505 99.2% Native4 0.8% Foreign-bornChildren 6 to 17 years - Living with one parent Native parent 1,327 100.0% NativeForeign-born parent 205 57.9% Native149 42.1% Foreign-born
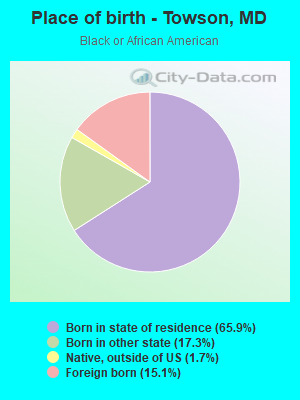
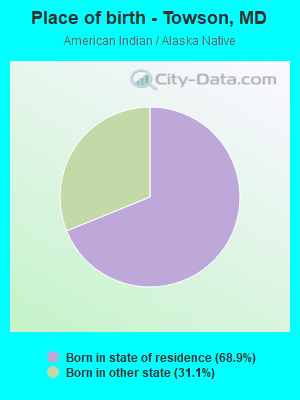
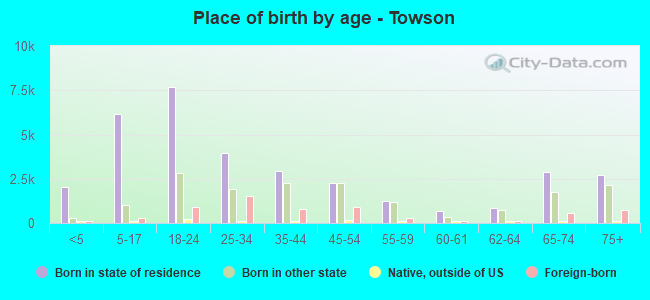
Place of birth for residents in Towson
Grandparents responsible for own grandchildren in Towson
Grandparents (30 to 59 years) White / Caucasian 6 100.0% Responsible for grandchildrenBlack or African American 2 100.0% Not responsible for grandchildrenWhite alone, not Hispanic / Latino 6 100.0% Responsible for grandchildrenGrandparents (60 years and over) White / Caucasian 85 26.9% Responsible for grandchildren232 73.1% Not responsible for grandchildrenBlack or African American 8 14.3% Responsible for grandchildren46 85.7% Not responsible for grandchildrenWhite alone, not Hispanic / Latino 76 23.9% Responsible for grandchildren243 76.1% Not responsible for grandchildren