Races in Tracy, California (CA) Detailed Stats
Data:
Races - White alone (%)
Races - White alone (% change since 2000)
Races - Black alone (%)
Races - Black alone (% change since 2000)
Races - American Indian alone (%)
Races - American Indian alone (% change since 2000)
Races - Asian alone (%)
Races - Asian alone (% change since 2000)
Races - Hispanic (%)
Races - Hispanic (% change since 2000)
Races - Native Hawaiian and Other Pacific Islander alone (%)
Races - Native Hawaiian and Other Pacific Islander alone (% change since 2000)
Races - Two or more races(%)
Races - Two or more races(% change since 2000)
Races - Other race alone (%)
Races - Other race alone (% change since 2000)
Racial diversity
Place of birth - Born in state of residence (%)
Place of birth - Born in state of residence (%) - White
Place of birth - Born in state of residence (%) - Black or African American
Place of birth - Born in state of residence (%) - Asian
Place of birth - Born in state of residence (%) - Hispanic or Latino
Place of birth - Born in state of residence (%) - American Indian and Alaska Native
Place of birth - Born in state of residence (%) - Multirace
Place of birth - Born in state of residence (%) - Other Race
Place of birth - Born in other state (%)
Place of birth - Born in other state (%) - White
Place of birth - Born in other state (%) - Black or African American
Place of birth - Born in other state (%) - Asian
Place of birth - Born in other state (%) - Hispanic or Latino
Place of birth - Born in other state (%) - American Indian and Alaska Native
Place of birth - Born in other state (%) - Multirace
Place of birth - Born in other state (%) - Other Race
Place of birth - Native, outside of US (%)
Place of birth - Native, outside of US (%) - White
Place of birth - Native, outside of US (%) - Black or African American
Place of birth - Native, outside of US (%) - Asian
Place of birth - Native, outside of US (%) - Hispanic or Latino
Place of birth - Native, outside of US (%) - American Indian and Alaska Native
Place of birth - Native, outside of US (%) - Multirace
Place of birth - Native, outside of US (%) - Other Race
Place of birth - Foreign born (%)
Place of birth - Foreign born (%) - White
Place of birth - Foreign born (%) - Black or African American
Place of birth - Foreign born (%) - Asian
Place of birth - Foreign born (%) - Hispanic or Latino
Place of birth - Foreign born (%) - American Indian and Alaska Native
Place of birth - Foreign born (%) - Multirace
Place of birth - Foreign born (%) - Other Race
Residents speaking English at home (%)
Residents speaking English at home - Born in the United States (%)
Residents speaking English at home - Native, born elsewhere (%)
Residents speaking English at home - Foreign born (%)
Residents speaking Spanish at home (%)
Residents speaking Spanish at home - Born in the United States (%)
Residents speaking Spanish at home - Native, born elsewhere (%)
Residents speaking Spanish at home - Foreign born (%)
Residents speaking other language at home (%)
Residents speaking other language at home - Born in the United States (%)
Residents speaking other language at home - Native, born elsewhere (%)
Residents speaking other language at home - Foreign born (%)
Marital status - Never married (%)
Marital status - Now married (%)
Marital status - Separated (%)
Marital status - Widowed (%)
Marital status - Divorced (%)
Ancestries Reported - Arab (%)
Ancestries Reported - Czech (%)
Ancestries Reported - Danish (%)
Ancestries Reported - Dutch (%)
Ancestries Reported - English (%)
Ancestries Reported - French (%)
Ancestries Reported - French Canadian (%)
Ancestries Reported - German (%)
Ancestries Reported - Greek (%)
Ancestries Reported - Hungarian (%)
Ancestries Reported - Irish (%)
Ancestries Reported - Italian (%)
Ancestries Reported - Lithuanian (%)
Ancestries Reported - Norwegian (%)
Ancestries Reported - Polish (%)
Ancestries Reported - Portuguese (%)
Ancestries Reported - Russian (%)
Ancestries Reported - Scotch-Irish (%)
Ancestries Reported - Scottish (%)
Ancestries Reported - Slovak (%)
Ancestries Reported - Subsaharan African (%)
Ancestries Reported - Swedish (%)
Ancestries Reported - Swiss (%)
Ancestries Reported - Ukrainian (%)
Ancestries Reported - United States (%)
Ancestries Reported - Welsh (%)
Ancestries Reported - West Indian (%)
Ancestries Reported - Other (%)
Geographical mobility - Same house 1 year ago (%)
Geographical mobility - Same house 1 year ago (%) - White
Geographical mobility - Same house 1 year ago (%) - Black or African American
Geographical mobility - Same house 1 year ago (%) - Asian
Geographical mobility - Same house 1 year ago (%) - Hispanic or Latino
Geographical mobility - Same house 1 year ago (%) - American Indian and Alaska Native
Geographical mobility - Same house 1 year ago (%) - Multirace
Geographical mobility - Same house 1 year ago (%) - Other Race
Geographical mobility - Moved within same county (%)
Geographical mobility - Moved within same county (%) - White
Geographical mobility - Moved within same county (%) - Black or African American
Geographical mobility - Moved within same county (%) - Asian
Geographical mobility - Moved within same county (%) - Hispanic or Latino
Geographical mobility - Moved within same county (%) - American Indian and Alaska Native
Geographical mobility - Moved within same county (%) - Multirace
Geographical mobility - Moved within same county (%) - Other Race
Geographical mobility - Moved from different county within same state (%)
Geographical mobility - Moved from different county within same state (%) - White
Geographical mobility - Moved from different county within same state (%) - Black or African American
Geographical mobility - Moved from different county within same state (%) - Asian
Geographical mobility - Moved from different county within same state (%) - Hispanic or Latino
Geographical mobility - Moved from different county within same state (%) - American Indian and Alaska Native
Geographical mobility - Moved from different county within same state (%) - Multirace
Geographical mobility - Moved from different county within same state (%) - Other Race
Geographical mobility - Moved from different state (%)
Geographical mobility - Moved from different state (%) - White
Geographical mobility - Moved from different state (%) - Black or African American
Geographical mobility - Moved from different state (%) - Asian
Geographical mobility - Moved from different state (%) - Hispanic or Latino
Geographical mobility - Moved from different state (%) - American Indian and Alaska Native
Geographical mobility - Moved from different state (%) - Multirace
Geographical mobility - Moved from different state (%) - Other Race
Geographical mobility - Moved from abroad (%)
Geographical mobility - Moved from abroad (%) - White
Geographical mobility - Moved from abroad (%) - Black or African American
Geographical mobility - Moved from abroad (%) - Asian
Geographical mobility - Moved from abroad (%) - Hispanic or Latino
Geographical mobility - Moved from abroad (%) - American Indian and Alaska Native
Geographical mobility - Moved from abroad (%) - Multirace
Geographical mobility - Moved from abroad (%) - Other Race
Place of birth for the foreign-born population - Ireland (%)
Place of birth for the foreign-born population - Denmark (%)
Place of birth for the foreign-born population - Norway (%)
Place of birth for the foreign-born population - Sweden (%)
Place of birth for the foreign-born population - United Kingdom (%)
Place of birth for the foreign-born population - England (%)
Place of birth for the foreign-born population - Scotland (%)
Place of birth for the foreign-born population - Other Northern Europe (%)
Place of birth for the foreign-born population - Austria (%)
Place of birth for the foreign-born population - Belgium (%)
Place of birth for the foreign-born population - France (%)
Place of birth for the foreign-born population - Germany (%)
Place of birth for the foreign-born population - Netherlands (%)
Place of birth for the foreign-born population - Switzerland (%)
Place of birth for the foreign-born population - Other Western Europe (%)
Place of birth for the foreign-born population - Greece (%)
Place of birth for the foreign-born population - Italy (%)
Place of birth for the foreign-born population - Portugal (%)
Place of birth for the foreign-born population - Spain (%)
Place of birth for the foreign-born population - Other Southern Europe (%)
Place of birth for the foreign-born population - Albania (%)
Place of birth for the foreign-born population - Belarus (%)
Place of birth for the foreign-born population - Bosnia and Herzegovina (%)
Place of birth for the foreign-born population - Bulgaria (%)
Place of birth for the foreign-born population - Croatia (%)
Place of birth for the foreign-born population - Czechoslovakia (%)
Place of birth for the foreign-born population - Hungary (%)
Place of birth for the foreign-born population - Latvia (%)
Place of birth for the foreign-born population - Lithuania (%)
Place of birth for the foreign-born population - North Macedonia (Macedonia) (%)
Place of birth for the foreign-born population - Moldova (%)
Place of birth for the foreign-born population - Poland (%)
Place of birth for the foreign-born population - Romania (%)
Place of birth for the foreign-born population - Russia (%)
Place of birth for the foreign-born population - Serbia (%)
Place of birth for the foreign-born population - Ukraine (%)
Place of birth for the foreign-born population - Other Eastern Europe (%)
Place of birth for the foreign-born population - China (%)
Place of birth for the foreign-born population - Hong Kong (%)
Place of birth for the foreign-born population - Taiwan (%)
Place of birth for the foreign-born population - Japan (%)
Place of birth for the foreign-born population - Korea (%)
Place of birth for the foreign-born population - Other Eastern Asia (%)
Place of birth for the foreign-born population - Afghanistan (%)
Place of birth for the foreign-born population - Bangladesh (%)
Place of birth for the foreign-born population - India (%)
Place of birth for the foreign-born population - Iran (%)
Place of birth for the foreign-born population - Kazakhstan (%)
Place of birth for the foreign-born population - Nepal (%)
Place of birth for the foreign-born population - Pakistan (%)
Place of birth for the foreign-born population - Sri Lanka (%)
Place of birth for the foreign-born population - Uzbekistan (%)
Place of birth for the foreign-born population - Other South Central Asia (%)
Place of birth for the foreign-born population - Burma (%)
Place of birth for the foreign-born population - Cambodia (%)
Place of birth for the foreign-born population - Indonesia (%)
Place of birth for the foreign-born population - Laos (%)
Place of birth for the foreign-born population - Malaysia (%)
Place of birth for the foreign-born population - Philippines (%)
Place of birth for the foreign-born population - Singapore (%)
Place of birth for the foreign-born population - Thailand (%)
Place of birth for the foreign-born population - Vietnam (%)
Place of birth for the foreign-born population - Other South Eastern Asia (%)
Place of birth for the foreign-born population - Armenia (%)
Place of birth for the foreign-born population - Iraq (%)
Place of birth for the foreign-born population - Israel (%)
Place of birth for the foreign-born population - Jordan (%)
Place of birth for the foreign-born population - Kuwait (%)
Place of birth for the foreign-born population - Lebanon (%)
Place of birth for the foreign-born population - Saudi Arabia (%)
Place of birth for the foreign-born population - Syria (%)
Place of birth for the foreign-born population - Turkey (%)
Place of birth for the foreign-born population - Yemen (%)
Place of birth for the foreign-born population - Other Western Asia (%)
Place of birth for the foreign-born population - Eritrea (%)
Place of birth for the foreign-born population - Ethiopia (%)
Place of birth for the foreign-born population - Kenya (%)
Place of birth for the foreign-born population - Somalia (%)
Place of birth for the foreign-born population - Uganda (%)
Place of birth for the foreign-born population - Zimbabwe (%)
Place of birth for the foreign-born population - Other Eastern Africa (%)
Place of birth for the foreign-born population - Cameroon (%)
Place of birth for the foreign-born population - Congo (%)
Place of birth for the foreign-born population - Democratic Republic of Congo (Zaire) (%)
Place of birth for the foreign-born population - Other Middle Africa (%)
Place of birth for the foreign-born population - Egypt (%)
Place of birth for the foreign-born population - Morocco (%)
Place of birth for the foreign-born population - Sudan (%)
Place of birth for the foreign-born population - Other Northern Africa (%)
Place of birth for the foreign-born population - South Africa (%)
Place of birth for the foreign-born population - Other Southern Africa (%)
Place of birth for the foreign-born population - Cabo Verde (%)
Place of birth for the foreign-born population - Ghana (%)
Place of birth for the foreign-born population - Liberia (%)
Place of birth for the foreign-born population - Nigeria (%)
Place of birth for the foreign-born population - Senegal (%)
Place of birth for the foreign-born population - Sierra Leone (%)
Place of birth for the foreign-born population - Other Western Africa (%)
Place of birth for the foreign-born population - Australia (%)
Place of birth for the foreign-born population - New Zealand (%)
Place of birth for the foreign-born population - Fiji (%)
Place of birth for the foreign-born population - Micronesia (%)
Place of birth for the foreign-born population - Bahamas (%)
Place of birth for the foreign-born population - Barbados (%)
Place of birth for the foreign-born population - Cuba (%)
Place of birth for the foreign-born population - Dominica (%)
Place of birth for the foreign-born population - Dominican Republic (%)
Place of birth for the foreign-born population - Grenada (%)
Place of birth for the foreign-born population - Haiti (%)
Place of birth for the foreign-born population - Jamaica (%)
Place of birth for the foreign-born population - St. Vincent and the Grenadines (%)
Place of birth for the foreign-born population - Trinidad and Tobago (%)
Place of birth for the foreign-born population - West Indies (%)
Place of birth for the foreign-born population - Other Caribbean (%)
Place of birth for the foreign-born population - Belize (%)
Place of birth for the foreign-born population - Costa Rica (%)
Place of birth for the foreign-born population - El Salvador (%)
Place of birth for the foreign-born population - Guatemala (%)
Place of birth for the foreign-born population - Honduras (%)
Place of birth for the foreign-born population - Mexico (%)
Place of birth for the foreign-born population - Nicaragua (%)
Place of birth for the foreign-born population - Panama (%)
Place of birth for the foreign-born population - Other Central America (%)
Place of birth for the foreign-born population - Argentina (%)
Place of birth for the foreign-born population - Bolivia (%)
Place of birth for the foreign-born population - Brazil (%)
Place of birth for the foreign-born population - Chile (%)
Place of birth for the foreign-born population - Colombia (%)
Place of birth for the foreign-born population - Ecuador (%)
Place of birth for the foreign-born population - Guyana (%)
Place of birth for the foreign-born population - Peru (%)
Place of birth for the foreign-born population - Uruguay (%)
Place of birth for the foreign-born population - Venezuela (%)
Place of birth for the foreign-born population - Other South America (%)
Place of birth for the foreign-born population - Canada (%)
Place of birth for the foreign-born population - Other Northern America (%)
Place of birth for the foreign-born population - Other (%)
Latest news about races in Tracy, CA collected exclusively by city-data.com from local newspapers, TV, and radio stations
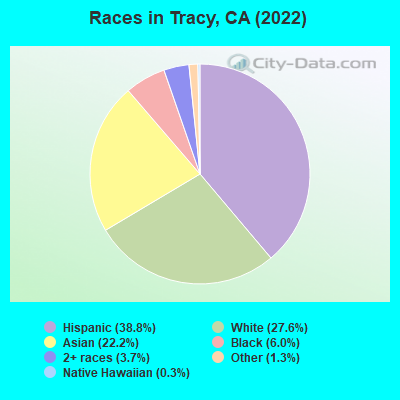
According to 2022 data, the most numerous races in Tracy, CA are Hispanic (42,728 residents), White alone (28,429 residents), and Asian alone (12,747 residents). 57.1% of Tracy residents speak English at home. 26.5% of Tracy, CA residents are foreign-born (13.0% born in Asia, 11.2% born in Latin America), which is about the same as the foreign-born rate of 26.0% across the entire state of California.
Race distribution in Tracy
2000 2022
30,723 54.0% White alone 15,765 27.7% Hispanic 4,481 7.9% Asian alone 2,976 5.2% Black alone 2,230 3.9% Two or more races 275 0.5% Native Hawaiian and Other 297 0.5% American Indian alone 182 0.3% Other race alone
42,728 45.0% Hispanic 28,429 29.9% White alone 12,747 13.4% Asian alone 6,890 7.3% Two or more races 4,107 4.3% Black alone 894 0.9% Native Hawaiian and Other
2000 2022
15,816,790 46.7% White alone 10,966,556 32.4% Hispanic 3,648,860 10.8% Asian alone 2,181,926 6.4% Black alone 903,115 2.7% Two or more races 178,984 0.5% American Indian alone 103,736 0.3% Native Hawaiian and Other 71,681 0.2% Other race alone
15,732,184 40.3% Hispanic 13,160,426 33.7% White alone 5,957,867 15.3% Asian alone 2,025,218 5.2% Black alone 1,663,222 4.3% Two or more races 251,618 0.6% Other race alone 135,777 0.3% Native Hawaiian and Other 103,030 0.3% American Indian alone
Income and house value in Tracy Median household income in 2022 $106,206 White non-Hispanic householders$143,499 Black householders$104,697 American Indian and Alaska Native householders$152,775 Asian householders$115,382 Native Hawaiian and other Pacific Islander householders$92,158 Some other race householders$106,604 Two or more races householders$114,564 Hispanic or Latino race householdersMedian 2022 house value $773,488 White Non-Hispanic householders$818,120 Black or African American householders$679,547 American Indian or Alaska Native householders $851,593 Asian householders$799,403 Native Hawaiian and other Pacific Islander householders$666,589 Some other race householders$770,609 Two or more races householders$680,626 Hispanic or Latino householders
Median age by race in Tracy
35.2 Median age for White residents35.4 35.0 40.7 Median age for Black or African American residents31.4 48.3 48.0 Median age for American Indian / Alaska Native residents43.8 67.4 43.6 Median age for Asian residents43.1 44.3 50.6 Median age for Native Hawaiian / Pacific Islander residents53.7 38.5 31.2 Median age for Other race residents26.4 32.4 33.2 Median age for Two or more races residents30.8 36.3 40.7 Median age for White alone residents40.2 41.4 28.4 Median age for Hispanic or Latino residents25.4 30.4
Owner/renter occupied households by race in Tracy
House owners and renters - White residents 9,371 62.2% Owner occupied5,695 37.8% Renter occupiedHouse owners and renters - Black or African American residents 794 54.7% Owner occupied657 45.3% Renter occupiedHouse owners and renters - American Indian / Alaska Native residents 173 82.9% Owner occupied36 17.1% Renter occupiedHouse owners and renters - Asian residents 3,303 86.4% Owner occupied520 13.6% Renter occupiedHouse owners and renters - Native Hawaiian / Pacific Islander residents 167 43.9% Owner occupied214 56.1% Renter occupiedHouse owners and renters - Other race residents 1,516 55.2% Owner occupied1,230 44.8% Renter occupiedHouse owners and renters - Two or more races residents 3,009 54.1% Owner occupied2,552 45.9% Renter occupiedHouse owners and renters - White alone residents 6,397 65.7% Owner occupied3,336 34.3% Renter occupiedHouse owners and renters - Hispanic or Latino residents 5,968 54.7% Owner occupied4,941 45.3% Renter occupied
Language usage in Tracy
English speakers - Total 57.1% of residents of Tracy speak English at home.
23.0% of residents speak Spanish at home 12,808 64.8% Speak English very well6,943 35.2% Speak English less than very well20.1% of residents speak other language at home 10,959 63.6% Speak English very well6,283 36.4% Speak English less than very well
English speakers - Born in the United States 88.3% of residents of Tracy speak English at home.
7.7% of residents speak Spanish at home 532 71.0% Speak English very well217 29.0% Speak English less than very well3.9% of residents speak other language at home 351 91.9% Speak English very well31 8.1% Speak English less than very well
English speakers - Native, born elsewhere 49.2% of residents of Tracy speak English at home.
27.5% of residents speak Spanish at home 409 95.1% Speak English very well21 4.9% Speak English less than very well23.1% of residents speak other language at home 232 64.1% Speak English very well130 35.9% Speak English less than very well
English speakers - Foreign-born 7.9% of residents of Tracy speak English at home.
38.7% of residents speak Spanish at home 3,409 36.8% Speak English very well5,861 63.2% Speak English less than very well53.7% of residents speak other language at home 7,115 55.3% Speak English very well5,754 44.7% Speak English less than very well
White (Caucasian) - Speak only English Native:
77.4% (29,720)Foreign-born:
8.4% (530)
White (Caucasian) - Speak another language Native:
20.4% (7,851)Foreign-born:
88.6% (5,585)
Black or African American - Speak only English Native:
93.1% (3,409)Foreign-born:
26.3% (61)
Black or African American - Speak another language Native:
5.9% (216)Foreign-born:
68.7% (159)
American Indian / Alaska Native - Speak another language Native:
28.9% (93)Foreign-born:
100.0% (177)
Asian - Speak only English Native:
52.5% (2,465)Foreign-born:
9.3% (739)
Asian - Speak another language Native:
47.1% (2,211)Foreign-born:
90.5% (7,199)
Native Hawaiian / Pacific Islander - Speak only English Native:
51.7% (334)Foreign-born:
24.9% (163)
Native Hawaiian / Pacific Islander - Speak another language Native:
48.5% (313)Foreign-born:
75.7% (498)
Other race - Speak only English Native:
51.7% (3,669)Foreign-born:
8.0% (300)
Other race - Speak another language Native:
51.0% (3,615)Foreign-born:
92.8% (3,492)
Two or more races - Speak only English Native:
67.0% (12,527)Foreign-born:
2.0% (130)
Two or more races - Speak another language Native:
25.0% (4,680)Foreign-born:
100.0% (6,633)
White alone - Speak only English Native:
96.5% (24,326)Foreign-born:
18.4% (325)
White alone - Speak another language Native:
3.5% (874)Foreign-born:
81.8% (1,440)
Hispanic or Latino - Speak only English Native:
46.8% (13,212)Foreign-born:
4.9% (583)
Hispanic or Latino - Speak another language Native:
53.6% (15,139)Foreign-born:
94.9% (11,194)
Foreign-born residents in Tracy 24,698 residents are foreign born (13.0% Asia , 11.2% Latin America ).
This city:
26.5%California:
100.0%
Marital status for residents in Tracy Marital status - White (Caucasian) population 15 years and over
Males 37.1% Never married51.5% Now married2.1% Separated1.9% Widowed7.5% DivorcedFemales 39.5% Never married43.2% Now married3.2% Separated5.6% Widowed8.5% DivorcedWomen who gave birth in the past 12 months Now married:
63.7% (540)Unmarried:
36.3% (308)
Women who did not give birth in the past 12 months Now married:
40.0% (5,027)Unmarried:
60.0% (7,532)
Marital status - Black or African American population 15 years and over
Males 63.2% Never married27.8% Now married2.3% Separated0.0% Widowed6.6% DivorcedFemales 35.2% Never married30.2% Now married0.0% Separated16.2% Widowed18.3% DivorcedWomen who did not give birth in the past 12 months Now married:
46.0% (518)Unmarried:
54.0% (607)
Marital status - American Indian / Alaska Native population 15 years and over
Males 6.5% Never married91.2% Now married0.0% Separated0.0% Widowed2.4% DivorcedFemales 26.3% Never married58.8% Now married4.4% Separated3.8% Widowed6.9% DivorcedWomen who did not give birth in the past 12 months Now married:
43.1% (32)Unmarried:
56.9% (42)
Marital status - Asian population 15 years and over
Males 38.5% Never married58.9% Now married0.0% Separated1.1% Widowed1.5% DivorcedFemales 35.0% Never married51.4% Now married0.8% Separated9.8% Widowed3.0% DivorcedWomen who gave birth in the past 12 months Now married:
88.2% (138)Unmarried:
11.8% (18)
Women who did not give birth in the past 12 months Now married:
53.9% (2,134)Unmarried:
46.1% (1,824)
Marital status - Native Hawaiian / Pacific Islander population 15 years and over
Males 34.4% Never married61.5% Now married0.0% Separated0.0% Widowed4.1% DivorcedFemales 26.3% Never married69.7% Now married0.0% Separated4.1% Widowed0.0% DivorcedWomen who gave birth in the past 12 months Now married:
100.0% (17)Unmarried:
0.0% (0)
Women who did not give birth in the past 12 months Now married:
66.3% (159)Unmarried:
33.7% (81)
Marital status - Other race population 15 years and over
Males 38.7% Never married49.1% Now married3.5% Separated1.5% Widowed7.1% DivorcedFemales 31.3% Never married51.9% Now married1.9% Separated2.8% Widowed12.1% DivorcedWomen who gave birth in the past 12 months Now married:
100.0% (298)Unmarried:
0.0% (0)
Women who did not give birth in the past 12 months Now married:
50.1% (1,413)Unmarried:
49.9% (1,408)
Marital status - Two or more races population 15 years and over
Males 53.5% Never married38.6% Now married0.2% Separated0.9% Widowed6.8% DivorcedFemales 46.2% Never married41.8% Now married0.8% Separated0.7% Widowed10.5% DivorcedWomen who gave birth in the past 12 months Now married:
53.9% (368)Unmarried:
46.1% (314)
Women who did not give birth in the past 12 months Now married:
33.8% (2,449)Unmarried:
66.2% (4,791)
Marital status - White alone, not Hispanic / Latino population 15 years and over
Males 33.7% Never married50.8% Now married2.9% Separated2.6% Widowed10.1% DivorcedFemales 35.2% Never married44.5% Now married2.8% Separated7.2% Widowed10.3% DivorcedWomen who gave birth in the past 12 months Now married:
100.0% (441)Unmarried:
0.0% (0)
Women who did not give birth in the past 12 months Now married:
38.6% (2,844)Unmarried:
61.4% (4,520)
Marital status - Hispanic or Latino population 15 years and over
Males 41.5% Never married51.9% Now married2.4% Separated0.7% Widowed3.6% DivorcedFemales 37.2% Never married45.5% Now married2.9% Separated3.3% Widowed11.1% DivorcedWomen who gave birth in the past 12 months Now married:
62.6% (667)Unmarried:
37.4% (399)
Women who did not give birth in the past 12 months Now married:
43.4% (4,817)Unmarried:
56.6% (6,275)
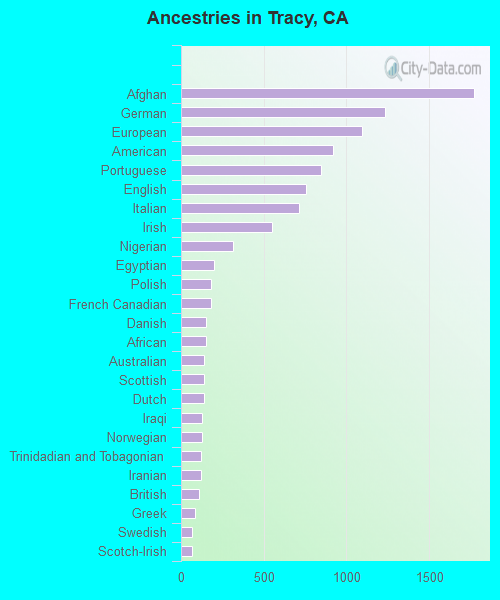
Ancestries in Tracy
3,927 7.8% Afghan1,135 2.3% American1,114 2.2% English1,075 2.1% Portuguese1,052 2.1% German934 1.9% European649 1.3% Italian635 1.3% Irish344 0.7% Jordanian293 0.6% Scottish257 0.5% Palestinian149 0.3% Egyptian135 0.3% Iranian119 0.2% Russian117 0.2% Norwegian114 0.2% French105 0.2% Greek102 0.2% African99 0.2% Polish98 0.2% Scotch-Irish94 0.2% Armenian72 0.1% Eastern European67 0.1% British63 0.1% Brazilian62 0.1% Swedish55 0.1% Danish55 0.1% Sierra Leonean45 0.09% Croatian44 0.09% Romanian44 0.09% Yugoslavian43 0.09% French Canadian43 0.09% Swiss42 0.08% Northern European37 0.07% Dutch28 0.06% Canadian25 0.05% Lebanese24 0.05% Turkish17 0.03% Ukrainian16 0.03% Hungarian16 0.03% Finnish13 0.03% Nigerian11 0.02% Maltese10 0.02% Austrian10 0.02% Basque10 0.02% Scandinavian8 0.02% Lithuanian7 0.01% Welsh6 0.01% Slovak
Geographical mobility in Tracy Same house 1 year ago 40,978 88.5% White (Caucasian)3,589 90.0% Black or African American469 95.7% American Indian / Alaska Native13,717 86.4% Asian1,025 92.5% Native Hawaiian / Pacific Islander8,784 87.0% Other race21,532 93.4% Two or more races24,379 86.4% White alone, not Hispanic / Latino32,230 89.4% Hispanic or LatinoMoved within same county 3,761 8.1% White / Caucasian250 6.3% Black or African American11 2.2% American Indian / Alaska Native819 5.2% Asian19 1.8% Native Hawaiian / Pacific Islander833 8.3% Other race1,040 4.5% Two or more races2,045 7.2% White alone, not Hispanic / Latino2,288 6.3% Hispanic or LatinoMoved within same state 1,359 2.9% White / Caucasian121 3.0% Black or African American21 4.3% American Indian / Alaska Native813 5.1% Asian65 5.9% Native Hawaiian / Pacific Islander392 3.9% Other race766 3.3% Two or more races1,183 4.2% White alone, not Hispanic / Latino1,287 3.6% Hispanic or LatinoMoved from different state 52 1.3% Black or African American224 1.4% Asian12 0.1% Two or more races571 2.0% White alone, not Hispanic / Latino175 0.5% Hispanic or LatinoMoved from abroad 153 0.3% White302 1.9% Asian82 0.4% Two or more races47 0.2% White alone, not Hispanic / Latino62 0.2% Hispanic or Latino
Children Nativity (place of birth) in Tracy
Children under 6 years - Living with two parents Both parents native 1,762 100.0% NativeBoth parents foreign-born 1,911 100.0% NativeOne native, one foreign-born parent 391 100.0% NativeChildren under 6 years - Living with one parent Native parent 1,003 100.0% NativeForeign-born parent 146 100.0% NativeChildren 6 to 17 years - Living with two parents Both parents native 5,170 100.0% NativeBoth parents foreign-born 4,197 91.2% Native405 8.8% Foreign-bornOne native, one foreign-born parent 2,521 100.0% NativeChildren 6 to 17 years - Living with one parent Native parent 2,764 100.0% NativeForeign-born parent 547 56.5% Native420 43.5% Foreign-born
Place of birth for residents in Tracy 11,962 Asia10,552 Americas10,314 Latin America9,529 Central America5,872 South Central Asia4,605 South Eastern Asia1,148 Eastern Asia1,140 Europe900 China639 South America588 Africa454 Oceania368 Eastern Europe336 Southern Europe336 Western Asia282 Northern Europe261 Northern Africa238 Northern America187 Eastern Africa152 Western Europe145 Caribbean139 Western Africa14 Australia and New Zealand Subregion8,561 Mexico3,283 India3,089 Philippines2,159 Afghanistan749 China625 Vietnam396 Fiji333 El Salvador329 Nicaragua303 Pakistan283 Portugal268 Laos268 Cambodia248 England238 Canada233 Peru224 Guatemala222 Romania210 Indonesia201 Colombia188 Jordan187 Korea184 Egypt145 Cuba133 Azores Islands126 Thailand125 Iran120 Hong Kong113 Brazil105 Armenia95 Russia77 Germany69 Sierra Leone69 Nigeria67 Sudan64 Argentina61 Honduras60 Japan35 Netherlands31 Bosnia and Herzegovina30 Taiwan27 Italy25 Spain18 United Kingdom16 Burma16 Sweden15 Austria15 France14 New Zealand14 Ecuador11 Lithuania11 Costa Rica11 Bolivia9 Morocco9 Kuwait9 Belgium8 Hungary7 Lebanon
Grandparents responsible for own grandchildren in Tracy
Grandparents (30 to 59 years) White / Caucasian 90 31.0% Responsible for grandchildren199 69.0% Not responsible for grandchildrenBlack or African American 12 100.0% Not responsible for grandchildrenAmerican Indian / Alaska Native 19 44.8% Responsible for grandchildren23 55.2% Not responsible for grandchildrenAsian 31 41.4% Responsible for grandchildren43 58.6% Not responsible for grandchildrenNative Hawaiian / Pacific Islander 9 100.0% Not responsible for grandchildrenOther race 136 100.0% Not responsible for grandchildrenTwo or more races 187 46.5% Responsible for grandchildren216 53.5% Not responsible for grandchildrenWhite alone, not Hispanic / Latino 22 35.0% Responsible for grandchildren40 65.0% Not responsible for grandchildrenHispanic or Latino 128 23.2% Responsible for grandchildren423 76.8% Not responsible for grandchildrenGrandparents (60 years and over) White / Caucasian 162 28.9% Responsible for grandchildren398 71.1% Not responsible for grandchildrenBlack or African American 23 13.1% Responsible for grandchildren153 86.9% Not responsible for grandchildrenAmerican Indian / Alaska Native 28 100.0% Not responsible for grandchildrenAsian 16 2.3% Responsible for grandchildren654 97.7% Not responsible for grandchildrenOther race 234 100.0% Not responsible for grandchildrenTwo or more races 141 27.0% Responsible for grandchildren382 73.0% Not responsible for grandchildrenWhite alone, not Hispanic / Latino 138 35.1% Responsible for grandchildren256 64.9% Not responsible for grandchildrenHispanic or Latino 60 9.8% Responsible for grandchildren553 90.2% Not responsible for grandchildren