Races in Union City, New Jersey (NJ) Detailed Stats
Data:
Races - White alone (%)
Races - White alone (% change since 2000)
Races - Black alone (%)
Races - Black alone (% change since 2000)
Races - American Indian alone (%)
Races - American Indian alone (% change since 2000)
Races - Asian alone (%)
Races - Asian alone (% change since 2000)
Races - Hispanic (%)
Races - Hispanic (% change since 2000)
Races - Native Hawaiian and Other Pacific Islander alone (%)
Races - Native Hawaiian and Other Pacific Islander alone (% change since 2000)
Races - Two or more races(%)
Races - Two or more races(% change since 2000)
Races - Other race alone (%)
Races - Other race alone (% change since 2000)
Racial diversity
Place of birth - Born in state of residence (%)
Place of birth - Born in state of residence (%) - White
Place of birth - Born in state of residence (%) - Black or African American
Place of birth - Born in state of residence (%) - Asian
Place of birth - Born in state of residence (%) - Hispanic or Latino
Place of birth - Born in state of residence (%) - American Indian and Alaska Native
Place of birth - Born in state of residence (%) - Multirace
Place of birth - Born in state of residence (%) - Other Race
Place of birth - Born in other state (%)
Place of birth - Born in other state (%) - White
Place of birth - Born in other state (%) - Black or African American
Place of birth - Born in other state (%) - Asian
Place of birth - Born in other state (%) - Hispanic or Latino
Place of birth - Born in other state (%) - American Indian and Alaska Native
Place of birth - Born in other state (%) - Multirace
Place of birth - Born in other state (%) - Other Race
Place of birth - Native, outside of US (%)
Place of birth - Native, outside of US (%) - White
Place of birth - Native, outside of US (%) - Black or African American
Place of birth - Native, outside of US (%) - Asian
Place of birth - Native, outside of US (%) - Hispanic or Latino
Place of birth - Native, outside of US (%) - American Indian and Alaska Native
Place of birth - Native, outside of US (%) - Multirace
Place of birth - Native, outside of US (%) - Other Race
Place of birth - Foreign born (%)
Place of birth - Foreign born (%) - White
Place of birth - Foreign born (%) - Black or African American
Place of birth - Foreign born (%) - Asian
Place of birth - Foreign born (%) - Hispanic or Latino
Place of birth - Foreign born (%) - American Indian and Alaska Native
Place of birth - Foreign born (%) - Multirace
Place of birth - Foreign born (%) - Other Race
Residents speaking English at home (%)
Residents speaking English at home - Born in the United States (%)
Residents speaking English at home - Native, born elsewhere (%)
Residents speaking English at home - Foreign born (%)
Residents speaking Spanish at home (%)
Residents speaking Spanish at home - Born in the United States (%)
Residents speaking Spanish at home - Native, born elsewhere (%)
Residents speaking Spanish at home - Foreign born (%)
Residents speaking other language at home (%)
Residents speaking other language at home - Born in the United States (%)
Residents speaking other language at home - Native, born elsewhere (%)
Residents speaking other language at home - Foreign born (%)
Marital status - Never married (%)
Marital status - Now married (%)
Marital status - Separated (%)
Marital status - Widowed (%)
Marital status - Divorced (%)
Ancestries Reported - Arab (%)
Ancestries Reported - Czech (%)
Ancestries Reported - Danish (%)
Ancestries Reported - Dutch (%)
Ancestries Reported - English (%)
Ancestries Reported - French (%)
Ancestries Reported - French Canadian (%)
Ancestries Reported - German (%)
Ancestries Reported - Greek (%)
Ancestries Reported - Hungarian (%)
Ancestries Reported - Irish (%)
Ancestries Reported - Italian (%)
Ancestries Reported - Lithuanian (%)
Ancestries Reported - Norwegian (%)
Ancestries Reported - Polish (%)
Ancestries Reported - Portuguese (%)
Ancestries Reported - Russian (%)
Ancestries Reported - Scotch-Irish (%)
Ancestries Reported - Scottish (%)
Ancestries Reported - Slovak (%)
Ancestries Reported - Subsaharan African (%)
Ancestries Reported - Swedish (%)
Ancestries Reported - Swiss (%)
Ancestries Reported - Ukrainian (%)
Ancestries Reported - United States (%)
Ancestries Reported - Welsh (%)
Ancestries Reported - West Indian (%)
Ancestries Reported - Other (%)
Geographical mobility - Same house 1 year ago (%)
Geographical mobility - Same house 1 year ago (%) - White
Geographical mobility - Same house 1 year ago (%) - Black or African American
Geographical mobility - Same house 1 year ago (%) - Asian
Geographical mobility - Same house 1 year ago (%) - Hispanic or Latino
Geographical mobility - Same house 1 year ago (%) - American Indian and Alaska Native
Geographical mobility - Same house 1 year ago (%) - Multirace
Geographical mobility - Same house 1 year ago (%) - Other Race
Geographical mobility - Moved within same county (%)
Geographical mobility - Moved within same county (%) - White
Geographical mobility - Moved within same county (%) - Black or African American
Geographical mobility - Moved within same county (%) - Asian
Geographical mobility - Moved within same county (%) - Hispanic or Latino
Geographical mobility - Moved within same county (%) - American Indian and Alaska Native
Geographical mobility - Moved within same county (%) - Multirace
Geographical mobility - Moved within same county (%) - Other Race
Geographical mobility - Moved from different county within same state (%)
Geographical mobility - Moved from different county within same state (%) - White
Geographical mobility - Moved from different county within same state (%) - Black or African American
Geographical mobility - Moved from different county within same state (%) - Asian
Geographical mobility - Moved from different county within same state (%) - Hispanic or Latino
Geographical mobility - Moved from different county within same state (%) - American Indian and Alaska Native
Geographical mobility - Moved from different county within same state (%) - Multirace
Geographical mobility - Moved from different county within same state (%) - Other Race
Geographical mobility - Moved from different state (%)
Geographical mobility - Moved from different state (%) - White
Geographical mobility - Moved from different state (%) - Black or African American
Geographical mobility - Moved from different state (%) - Asian
Geographical mobility - Moved from different state (%) - Hispanic or Latino
Geographical mobility - Moved from different state (%) - American Indian and Alaska Native
Geographical mobility - Moved from different state (%) - Multirace
Geographical mobility - Moved from different state (%) - Other Race
Geographical mobility - Moved from abroad (%)
Geographical mobility - Moved from abroad (%) - White
Geographical mobility - Moved from abroad (%) - Black or African American
Geographical mobility - Moved from abroad (%) - Asian
Geographical mobility - Moved from abroad (%) - Hispanic or Latino
Geographical mobility - Moved from abroad (%) - American Indian and Alaska Native
Geographical mobility - Moved from abroad (%) - Multirace
Geographical mobility - Moved from abroad (%) - Other Race
Place of birth for the foreign-born population - Ireland (%)
Place of birth for the foreign-born population - Denmark (%)
Place of birth for the foreign-born population - Norway (%)
Place of birth for the foreign-born population - Sweden (%)
Place of birth for the foreign-born population - United Kingdom (%)
Place of birth for the foreign-born population - England (%)
Place of birth for the foreign-born population - Scotland (%)
Place of birth for the foreign-born population - Other Northern Europe (%)
Place of birth for the foreign-born population - Austria (%)
Place of birth for the foreign-born population - Belgium (%)
Place of birth for the foreign-born population - France (%)
Place of birth for the foreign-born population - Germany (%)
Place of birth for the foreign-born population - Netherlands (%)
Place of birth for the foreign-born population - Switzerland (%)
Place of birth for the foreign-born population - Other Western Europe (%)
Place of birth for the foreign-born population - Greece (%)
Place of birth for the foreign-born population - Italy (%)
Place of birth for the foreign-born population - Portugal (%)
Place of birth for the foreign-born population - Spain (%)
Place of birth for the foreign-born population - Other Southern Europe (%)
Place of birth for the foreign-born population - Albania (%)
Place of birth for the foreign-born population - Belarus (%)
Place of birth for the foreign-born population - Bosnia and Herzegovina (%)
Place of birth for the foreign-born population - Bulgaria (%)
Place of birth for the foreign-born population - Croatia (%)
Place of birth for the foreign-born population - Czechoslovakia (%)
Place of birth for the foreign-born population - Hungary (%)
Place of birth for the foreign-born population - Latvia (%)
Place of birth for the foreign-born population - Lithuania (%)
Place of birth for the foreign-born population - North Macedonia (Macedonia) (%)
Place of birth for the foreign-born population - Moldova (%)
Place of birth for the foreign-born population - Poland (%)
Place of birth for the foreign-born population - Romania (%)
Place of birth for the foreign-born population - Russia (%)
Place of birth for the foreign-born population - Serbia (%)
Place of birth for the foreign-born population - Ukraine (%)
Place of birth for the foreign-born population - Other Eastern Europe (%)
Place of birth for the foreign-born population - China (%)
Place of birth for the foreign-born population - Hong Kong (%)
Place of birth for the foreign-born population - Taiwan (%)
Place of birth for the foreign-born population - Japan (%)
Place of birth for the foreign-born population - Korea (%)
Place of birth for the foreign-born population - Other Eastern Asia (%)
Place of birth for the foreign-born population - Afghanistan (%)
Place of birth for the foreign-born population - Bangladesh (%)
Place of birth for the foreign-born population - India (%)
Place of birth for the foreign-born population - Iran (%)
Place of birth for the foreign-born population - Kazakhstan (%)
Place of birth for the foreign-born population - Nepal (%)
Place of birth for the foreign-born population - Pakistan (%)
Place of birth for the foreign-born population - Sri Lanka (%)
Place of birth for the foreign-born population - Uzbekistan (%)
Place of birth for the foreign-born population - Other South Central Asia (%)
Place of birth for the foreign-born population - Burma (%)
Place of birth for the foreign-born population - Cambodia (%)
Place of birth for the foreign-born population - Indonesia (%)
Place of birth for the foreign-born population - Laos (%)
Place of birth for the foreign-born population - Malaysia (%)
Place of birth for the foreign-born population - Philippines (%)
Place of birth for the foreign-born population - Singapore (%)
Place of birth for the foreign-born population - Thailand (%)
Place of birth for the foreign-born population - Vietnam (%)
Place of birth for the foreign-born population - Other South Eastern Asia (%)
Place of birth for the foreign-born population - Armenia (%)
Place of birth for the foreign-born population - Iraq (%)
Place of birth for the foreign-born population - Israel (%)
Place of birth for the foreign-born population - Jordan (%)
Place of birth for the foreign-born population - Kuwait (%)
Place of birth for the foreign-born population - Lebanon (%)
Place of birth for the foreign-born population - Saudi Arabia (%)
Place of birth for the foreign-born population - Syria (%)
Place of birth for the foreign-born population - Turkey (%)
Place of birth for the foreign-born population - Yemen (%)
Place of birth for the foreign-born population - Other Western Asia (%)
Place of birth for the foreign-born population - Eritrea (%)
Place of birth for the foreign-born population - Ethiopia (%)
Place of birth for the foreign-born population - Kenya (%)
Place of birth for the foreign-born population - Somalia (%)
Place of birth for the foreign-born population - Uganda (%)
Place of birth for the foreign-born population - Zimbabwe (%)
Place of birth for the foreign-born population - Other Eastern Africa (%)
Place of birth for the foreign-born population - Cameroon (%)
Place of birth for the foreign-born population - Congo (%)
Place of birth for the foreign-born population - Democratic Republic of Congo (Zaire) (%)
Place of birth for the foreign-born population - Other Middle Africa (%)
Place of birth for the foreign-born population - Egypt (%)
Place of birth for the foreign-born population - Morocco (%)
Place of birth for the foreign-born population - Sudan (%)
Place of birth for the foreign-born population - Other Northern Africa (%)
Place of birth for the foreign-born population - South Africa (%)
Place of birth for the foreign-born population - Other Southern Africa (%)
Place of birth for the foreign-born population - Cabo Verde (%)
Place of birth for the foreign-born population - Ghana (%)
Place of birth for the foreign-born population - Liberia (%)
Place of birth for the foreign-born population - Nigeria (%)
Place of birth for the foreign-born population - Senegal (%)
Place of birth for the foreign-born population - Sierra Leone (%)
Place of birth for the foreign-born population - Other Western Africa (%)
Place of birth for the foreign-born population - Australia (%)
Place of birth for the foreign-born population - New Zealand (%)
Place of birth for the foreign-born population - Fiji (%)
Place of birth for the foreign-born population - Micronesia (%)
Place of birth for the foreign-born population - Bahamas (%)
Place of birth for the foreign-born population - Barbados (%)
Place of birth for the foreign-born population - Cuba (%)
Place of birth for the foreign-born population - Dominica (%)
Place of birth for the foreign-born population - Dominican Republic (%)
Place of birth for the foreign-born population - Grenada (%)
Place of birth for the foreign-born population - Haiti (%)
Place of birth for the foreign-born population - Jamaica (%)
Place of birth for the foreign-born population - St. Vincent and the Grenadines (%)
Place of birth for the foreign-born population - Trinidad and Tobago (%)
Place of birth for the foreign-born population - West Indies (%)
Place of birth for the foreign-born population - Other Caribbean (%)
Place of birth for the foreign-born population - Belize (%)
Place of birth for the foreign-born population - Costa Rica (%)
Place of birth for the foreign-born population - El Salvador (%)
Place of birth for the foreign-born population - Guatemala (%)
Place of birth for the foreign-born population - Honduras (%)
Place of birth for the foreign-born population - Mexico (%)
Place of birth for the foreign-born population - Nicaragua (%)
Place of birth for the foreign-born population - Panama (%)
Place of birth for the foreign-born population - Other Central America (%)
Place of birth for the foreign-born population - Argentina (%)
Place of birth for the foreign-born population - Bolivia (%)
Place of birth for the foreign-born population - Brazil (%)
Place of birth for the foreign-born population - Chile (%)
Place of birth for the foreign-born population - Colombia (%)
Place of birth for the foreign-born population - Ecuador (%)
Place of birth for the foreign-born population - Guyana (%)
Place of birth for the foreign-born population - Peru (%)
Place of birth for the foreign-born population - Uruguay (%)
Place of birth for the foreign-born population - Venezuela (%)
Place of birth for the foreign-born population - Other South America (%)
Place of birth for the foreign-born population - Canada (%)
Place of birth for the foreign-born population - Other Northern America (%)
Place of birth for the foreign-born population - Other (%)
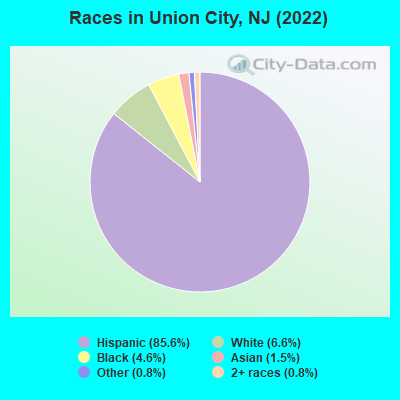
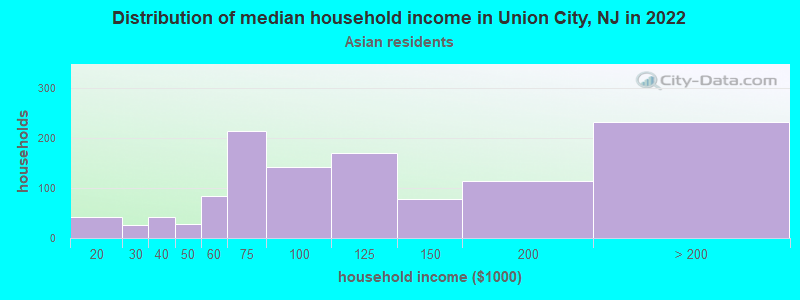
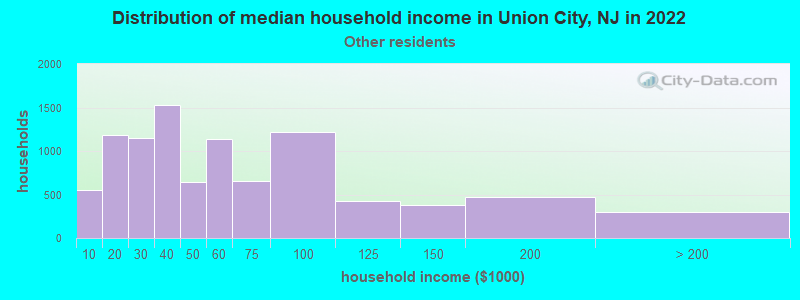
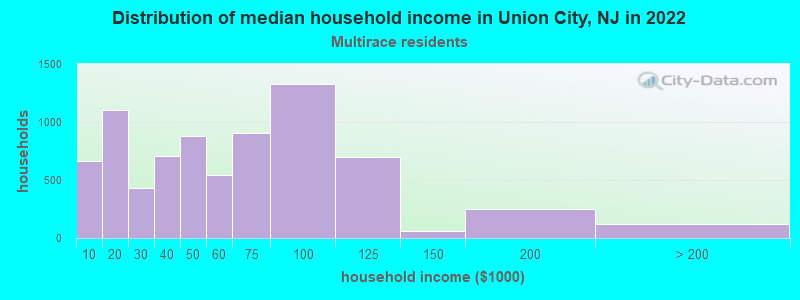
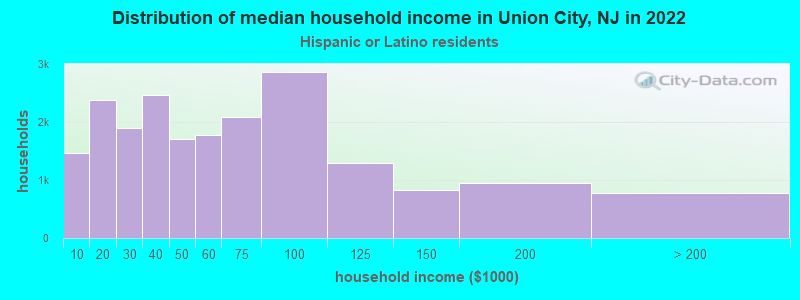
According to 2022 data, the most numerous races in Union City, NJ are White alone (4,313 residents), Hispanic (55,960 residents), and Black alone (3,009 residents). 19.5% of Union City residents speak English at home. 56.2% of Union City, NJ residents are foreign-born (49.8% born in Latin America), which is 59.1% greater than the foreign-born rate of 23.0% across the entire state of New Jersey.
Race distribution in Union City
2000 2022
5,557,209 66.0% White alone 1,117,191 13.3% Hispanic 1,096,171 13.0% Black alone 477,012 5.7% Asian alone 133,689 1.6% Two or more races 19,565 0.2% Other race alone 11,338 0.1% American Indian alone 2,175 0.03% Native Hawaiian and Other
4,766,476 51.5% White alone 2,028,470 21.9% Hispanic 1,111,632 12.0% Black alone 923,546 10.0% Asian alone 332,237 3.6% Two or more races 89,847 1.0% Other race alone 8,557 0.09% American Indian alone 934 0.01% Native Hawaiian and Other
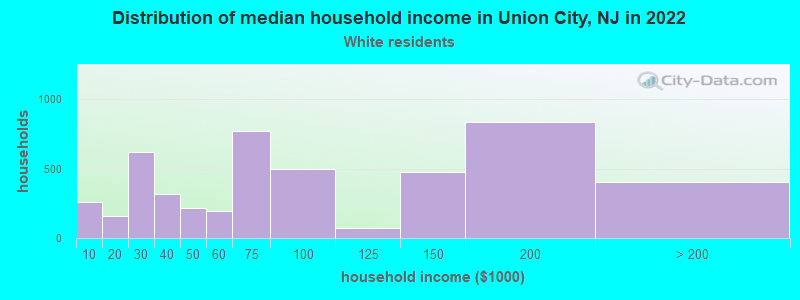
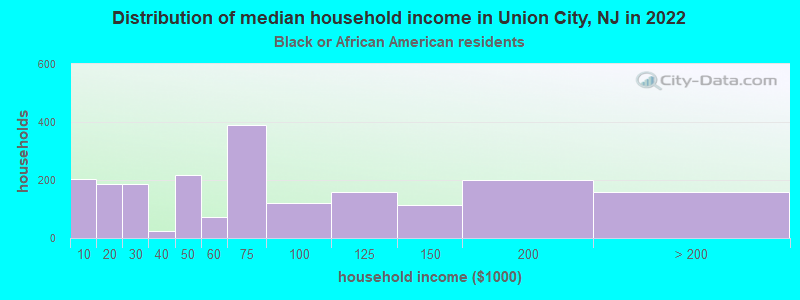
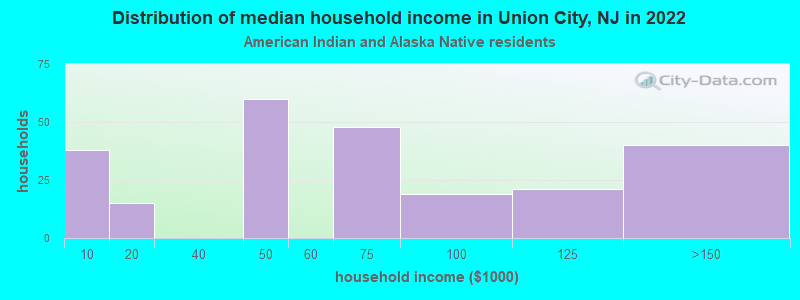
Income and house value in Union City Median household income in 2022 $74,953 White non-Hispanic householders$71,055 Black householders$59,238 American Indian and Alaska Native householders$107,941 Asian householders$48,280 Some other race householders$53,257 Two or more races householders$51,926 Hispanic or Latino race householdersMedian 2022 house value $341,518 White Non-Hispanic householders$373,594 Black or African American householders$438,016 American Indian or Alaska Native householders $368,742 Asian householders$392,732 Some other race householders$347,178 Two or more races householders$400,549 Hispanic or Latino householders
Median age by race in Union City
34.9 Median age for White residents34.2 36.0 35.4 Median age for Black or African American residents35.4 35.5 40.6 Median age for American Indian / Alaska Native residents41.8 40.1 39.1 Median age for Asian residents39.4 32.4 -666,666,666.0 Median age for Native Hawaiian / Pacific Islander residents-666,666,666.0 -666,666,666.0 33.0 Median age for Other race residents34.5 31.1 39.2 Median age for Two or more races residents36.8 39.9 34.7 Median age for White alone residents34.8 34.3 36.3 Median age for Hispanic or Latino residents36.6 36.0
Owner/renter occupied households by race in Union City
House owners and renters - White residents 1,440 29.9% Owner occupied3,370 70.1% Renter occupiedHouse owners and renters - Black or African American residents 201 10.6% Owner occupied1,696 89.4% Renter occupiedHouse owners and renters - American Indian / Alaska Native residents 104 44.6% Owner occupied129 55.4% Renter occupiedHouse owners and renters - Asian residents 614 73.2% Owner occupied225 26.8% Renter occupiedHouse owners and renters - Native Hawaiian / Pacific Islander residents 31 100.0% Renter occupiedHouse owners and renters - Other race residents 1,197 12.4% Owner occupied8,443 87.6% Renter occupiedHouse owners and renters - Two or more races residents 1,751 22.8% Owner occupied5,928 77.2% Renter occupiedHouse owners and renters - White alone residents 1,053 49.9% Owner occupied1,058 50.1% Renter occupiedHouse owners and renters - Hispanic or Latino residents 3,499 17.1% Owner occupied16,964 82.9% Renter occupied
Language usage in Union City
English speakers - Total 19.5% of residents of Union City speak English at home.
75.7% of residents speak Spanish at home 19,134 41.0% Speak English very well27,542 59.0% Speak English less than very well4.8% of residents speak other language at home 2,210 75.0% Speak English very well738 25.0% Speak English less than very well
English speakers - Born in the United States 74.1% of residents of Union City speak English at home.
22.1% of residents speak Spanish at home 920 71.8% Speak English very well361 28.2% Speak English less than very well3.8% of residents speak other language at home 222 100.0% Speak English very well
English speakers - Native, born elsewhere 9.7% of residents of Union City speak English at home.
90.3% of residents speak Spanish at home 1,352 47.3% Speak English very well1,505 52.7% Speak English less than very well
English speakers - Foreign-born 6.8% of residents of Union City speak English at home.
86.8% of residents speak Spanish at home 7,582 23.6% Speak English very well24,612 76.4% Speak English less than very well6.3% of residents speak other language at home 1,609 68.6% Speak English very well738 31.4% Speak English less than very well
White (Caucasian) - Speak only English Native:
66.8% (4,506)Foreign-born:
1.2% (46)
White (Caucasian) - Speak another language Native:
33.2% (2,237)Foreign-born:
98.8% (3,741)
Black or African American - Speak only English Native:
66.8% (1,363)Foreign-born:
18.9% (300)
Black or African American - Speak another language Native:
22.1% (451)Foreign-born:
72.3% (1,148)
American Indian / Alaska Native - Speak another language Native:
92.0% (489)Foreign-born:
100.0% (442)
Asian - Speak only English Native:
36.7% (195)Foreign-born:
16.3% (250)
Asian - Speak another language Native:
57.7% (308)Foreign-born:
83.9% (1,287)
Native Hawaiian / Pacific Islander - Speak another language Native:
100.0% (24)Foreign-born:
100.0% (64)
Other race - Speak only English Native:
8.8% (668)Foreign-born:
8.3% (1,487)
Other race - Speak another language Native:
91.2% (6,909)Foreign-born:
91.7% (16,495)
Two or more races - Speak only English Native:
30.1% (2,173)Foreign-born:
6.4% (789)
Two or more races - Speak another language Native:
69.9% (5,055)Foreign-born:
93.6% (11,495)
White alone - Speak only English Native:
77.2% (4,357)Foreign-born:
13.4% (149)
White alone - Speak another language Native:
22.4% (1,266)Foreign-born:
83.3% (932)
Hispanic or Latino - Speak only English Native:
21.1% (3,806)Foreign-born:
6.6% (2,276)
Hispanic or Latino - Speak another language Native:
78.9% (14,194)Foreign-born:
93.4% (32,236)
Foreign-born residents in Union City 37,342 residents are foreign born (49.8% Latin America ).
This city:
56.2%New Jersey:
23.2%
Marital status for residents in Union City Marital status - White (Caucasian) population 15 years and over
Males 40.4% Never married42.3% Now married0.0% Separated5.6% Widowed11.7% DivorcedFemales 42.0% Never married42.4% Now married4.8% Separated8.9% Widowed2.0% DivorcedWomen who gave birth in the past 12 months Now married:
65.5% (199)Unmarried:
34.5% (105)
Women who did not give birth in the past 12 months Now married:
36.1% (1,666)Unmarried:
63.9% (2,949)
Marital status - Black or African American population 15 years and over
Males 57.1% Never married30.9% Now married2.1% Separated3.3% Widowed6.6% DivorcedFemales 49.0% Never married32.2% Now married5.5% Separated2.7% Widowed10.6% DivorcedWomen who gave birth in the past 12 months Now married:
100.0% (16)Unmarried:
0.0% (0)
Women who did not give birth in the past 12 months Now married:
34.5% (409)Unmarried:
65.5% (776)
Marital status - American Indian / Alaska Native population 15 years and over
Males 61.6% Never married14.0% Now married14.7% Separated8.1% Widowed1.6% DivorcedFemales 57.1% Never married35.7% Now married0.0% Separated0.0% Widowed7.1% DivorcedWomen who did not give birth in the past 12 months Now married:
30.4% (59)Unmarried:
69.6% (134)
Marital status - Asian population 15 years and over
Males 43.1% Never married42.5% Now married2.2% Separated0.0% Widowed12.2% DivorcedFemales 23.8% Never married50.5% Now married2.5% Separated9.4% Widowed13.8% DivorcedWomen who gave birth in the past 12 months Now married:
53.1% (17)Unmarried:
46.9% (15)
Women who did not give birth in the past 12 months Now married:
53.9% (287)Unmarried:
46.1% (246)
Marital status - Native Hawaiian / Pacific Islander population 15 years and over
Males 0.0% Never married100.0% Now married0.0% Separated0.0% Widowed0.0% DivorcedFemales 30.1% Never married34.2% Now married35.6% Separated0.0% Widowed0.0% DivorcedWomen who did not give birth in the past 12 months Now married:
0.0% (0)Unmarried:
100.0% (23)
Marital status - Other race population 15 years and over
Males 50.1% Never married35.2% Now married2.2% Separated0.7% Widowed11.8% DivorcedFemales 41.7% Never married30.5% Now married3.8% Separated6.6% Widowed17.4% DivorcedWomen who gave birth in the past 12 months Now married:
70.2% (113)Unmarried:
29.8% (48)
Women who did not give birth in the past 12 months Now married:
29.6% (1,985)Unmarried:
70.4% (4,729)
Marital status - Two or more races population 15 years and over
Males 41.8% Never married45.1% Now married2.4% Separated2.9% Widowed7.8% DivorcedFemales 35.5% Never married26.5% Now married10.6% Separated14.0% Widowed13.4% DivorcedWomen who gave birth in the past 12 months Now married:
94.7% (160)Unmarried:
5.3% (9)
Women who did not give birth in the past 12 months Now married:
40.9% (1,726)Unmarried:
59.1% (2,490)
Marital status - White alone, not Hispanic / Latino population 15 years and over
Males 48.1% Never married43.8% Now married0.6% Separated2.3% Widowed5.2% DivorcedFemales 41.9% Never married41.5% Now married1.8% Separated9.3% Widowed5.6% DivorcedWomen who gave birth in the past 12 months Now married:
75.8% (109)Unmarried:
24.2% (35)
Women who did not give birth in the past 12 months Now married:
42.2% (752)Unmarried:
57.8% (1,029)
Marital status - Hispanic or Latino population 15 years and over
Males 44.6% Never married40.0% Now married2.0% Separated2.8% Widowed10.7% DivorcedFemales 39.0% Never married31.1% Now married6.3% Separated9.5% Widowed14.0% DivorcedWomen who gave birth in the past 12 months Now married:
85.7% (342)Unmarried:
14.3% (57)
Women who did not give birth in the past 12 months Now married:
33.8% (4,286)Unmarried:
66.2% (8,386)
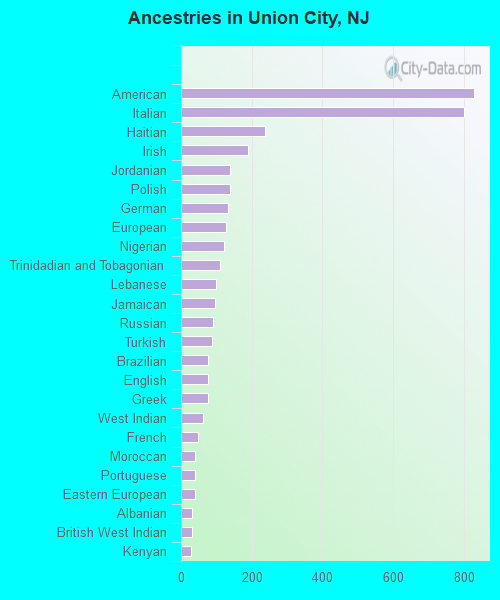
Ancestries in Union City
830 1.8% American801 1.7% Italian238 0.5% Haitian189 0.4% Irish140 0.3% Jordanian138 0.3% Polish134 0.3% German127 0.3% European122 0.3% Nigerian111 0.2% Trinidadian and Tobagonian99 0.2% Lebanese96 0.2% Jamaican90 0.2% Russian87 0.2% Turkish77 0.2% Brazilian76 0.2% English75 0.2% Greek62 0.1% West Indian49 0.1% French41 0.09% Moroccan41 0.09% Portuguese39 0.08% Eastern European32 0.07% Albanian32 0.07% British West Indian27 0.06% Kenyan27 0.06% Hungarian25 0.05% Senegalese23 0.05% Macedonian23 0.05% Dutch20 0.04% Egyptian20 0.04% Swiss20 0.04% Israeli19 0.04% Slavic17 0.04% Syrian16 0.03% Romanian15 0.03% Guyanese15 0.03% Ukrainian14 0.03% Scotch-Irish14 0.03% Barbadian13 0.03% Assyrian13 0.03% Finnish6 0.01% Sierra Leonean
Geographical mobility in Union City Same house 1 year ago 15,870 87.1% White (Caucasian)3,692 88.6% Black or African American655 84.2% American Indian / Alaska Native1,880 90.1% Asian90 100.0% Native Hawaiian / Pacific Islander24,524 89.3% Other race17,125 89.4% Two or more races6,145 84.8% White alone, not Hispanic / Latino48,063 86.7% Hispanic or LatinoMoved within same county 1,043 5.7% White / Caucasian88 2.1% Black or African American145 18.6% American Indian / Alaska Native82 3.9% Asian1,265 4.6% Other race850 4.4% Two or more races439 6.1% White alone, not Hispanic / Latino3,525 6.4% Hispanic or LatinoMoved within same state 266 1.5% White / Caucasian218 5.2% Black or African American39 1.9% Asian333 1.2% Other race267 1.4% Two or more races160 2.2% White alone, not Hispanic / Latino191 0.3% Hispanic or LatinoMoved from different state 594 3.3% White / Caucasian108 2.6% Black or African American70 3.4% Asian479 1.7% Other race298 1.6% Two or more races431 6.0% White alone, not Hispanic / Latino944 1.7% Hispanic or LatinoMoved from abroad 176 1.0% White20 0.5% Black or African American18 0.9% Asian866 3.2% Other race630 3.3% Two or more races58 0.8% White alone, not Hispanic / Latino2,714 4.9% Hispanic or Latino
Children Nativity (place of birth) in Union City
Children under 6 years - Living with two parents Both parents native 248 100.0% NativeBoth parents foreign-born 930 100.0% NativeOne native, one foreign-born parent 116 100.0% NativeChildren under 6 years - Living with one parent Native parent 914 100.0% NativeForeign-born parent 1,484 62.4% Native894 37.6% Foreign-bornChildren 6 to 17 years - Living with two parents Both parents native 395 100.0% NativeBoth parents foreign-born 2,716 77.3% Native797 22.7% Foreign-bornOne native, one foreign-born parent 911 100.0% NativeChildren 6 to 17 years - Living with one parent Native parent 664 100.0% NativeForeign-born parent 4,073 57.4% Native3,029 42.6% Foreign-born
Place of birth for residents in Union City 34,073 Americas34,062 Latin America13,743 Caribbean11,023 South America9,295 Central America1,820 Asia996 Europe647 South Central Asia505 South Eastern Asia470 Eastern Asia451 Africa343 Southern Europe306 Eastern Europe287 China220 Western Europe177 Western Asia168 Western Africa126 Northern Europe122 Northern Africa73 Southern Africa51 Eastern Africa35 Middle Africa11 Northern America8,278 Dominican Republic5,128 Cuba4,566 Ecuador3,685 El Salvador2,796 Mexico2,632 Colombia1,794 Peru1,296 Honduras1,086 Guatemala1,000 Venezuela419 India329 Chile315 Philippines301 Bolivia205 China198 Panama198 Italy172 Uruguay145 Spain141 Costa Rica140 Haiti126 Thailand125 Brazil105 Switzerland104 Korea98 Uzbekistan92 Sri Lanka90 Nicaragua87 Jordan85 Argentina82 Senegal80 Trinidad and Tobago78 Japan69 Albania65 Nigeria65 Algeria59 United Kingdom57 Ukraine57 Jamaica55 Yemen53 Germany45 North Macedonia (Macedonia)45 Taiwan45 Poland44 Russia42 France36 Morocco36 Hong Kong33 Indonesia28 Kenya26 Lebanon23 Ireland20 Egypt19 St. Vincent and the Grenadines18 Singapore17 Belarus17 Norway16 Ghana15 Pakistan15 Romania15 Guyana12 Vietnam12 Bangladesh11 Canada10 Bosnia and Herzegovina10 Netherlands9 Iran9 England8 Belgium7 Ethiopia5 South Africa5 Sierra Leone5 Barbados4 Israel4 Turkey
Grandparents responsible for own grandchildren in Union City
Grandparents (30 to 59 years) White / Caucasian 18 13.7% Responsible for grandchildren111 86.3% Not responsible for grandchildrenOther race 389 37.0% Responsible for grandchildren664 63.0% Not responsible for grandchildrenTwo or more races 21 11.2% Responsible for grandchildren167 88.8% Not responsible for grandchildrenWhite alone, not Hispanic / Latino 7 35.9% Responsible for grandchildren13 64.1% Not responsible for grandchildrenHispanic or Latino 302 32.0% Responsible for grandchildren643 68.0% Not responsible for grandchildrenGrandparents (60 years and over) White / Caucasian 71 22.6% Responsible for grandchildren242 77.4% Not responsible for grandchildrenOther race 614 100.0% Not responsible for grandchildrenTwo or more races 402 100.0% Not responsible for grandchildrenWhite alone, not Hispanic / Latino 39 100.0% Not responsible for grandchildrenHispanic or Latino 55 4.7% Responsible for grandchildren1,123 95.3% Not responsible for grandchildren