Races in Victoria, Texas (TX) Detailed Stats
Data:
Races - White alone (%)
Races - White alone (% change since 2000)
Races - Black alone (%)
Races - Black alone (% change since 2000)
Races - American Indian alone (%)
Races - American Indian alone (% change since 2000)
Races - Asian alone (%)
Races - Asian alone (% change since 2000)
Races - Hispanic (%)
Races - Hispanic (% change since 2000)
Races - Native Hawaiian and Other Pacific Islander alone (%)
Races - Native Hawaiian and Other Pacific Islander alone (% change since 2000)
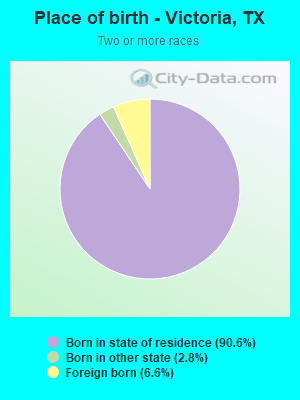
Races - Two or more races(%)
Races - Two or more races(% change since 2000)
Races - Other race alone (%)
Races - Other race alone (% change since 2000)
Racial diversity
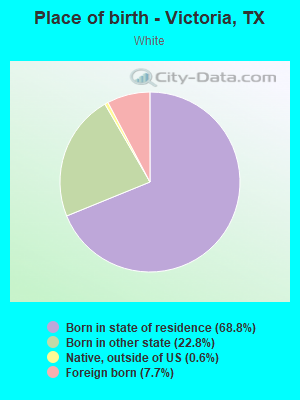
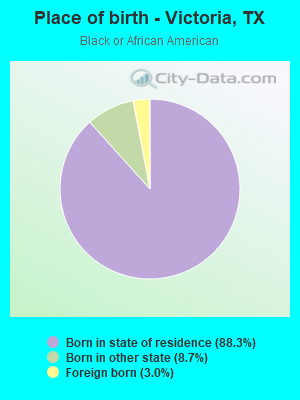
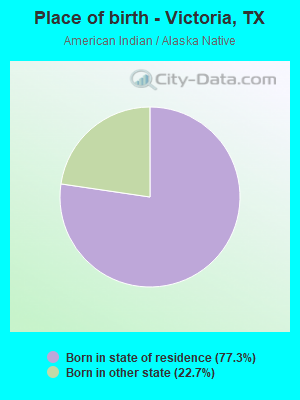
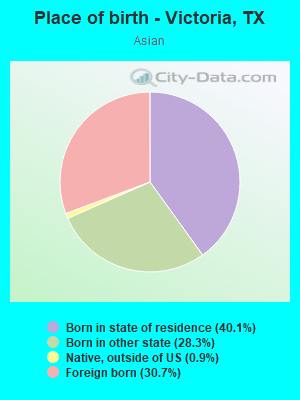
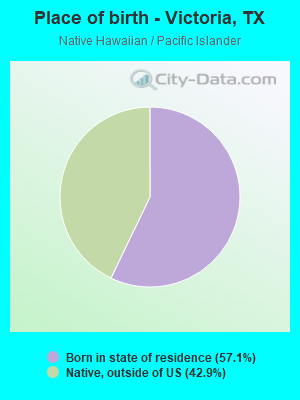
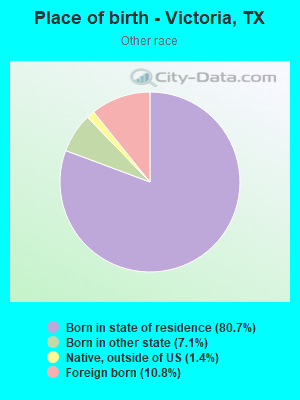
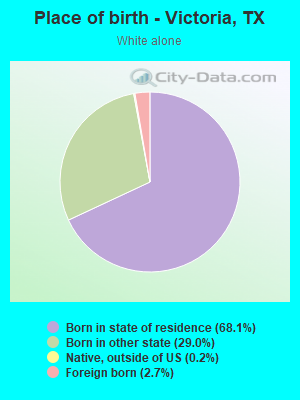
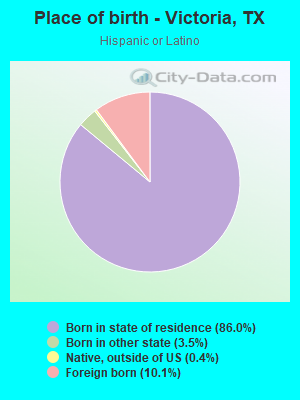
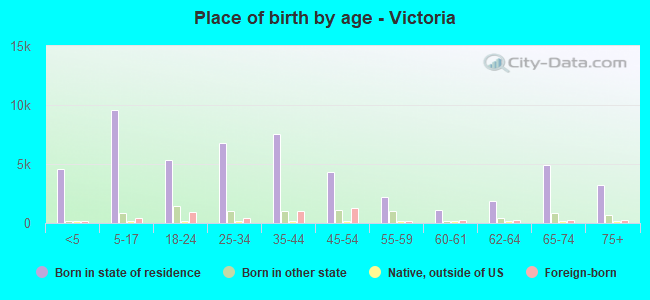
Place of birth - Born in state of residence (%)
Place of birth - Born in state of residence (%) - White
Place of birth - Born in state of residence (%) - Black or African American
Place of birth - Born in state of residence (%) - Asian
Place of birth - Born in state of residence (%) - Hispanic or Latino
Place of birth - Born in state of residence (%) - American Indian and Alaska Native
Place of birth - Born in state of residence (%) - Multirace
Place of birth - Born in state of residence (%) - Other Race
Place of birth - Born in other state (%)
Place of birth - Born in other state (%) - White
Place of birth - Born in other state (%) - Black or African American
Place of birth - Born in other state (%) - Asian
Place of birth - Born in other state (%) - Hispanic or Latino
Place of birth - Born in other state (%) - American Indian and Alaska Native
Place of birth - Born in other state (%) - Multirace
Place of birth - Born in other state (%) - Other Race
Place of birth - Native, outside of US (%)
Place of birth - Native, outside of US (%) - White
Place of birth - Native, outside of US (%) - Black or African American
Place of birth - Native, outside of US (%) - Asian
Place of birth - Native, outside of US (%) - Hispanic or Latino
Place of birth - Native, outside of US (%) - American Indian and Alaska Native
Place of birth - Native, outside of US (%) - Multirace
Place of birth - Native, outside of US (%) - Other Race
Place of birth - Foreign born (%)
Place of birth - Foreign born (%) - White
Place of birth - Foreign born (%) - Black or African American
Place of birth - Foreign born (%) - Asian
Place of birth - Foreign born (%) - Hispanic or Latino
Place of birth - Foreign born (%) - American Indian and Alaska Native
Place of birth - Foreign born (%) - Multirace
Place of birth - Foreign born (%) - Other Race
Residents speaking English at home (%)
Residents speaking English at home - Born in the United States (%)
Residents speaking English at home - Native, born elsewhere (%)
Residents speaking English at home - Foreign born (%)
Residents speaking Spanish at home (%)
Residents speaking Spanish at home - Born in the United States (%)
Residents speaking Spanish at home - Native, born elsewhere (%)
Residents speaking Spanish at home - Foreign born (%)
Residents speaking other language at home (%)
Residents speaking other language at home - Born in the United States (%)
Residents speaking other language at home - Native, born elsewhere (%)
Residents speaking other language at home - Foreign born (%)
Marital status - Never married (%)
Marital status - Now married (%)
Marital status - Separated (%)
Marital status - Widowed (%)
Marital status - Divorced (%)
Ancestries Reported - Arab (%)
Ancestries Reported - Czech (%)
Ancestries Reported - Danish (%)
Ancestries Reported - Dutch (%)
Ancestries Reported - English (%)
Ancestries Reported - French (%)
Ancestries Reported - French Canadian (%)
Ancestries Reported - German (%)
Ancestries Reported - Greek (%)
Ancestries Reported - Hungarian (%)
Ancestries Reported - Irish (%)
Ancestries Reported - Italian (%)
Ancestries Reported - Lithuanian (%)
Ancestries Reported - Norwegian (%)
Ancestries Reported - Polish (%)
Ancestries Reported - Portuguese (%)
Ancestries Reported - Russian (%)
Ancestries Reported - Scotch-Irish (%)
Ancestries Reported - Scottish (%)
Ancestries Reported - Slovak (%)
Ancestries Reported - Subsaharan African (%)
Ancestries Reported - Swedish (%)
Ancestries Reported - Swiss (%)
Ancestries Reported - Ukrainian (%)
Ancestries Reported - United States (%)
Ancestries Reported - Welsh (%)
Ancestries Reported - West Indian (%)
Ancestries Reported - Other (%)
Geographical mobility - Same house 1 year ago (%)
Geographical mobility - Same house 1 year ago (%) - White
Geographical mobility - Same house 1 year ago (%) - Black or African American
Geographical mobility - Same house 1 year ago (%) - Asian
Geographical mobility - Same house 1 year ago (%) - Hispanic or Latino
Geographical mobility - Same house 1 year ago (%) - American Indian and Alaska Native
Geographical mobility - Same house 1 year ago (%) - Multirace
Geographical mobility - Same house 1 year ago (%) - Other Race
Geographical mobility - Moved within same county (%)
Geographical mobility - Moved within same county (%) - White
Geographical mobility - Moved within same county (%) - Black or African American
Geographical mobility - Moved within same county (%) - Asian
Geographical mobility - Moved within same county (%) - Hispanic or Latino
Geographical mobility - Moved within same county (%) - American Indian and Alaska Native
Geographical mobility - Moved within same county (%) - Multirace
Geographical mobility - Moved within same county (%) - Other Race
Geographical mobility - Moved from different county within same state (%)
Geographical mobility - Moved from different county within same state (%) - White
Geographical mobility - Moved from different county within same state (%) - Black or African American
Geographical mobility - Moved from different county within same state (%) - Asian
Geographical mobility - Moved from different county within same state (%) - Hispanic or Latino
Geographical mobility - Moved from different county within same state (%) - American Indian and Alaska Native
Geographical mobility - Moved from different county within same state (%) - Multirace
Geographical mobility - Moved from different county within same state (%) - Other Race
Geographical mobility - Moved from different state (%)
Geographical mobility - Moved from different state (%) - White
Geographical mobility - Moved from different state (%) - Black or African American
Geographical mobility - Moved from different state (%) - Asian
Geographical mobility - Moved from different state (%) - Hispanic or Latino
Geographical mobility - Moved from different state (%) - American Indian and Alaska Native
Geographical mobility - Moved from different state (%) - Multirace
Geographical mobility - Moved from different state (%) - Other Race
Geographical mobility - Moved from abroad (%)
Geographical mobility - Moved from abroad (%) - White
Geographical mobility - Moved from abroad (%) - Black or African American
Geographical mobility - Moved from abroad (%) - Asian
Geographical mobility - Moved from abroad (%) - Hispanic or Latino
Geographical mobility - Moved from abroad (%) - American Indian and Alaska Native
Geographical mobility - Moved from abroad (%) - Multirace
Geographical mobility - Moved from abroad (%) - Other Race
Place of birth for the foreign-born population - Ireland (%)
Place of birth for the foreign-born population - Denmark (%)
Place of birth for the foreign-born population - Norway (%)
Place of birth for the foreign-born population - Sweden (%)
Place of birth for the foreign-born population - United Kingdom (%)
Place of birth for the foreign-born population - England (%)
Place of birth for the foreign-born population - Scotland (%)
Place of birth for the foreign-born population - Other Northern Europe (%)
Place of birth for the foreign-born population - Austria (%)
Place of birth for the foreign-born population - Belgium (%)
Place of birth for the foreign-born population - France (%)
Place of birth for the foreign-born population - Germany (%)
Place of birth for the foreign-born population - Netherlands (%)
Place of birth for the foreign-born population - Switzerland (%)
Place of birth for the foreign-born population - Other Western Europe (%)
Place of birth for the foreign-born population - Greece (%)
Place of birth for the foreign-born population - Italy (%)
Place of birth for the foreign-born population - Portugal (%)
Place of birth for the foreign-born population - Spain (%)
Place of birth for the foreign-born population - Other Southern Europe (%)
Place of birth for the foreign-born population - Albania (%)
Place of birth for the foreign-born population - Belarus (%)
Place of birth for the foreign-born population - Bosnia and Herzegovina (%)
Place of birth for the foreign-born population - Bulgaria (%)
Place of birth for the foreign-born population - Croatia (%)
Place of birth for the foreign-born population - Czechoslovakia (%)
Place of birth for the foreign-born population - Hungary (%)
Place of birth for the foreign-born population - Latvia (%)
Place of birth for the foreign-born population - Lithuania (%)
Place of birth for the foreign-born population - North Macedonia (Macedonia) (%)
Place of birth for the foreign-born population - Moldova (%)
Place of birth for the foreign-born population - Poland (%)
Place of birth for the foreign-born population - Romania (%)
Place of birth for the foreign-born population - Russia (%)
Place of birth for the foreign-born population - Serbia (%)
Place of birth for the foreign-born population - Ukraine (%)
Place of birth for the foreign-born population - Other Eastern Europe (%)
Place of birth for the foreign-born population - China (%)
Place of birth for the foreign-born population - Hong Kong (%)
Place of birth for the foreign-born population - Taiwan (%)
Place of birth for the foreign-born population - Japan (%)
Place of birth for the foreign-born population - Korea (%)
Place of birth for the foreign-born population - Other Eastern Asia (%)
Place of birth for the foreign-born population - Afghanistan (%)
Place of birth for the foreign-born population - Bangladesh (%)
Place of birth for the foreign-born population - India (%)
Place of birth for the foreign-born population - Iran (%)
Place of birth for the foreign-born population - Kazakhstan (%)
Place of birth for the foreign-born population - Nepal (%)
Place of birth for the foreign-born population - Pakistan (%)
Place of birth for the foreign-born population - Sri Lanka (%)
Place of birth for the foreign-born population - Uzbekistan (%)
Place of birth for the foreign-born population - Other South Central Asia (%)
Place of birth for the foreign-born population - Burma (%)
Place of birth for the foreign-born population - Cambodia (%)
Place of birth for the foreign-born population - Indonesia (%)
Place of birth for the foreign-born population - Laos (%)
Place of birth for the foreign-born population - Malaysia (%)
Place of birth for the foreign-born population - Philippines (%)
Place of birth for the foreign-born population - Singapore (%)
Place of birth for the foreign-born population - Thailand (%)
Place of birth for the foreign-born population - Vietnam (%)
Place of birth for the foreign-born population - Other South Eastern Asia (%)
Place of birth for the foreign-born population - Armenia (%)
Place of birth for the foreign-born population - Iraq (%)
Place of birth for the foreign-born population - Israel (%)
Place of birth for the foreign-born population - Jordan (%)
Place of birth for the foreign-born population - Kuwait (%)
Place of birth for the foreign-born population - Lebanon (%)
Place of birth for the foreign-born population - Saudi Arabia (%)
Place of birth for the foreign-born population - Syria (%)
Place of birth for the foreign-born population - Turkey (%)
Place of birth for the foreign-born population - Yemen (%)
Place of birth for the foreign-born population - Other Western Asia (%)
Place of birth for the foreign-born population - Eritrea (%)
Place of birth for the foreign-born population - Ethiopia (%)
Place of birth for the foreign-born population - Kenya (%)
Place of birth for the foreign-born population - Somalia (%)
Place of birth for the foreign-born population - Uganda (%)
Place of birth for the foreign-born population - Zimbabwe (%)
Place of birth for the foreign-born population - Other Eastern Africa (%)
Place of birth for the foreign-born population - Cameroon (%)
Place of birth for the foreign-born population - Congo (%)
Place of birth for the foreign-born population - Democratic Republic of Congo (Zaire) (%)
Place of birth for the foreign-born population - Other Middle Africa (%)
Place of birth for the foreign-born population - Egypt (%)
Place of birth for the foreign-born population - Morocco (%)
Place of birth for the foreign-born population - Sudan (%)
Place of birth for the foreign-born population - Other Northern Africa (%)
Place of birth for the foreign-born population - South Africa (%)
Place of birth for the foreign-born population - Other Southern Africa (%)
Place of birth for the foreign-born population - Cabo Verde (%)
Place of birth for the foreign-born population - Ghana (%)
Place of birth for the foreign-born population - Liberia (%)
Place of birth for the foreign-born population - Nigeria (%)
Place of birth for the foreign-born population - Senegal (%)
Place of birth for the foreign-born population - Sierra Leone (%)
Place of birth for the foreign-born population - Other Western Africa (%)
Place of birth for the foreign-born population - Australia (%)
Place of birth for the foreign-born population - New Zealand (%)
Place of birth for the foreign-born population - Fiji (%)
Place of birth for the foreign-born population - Micronesia (%)
Place of birth for the foreign-born population - Bahamas (%)
Place of birth for the foreign-born population - Barbados (%)
Place of birth for the foreign-born population - Cuba (%)
Place of birth for the foreign-born population - Dominica (%)
Place of birth for the foreign-born population - Dominican Republic (%)
Place of birth for the foreign-born population - Grenada (%)
Place of birth for the foreign-born population - Haiti (%)
Place of birth for the foreign-born population - Jamaica (%)
Place of birth for the foreign-born population - St. Vincent and the Grenadines (%)
Place of birth for the foreign-born population - Trinidad and Tobago (%)
Place of birth for the foreign-born population - West Indies (%)
Place of birth for the foreign-born population - Other Caribbean (%)
Place of birth for the foreign-born population - Belize (%)
Place of birth for the foreign-born population - Costa Rica (%)
Place of birth for the foreign-born population - El Salvador (%)
Place of birth for the foreign-born population - Guatemala (%)
Place of birth for the foreign-born population - Honduras (%)
Place of birth for the foreign-born population - Mexico (%)
Place of birth for the foreign-born population - Nicaragua (%)
Place of birth for the foreign-born population - Panama (%)
Place of birth for the foreign-born population - Other Central America (%)
Place of birth for the foreign-born population - Argentina (%)
Place of birth for the foreign-born population - Bolivia (%)
Place of birth for the foreign-born population - Brazil (%)
Place of birth for the foreign-born population - Chile (%)
Place of birth for the foreign-born population - Colombia (%)
Place of birth for the foreign-born population - Ecuador (%)
Place of birth for the foreign-born population - Guyana (%)
Place of birth for the foreign-born population - Peru (%)
Place of birth for the foreign-born population - Uruguay (%)
Place of birth for the foreign-born population - Venezuela (%)
Place of birth for the foreign-born population - Other South America (%)
Place of birth for the foreign-born population - Canada (%)
Place of birth for the foreign-born population - Other Northern America (%)
Place of birth for the foreign-born population - Other (%)
Latest news about races in Victoria, TX collected exclusively by city-data.com from local newspapers, TV, and radio stations
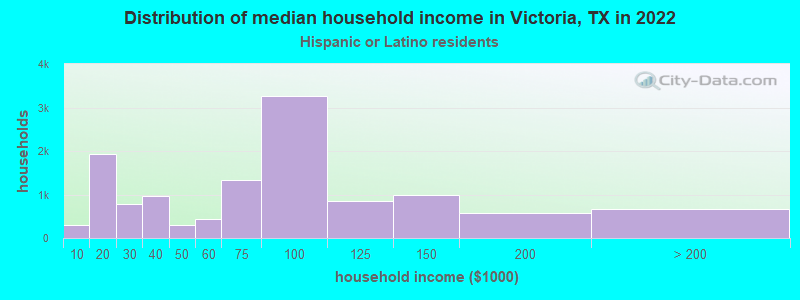
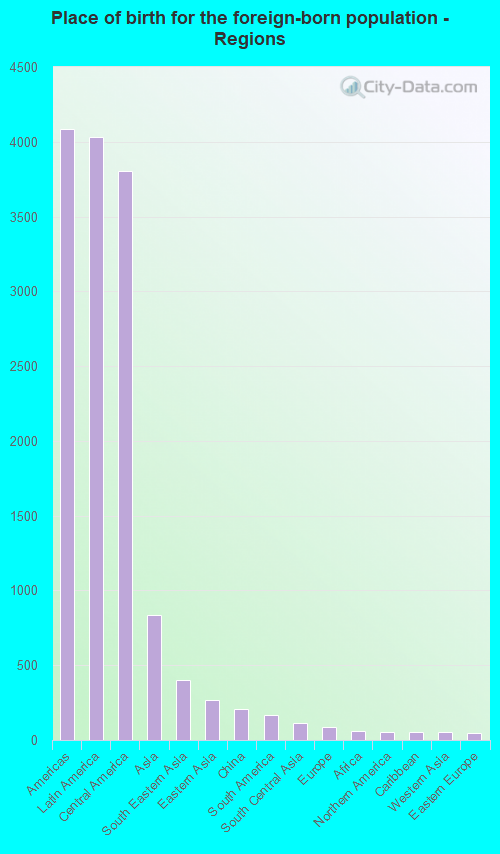
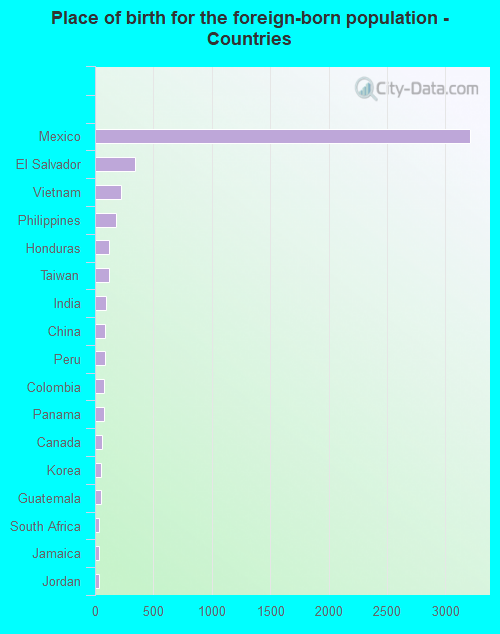
According to 2022 data, the most numerous races in Victoria, TX are Hispanic (37,621 residents), White alone (22,037 residents), and Black alone (4,181 residents). 71.8% of Victoria residents speak English at home. 7.7% of Victoria, TX residents are foreign-born (5.9% born in Latin America, 1.2% born in Asia), which is 119.4% less than the foreign-born rate of 17.0% across the entire state of Texas.
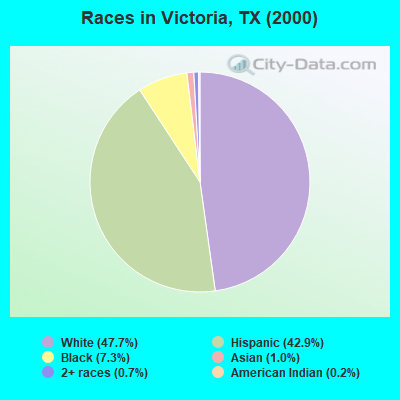
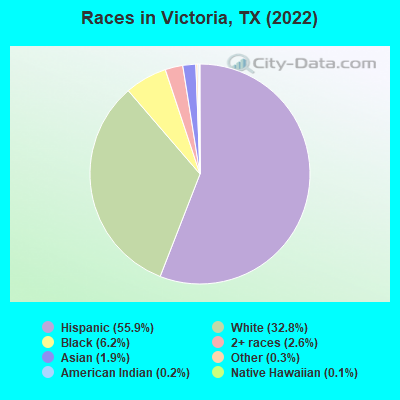
Race distribution in Victoria
2000 2022
10,933,313 52.4% White alone 6,669,666 32.0% Hispanic 2,364,255 11.3% Black alone 554,445 2.7% Asian alone 230,567 1.1% Two or more races 68,859 0.3% American Indian alone 19,958 0.10% Other race alone 10,757 0.05% Native Hawaiian and Other
12,070,642 40.2% Hispanic 11,683,430 38.9% White alone 3,508,706 11.7% Black alone 1,608,173 5.4% Asian alone 956,560 3.2% Two or more races 125,763 0.4% Other race alone 47,023 0.2% American Indian alone 29,275 0.10% Native Hawaiian and Other
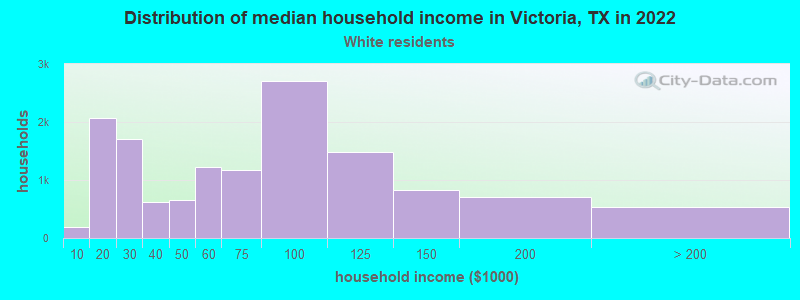
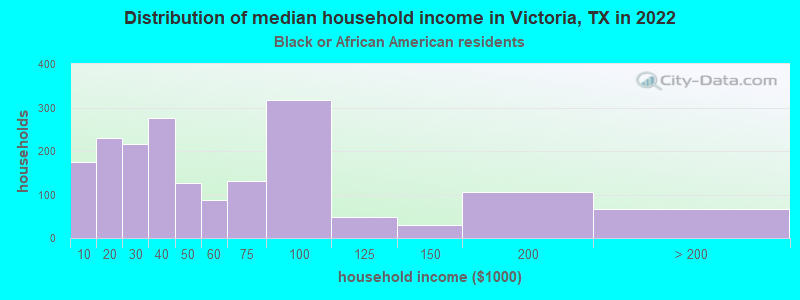
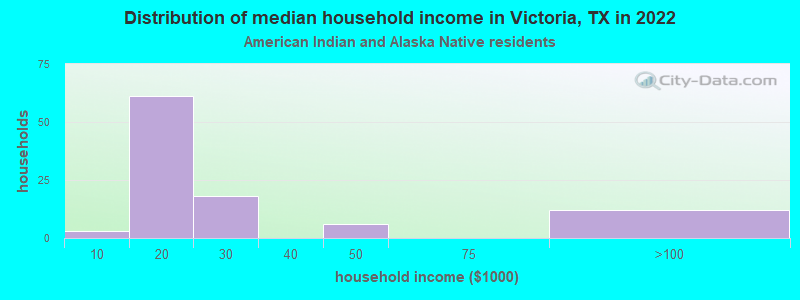
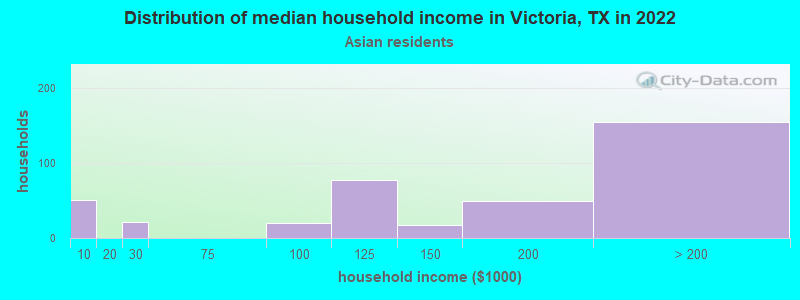
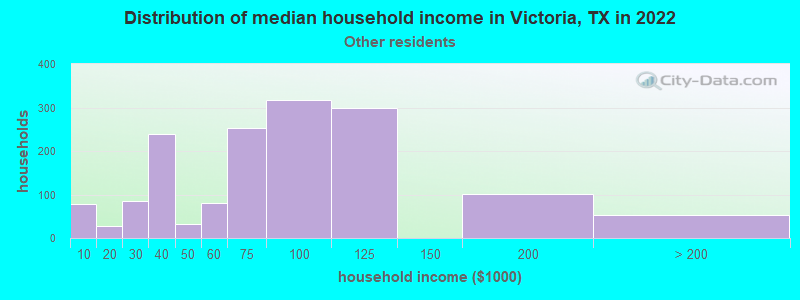
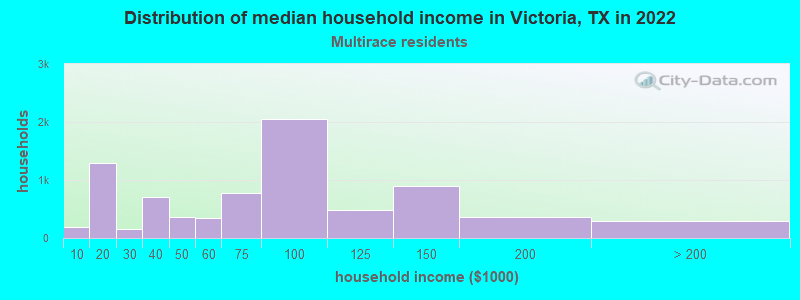
Income and house value in Victoria Median household income in 2022 $61,784 White non-Hispanic householders$35,995 Black householders$153,590 Asian householders$72,434 Some other race householders$78,985 Two or more races householders$78,095 Hispanic or Latino race householdersMedian 2022 house value $233,166 White Non-Hispanic householders$124,447 Black or African American householders$161,698 American Indian or Alaska Native householders $176,599 Asian householders$151,765 Native Hawaiian and other Pacific Islander householders$132,173 Some other race householders$197,294 Two or more races householders$130,242 Hispanic or Latino householders
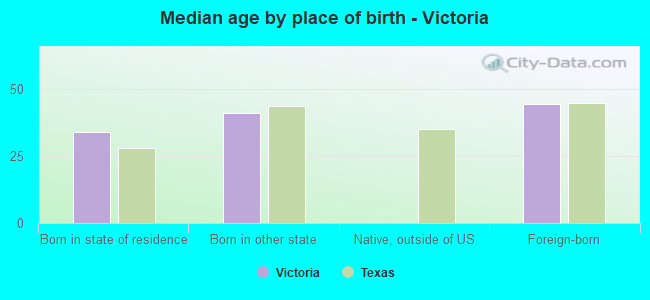
Median age by race in Victoria
39.6 Median age for White residents37.6 41.8 49.0 Median age for Black or African American residents49.1 40.7 -666,666,666.0 Median age for American Indian / Alaska Native residents-666,666,666.0 -666,666,666.0 45.1 Median age for Asian residents38.9 53.9 -666,666,666.0 Median age for Native Hawaiian / Pacific Islander residents-666,666,666.0 -666,666,666.0 40.2 Median age for Other race residents24.9 42.9 31.5 Median age for Two or more races residents30.3 33.6 46.5 Median age for White alone residents40.5 51.4 31.0 Median age for Hispanic or Latino residents26.6 33.3
Owner/renter occupied households by race in Victoria
House owners and renters - White residents 8,108 58.3% Owner occupied5,789 41.7% Renter occupiedHouse owners and renters - Black or African American residents 505 27.7% Owner occupied1,320 72.3% Renter occupiedHouse owners and renters - American Indian / Alaska Native residents 83 83.5% Owner occupied16 16.5% Renter occupiedHouse owners and renters - Asian residents 295 74.9% Owner occupied98 25.1% Renter occupiedHouse owners and renters - Native Hawaiian / Pacific Islander residents 33 100.0% Renter occupiedHouse owners and renters - Other race residents 1,134 79.3% Owner occupied296 20.7% Renter occupiedHouse owners and renters - Two or more races residents 4,199 52.8% Owner occupied3,748 47.2% Renter occupiedHouse owners and renters - White alone residents 6,236 59.0% Owner occupied4,333 41.0% Renter occupiedHouse owners and renters - Hispanic or Latino residents 6,972 56.3% Owner occupied5,405 43.7% Renter occupied
Language usage in Victoria
English speakers - Total 71.8% of residents of Victoria speak English at home.
26.0% of residents speak Spanish at home 12,651 77.6% Speak English very well3,652 22.4% Speak English less than very well2.1% of residents speak other language at home 759 59.0% Speak English very well527 41.0% Speak English less than very well
English speakers - Born in the United States 87.4% of residents of Victoria speak English at home.
10.2% of residents speak Spanish at home 807 89.9% Speak English very well91 10.1% Speak English less than very well2.4% of residents speak other language at home 207 100.0% Speak English very well
English speakers - Native, born elsewhere 47.8% of residents of Victoria speak English at home.
44.8% of residents speak Spanish at home 143 73.7% Speak English very well51 26.3% Speak English less than very well6.7% of residents speak other language at home 29 100.0% Speak English very well
English speakers - Foreign-born 8.7% of residents of Victoria speak English at home.
74.7% of residents speak Spanish at home 1,550 41.0% Speak English very well2,234 59.0% Speak English less than very well15.9% of residents speak other language at home 356 44.1% Speak English very well451 55.9% Speak English less than very well
White (Caucasian) - Speak only English Native:
91.1% (23,366)Foreign-born:
42.2% (1,002)
White (Caucasian) - Speak another language Native:
8.9% (2,272)Foreign-born:
57.8% (1,375)
Black or African American - Speak only English Native:
99.7% (4,123)Foreign-born:
31.2% (40)
Black or African American - Speak another language Native:
0.3% (12)Foreign-born:
69.0% (89)
Asian - Speak only English Native:
19.8% (91)Foreign-born:
10.5% (82)
Asian - Speak another language Native:
79.5% (363)Foreign-born:
89.4% (694)
Other race - Speak only English Native:
57.1% (2,761)Foreign-born:
1.4% (9)
Other race - Speak another language Native:
42.8% (2,067)Foreign-born:
100.0% (631)
Two or more races - Speak only English Native:
74.0% (16,164)Foreign-born:
12.4% (209)
Two or more races - Speak another language Native:
26.0% (5,684)Foreign-born:
87.6% (1,475)
White alone - Speak only English Native:
98.4% (19,766)Foreign-born:
29.6% (145)
White alone - Speak another language Native:
1.5% (300)Foreign-born:
10.2% (50)
Hispanic or Latino - Speak only English Native:
70.2% (21,331)Foreign-born:
19.5% (737)
Hispanic or Latino - Speak another language Native:
29.8% (9,053)Foreign-born:
80.5% (3,047)
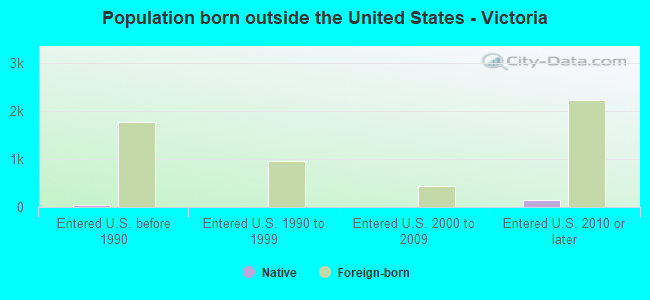
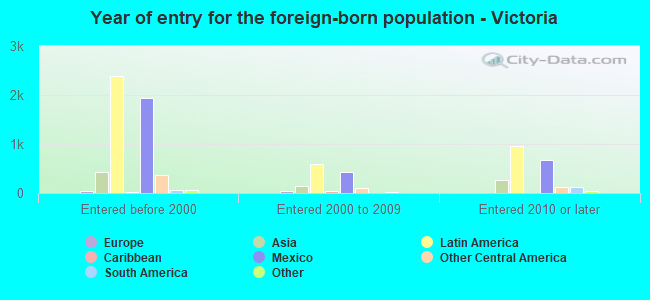
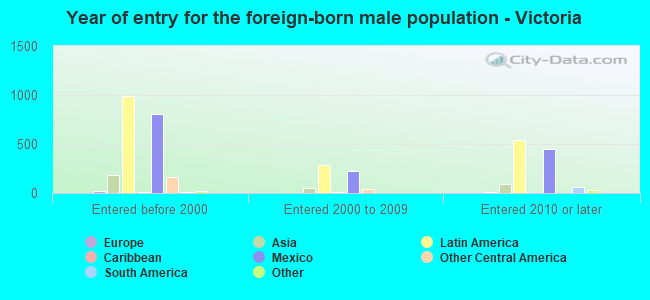
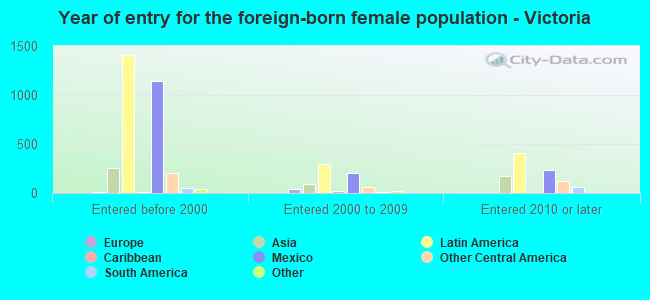
Foreign-born residents in Victoria 5,066 residents are foreign born (5.9% Latin America , 1.2% Asia ).
This city:
7.7%Texas:
17.1%
Marital status for residents in Victoria Marital status - White (Caucasian) population 15 years and over
Males 31.5% Never married56.3% Now married1.1% Separated2.4% Widowed8.7% DivorcedFemales 18.2% Never married56.4% Now married0.9% Separated11.3% Widowed13.2% DivorcedWomen who gave birth in the past 12 months Now married:
100.0% (790)Unmarried:
0.0% (0)
Women who did not give birth in the past 12 months Now married:
52.2% (3,226)Unmarried:
47.8% (2,954)
Marital status - Black or African American population 15 years and over
Males 44.2% Never married21.6% Now married1.8% Separated7.9% Widowed24.5% DivorcedFemales 54.5% Never married18.2% Now married1.8% Separated13.6% Widowed11.9% DivorcedWomen who gave birth in the past 12 months Now married:
17.9% (15)Unmarried:
82.1% (70)
Women who did not give birth in the past 12 months Now married:
7.8% (90)Unmarried:
92.2% (1,066)
Marital status - American Indian / Alaska Native population 15 years and over
Males 32.6% Never married3.7% Now married32.6% Separated0.0% Widowed31.1% DivorcedFemales 61.6% Never married26.0% Now married0.0% Separated0.0% Widowed12.3% DivorcedWomen who did not give birth in the past 12 months Now married:
0.0% (0)Unmarried:
100.0% (77)
Marital status - Asian population 15 years and over
Males 36.1% Never married58.6% Now married0.0% Separated0.0% Widowed5.3% DivorcedFemales 26.5% Never married51.2% Now married5.5% Separated16.8% Widowed0.0% DivorcedWomen who gave birth in the past 12 months Now married:
100.0% (19)Unmarried:
0.0% (0)
Women who did not give birth in the past 12 months Now married:
59.8% (240)Unmarried:
40.2% (161)
Marital status - Native Hawaiian / Pacific Islander population 15 years and over
Males 42.3% Never married57.7% Now married0.0% Separated0.0% Widowed0.0% DivorcedFemales 100.0% Never married0.0% Now married0.0% Separated0.0% Widowed0.0% DivorcedWomen who gave birth in the past 12 months Now married:
0.0% (0)Unmarried:
100.0% (16)
Marital status - Other race population 15 years and over
Males 35.8% Never married43.6% Now married3.7% Separated0.5% Widowed16.4% DivorcedFemales 30.5% Never married42.8% Now married6.0% Separated8.8% Widowed12.0% DivorcedWomen who gave birth in the past 12 months Now married:
0.0% (0)Unmarried:
100.0% (33)
Women who did not give birth in the past 12 months Now married:
45.6% (625)Unmarried:
54.4% (744)
Marital status - Two or more races population 15 years and over
Males 55.7% Never married36.3% Now married1.5% Separated2.5% Widowed4.0% DivorcedFemales 47.5% Never married37.0% Now married2.2% Separated6.3% Widowed6.9% DivorcedWomen who gave birth in the past 12 months Now married:
49.2% (153)Unmarried:
50.8% (158)
Women who did not give birth in the past 12 months Now married:
33.7% (1,962)Unmarried:
66.3% (3,865)
Marital status - White alone, not Hispanic / Latino population 15 years and over
Males 30.6% Never married54.9% Now married1.5% Separated3.2% Widowed9.8% DivorcedFemales 16.3% Never married53.0% Now married1.0% Separated14.4% Widowed15.5% DivorcedWomen who gave birth in the past 12 months Now married:
100.0% (253)Unmarried:
0.0% (0)
Women who did not give birth in the past 12 months Now married:
48.2% (1,843)Unmarried:
51.8% (1,979)
Marital status - Hispanic or Latino population 15 years and over
Males 52.5% Never married39.8% Now married1.0% Separated1.7% Widowed5.0% DivorcedFemales 38.8% Never married44.9% Now married1.6% Separated5.7% Widowed9.1% DivorcedWomen who gave birth in the past 12 months Now married:
81.4% (690)Unmarried:
18.6% (158)
Women who did not give birth in the past 12 months Now married:
41.4% (3,787)Unmarried:
58.6% (5,370)
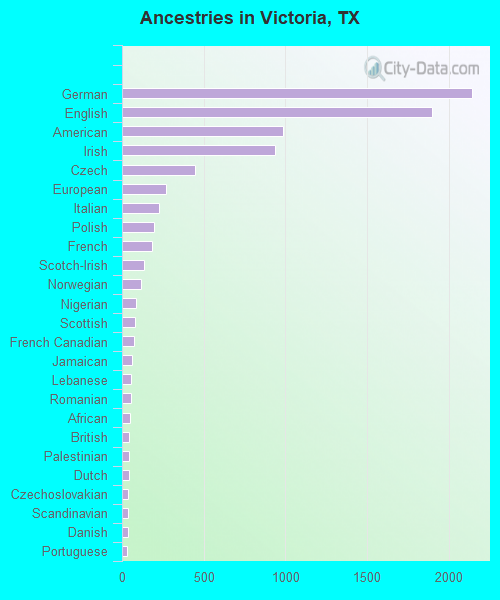
Ancestries in Victoria
2,140 5.4% German1,896 4.7% English985 2.5% American937 2.3% Irish450 1.1% Czech270 0.7% European226 0.6% Italian193 0.5% Polish185 0.5% French135 0.3% Scotch-Irish114 0.3% Norwegian87 0.2% Nigerian82 0.2% Scottish71 0.2% French Canadian60 0.2% Jamaican55 0.1% Lebanese53 0.1% Romanian49 0.1% African45 0.1% British43 0.1% Palestinian40 0.1% Dutch37 0.09% Czechoslovakian36 0.09% Scandinavian35 0.09% Danish33 0.08% Portuguese31 0.08% Greek30 0.08% Syrian27 0.07% Slovak24 0.06% Turkish24 0.06% Ukrainian19 0.05% Slovene17 0.04% Iranian14 0.04% Hungarian12 0.03% Belgian11 0.03% Swiss10 0.03% Eastern European9 0.02% Welsh6 0.02% Sudanese5 0.01% Northern European5 0.01% Swedish
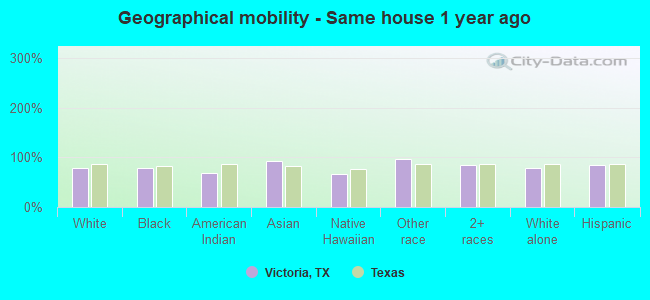
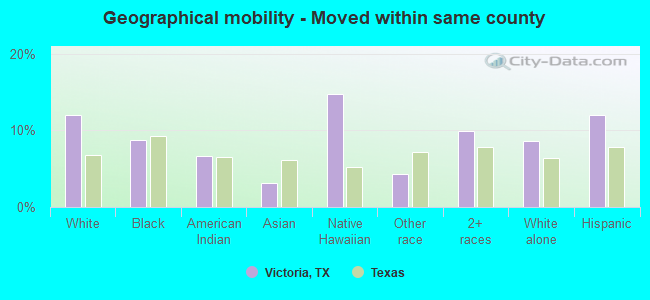
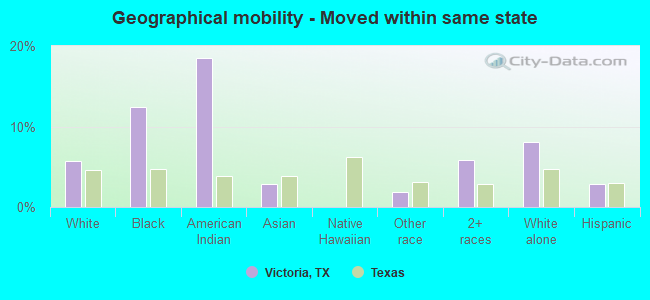
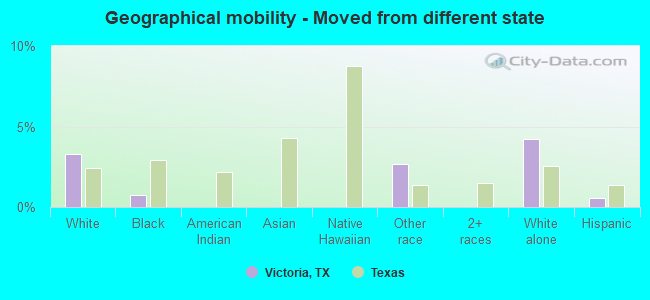
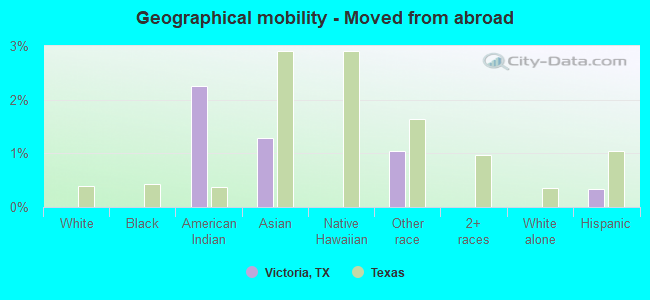
Geographical mobility in Victoria Same house 1 year ago 23,416 79.0% White (Caucasian)3,394 77.9% Black or African American207 68.1% American Indian / Alaska Native1,157 91.9% Asian33 65.5% Native Hawaiian / Pacific Islander5,380 97.0% Other race21,187 84.2% Two or more races16,589 79.0% White alone, not Hispanic / Latino30,810 83.7% Hispanic or LatinoMoved within same county 3,554 12.0% White / Caucasian381 8.7% Black or African American20 6.7% American Indian / Alaska Native40 3.2% Asian7 14.8% Native Hawaiian / Pacific Islander237 4.3% Other race2,504 10.0% Two or more races1,817 8.7% White alone, not Hispanic / Latino4,421 12.0% Hispanic or LatinoMoved within same state 1,700 5.7% White / Caucasian543 12.5% Black or African American56 18.5% American Indian / Alaska Native37 2.9% Asian102 1.8% Other race1,473 5.9% Two or more races1,700 8.1% White alone, not Hispanic / Latino1,038 2.8% Hispanic or LatinoMoved from different state 974 3.3% White / Caucasian33 0.7% Black or African American147 2.7% Other race885 4.2% White alone, not Hispanic / Latino205 0.6% Hispanic or LatinoMoved from abroad 7 2.3% American Indian / Alaska Native16 1.3% Asian58 1.0% Other race123 0.3% Hispanic or Latino
Children Nativity (place of birth) in Victoria
Children under 6 years - Living with two parents Both parents native 2,213 100.0% NativeBoth parents foreign-born 283 100.0% NativeOne native, one foreign-born parent 149 100.0% NativeChildren under 6 years - Living with one parent Native parent 2,162 100.0% NativeForeign-born parent 86 100.0% NativeChildren 6 to 17 years - Living with two parents Both parents native 4,909 100.0% Native0 0.0% Foreign-bornBoth parents foreign-born 656 92.0% Native57 8.0% Foreign-bornOne native, one foreign-born parent 885 100.0% NativeChildren 6 to 17 years - Living with one parent Native parent 3,418 100.0% NativeForeign-born parent 409 50.5% Native401 49.5% Foreign-born
Grandparents responsible for own grandchildren in Victoria
Grandparents (30 to 59 years) White / Caucasian 132 64.8% Responsible for grandchildren72 35.2% Not responsible for grandchildrenBlack or African American 9 47.2% Responsible for grandchildren10 52.8% Not responsible for grandchildrenOther race 48 100.0% Not responsible for grandchildrenTwo or more races 87 28.8% Responsible for grandchildren215 71.2% Not responsible for grandchildrenWhite alone, not Hispanic / Latino 24 40.2% Responsible for grandchildren36 59.8% Not responsible for grandchildrenHispanic or Latino 210 47.0% Responsible for grandchildren237 53.0% Not responsible for grandchildrenGrandparents (60 years and over) White / Caucasian 100 38.4% Responsible for grandchildren161 61.6% Not responsible for grandchildrenBlack or African American 7 100.0% Not responsible for grandchildrenOther race 81 100.0% Not responsible for grandchildrenTwo or more races 49 32.8% Responsible for grandchildren100 67.2% Not responsible for grandchildrenWhite alone, not Hispanic / Latino 16 10.4% Responsible for grandchildren141 89.6% Not responsible for grandchildrenHispanic or Latino 134 39.5% Responsible for grandchildren206 60.5% Not responsible for grandchildren