Races in Villas, Florida (FL) Detailed Stats
Ancestries, Foreign-born residents, place of birth
Settings
X


Recent posts about races in Villas, Florida on our local forum with over 2,400,000 registered users:
 | Where to live that would be an easy drive to Page Field? (12 replies) |
| Looking for 2/2 anywhere in FL...where is the best place to live? (6 replies) |
| condo advice please (3 replies) |
| Hmmm....on a budget....where to live Fort Myers/Cape Coral? (30 replies) |
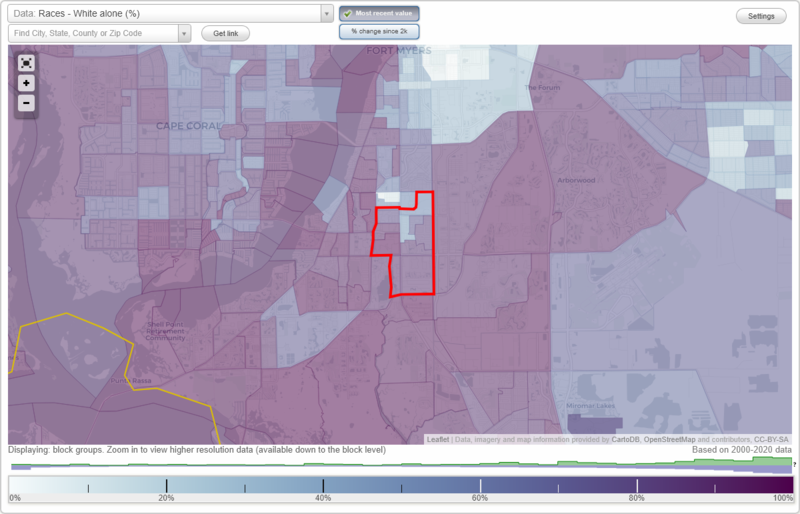
According to 2022 data, the most numerous races in Villas, FL are White alone (10,353 residents), Hispanic (2,543 residents), and Black alone (802 residents). 78.4% of Villas residents speak English at home. 19.0% of Villas, FL residents are foreign-born (12.4% born in Latin America, 4.6% born in Europe), which is 10.5% less than the foreign-born rate of 21.0% across the entire state of Florida.
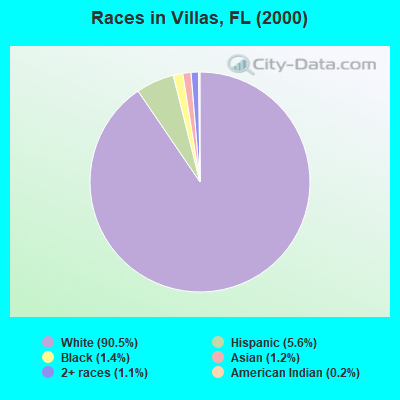
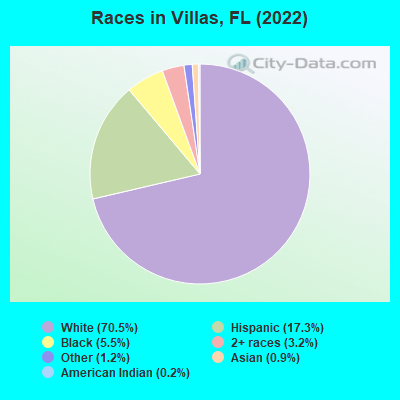
Race distribution in Villas
2000
2022

- 10,26690.5%White alone
- 6345.6%Hispanic
- 1611.4%Black alone
- 1331.2%Asian alone
- 1251.1%Two or more races
- 180.2%American Indian alone
- 40.04%Other race alone
- 50.04%Native Hawaiian and Other
Pacific Islander alone
-
- 10,35370.5%White alone
- 2,54317.3%Hispanic
- 8025.5%Black alone
- 4703.2%Two or more races
- 1831.2%Other race alone
- 1360.9%Asian alone
- 320.2%American Indian alone
2000
2022
-
- 10,458,50965.4%White alone
- 2,682,71516.8%Hispanic
- 2,264,26814.2%Black alone
- 261,6931.6%Asian alone
- 236,9541.5%Two or more races
- 42,3580.3%American Indian alone
- 28,9940.2%Other race alone
- 6,8870.04%Native Hawaiian and Other
Pacific Islander alone

-
- 11,309,40350.8%White alone
- 6,025,03927.1%Hispanic
- 3,241,01514.6%Black alone
- 861,6303.9%Two or more races
- 623,6922.8%Asian alone
- 152,0540.7%Other race alone
- 22,5040.1%American Indian alone
- 9,4860.04%Native Hawaiian and Other
Pacific Islander alone

Income and house value in Villas
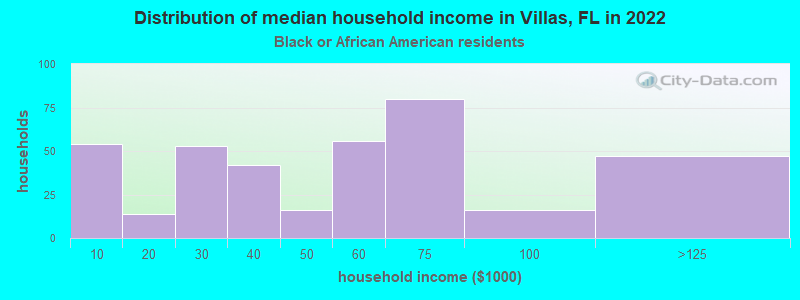
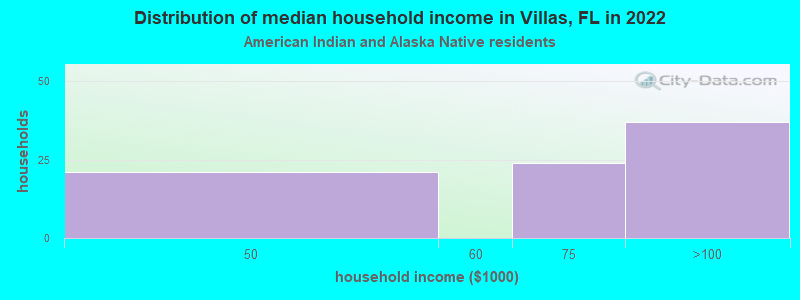
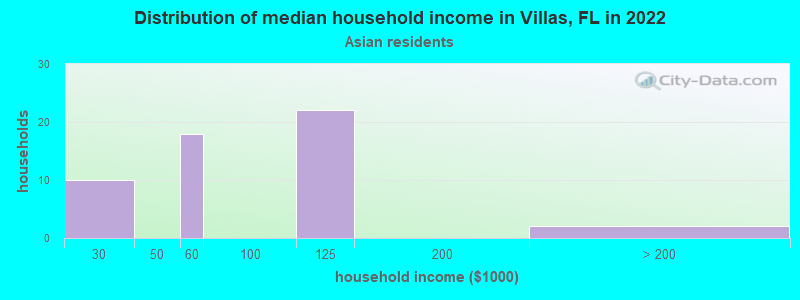
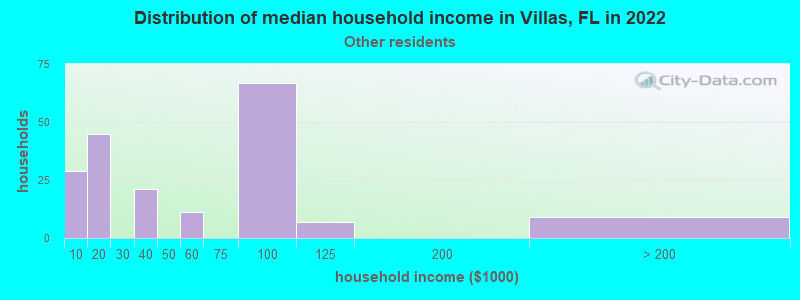
- Median household income in 2022
- $54,464White non-Hispanic householders
- $54,935Black householders
- $46,968American Indian and Alaska Native householders
- $106,075Asian householders
- $72,969Two or more races householders
- $62,060Hispanic or Latino race householders
- Median 2022 house value
- $295,260White Non-Hispanic householders
- $367,643Asian householders
- $319,086Some other race householders
- $392,072Two or more races householders
- $257,561Hispanic or Latino householders
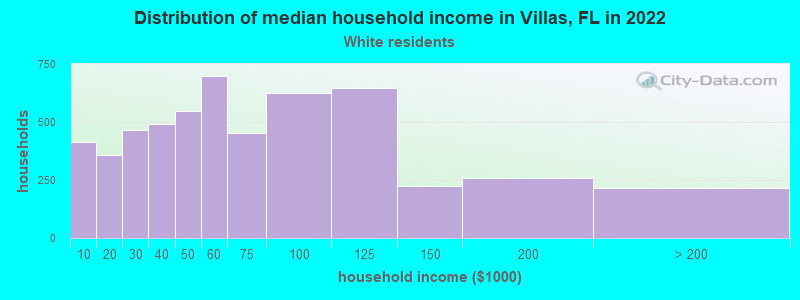
Household income for White non-Hispanic householders
Household income for Black householders
Household income for American Indian and Alaska Native householders
Household income for Asian householders
Household income for Some other race householders
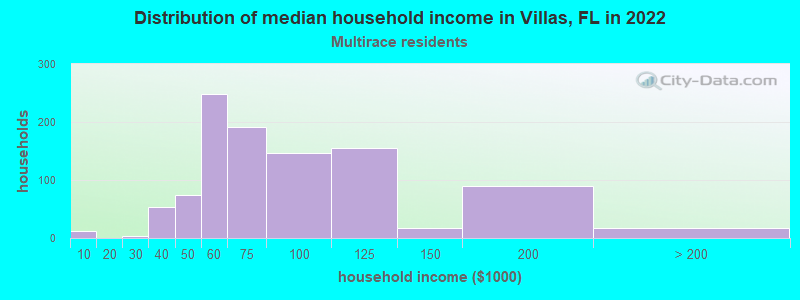
Household income for Two or more races householders
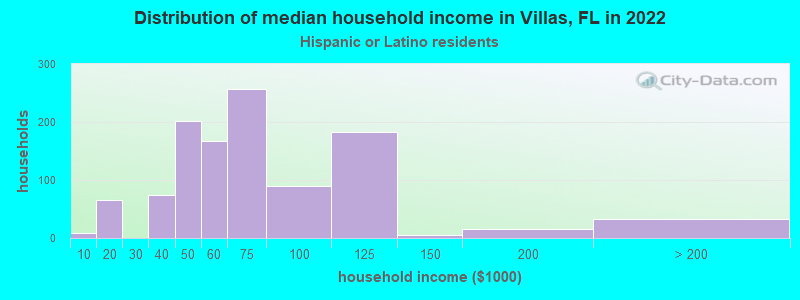
Household income for Hispanic or Latino race householders
Median age by race in Villas
- 59.3Median age for White residents
- 54.4Males
- 59.1Females
- 40.6Median age for Black or African American residents
- 31.9Males
- 60.5Females
- 25.3Median age for American Indian / Alaska Native residents
- 25.1Males
- -402,449,693.4Females
- 50.1Median age for Asian residents
- 53.0Males
- 49.7Females
- -1,092,290,987.0Median age for Native Hawaiian / Pacific Islander residents
- -858,307,848.3Males
- -800,880,087.2Females
- 24.2Median age for Other race residents
- 22.4Males
- 23.6Females
- 41.4Median age for Two or more races residents
- 42.0Males
- 40.5Females
- 58.0Median age for White alone residents
- 55.3Males
- 60.3Females
- 37.4Median age for Hispanic or Latino residents
- 37.7Males
- 37.0Females
Owner/renter occupied households by race in Villas
- House owners and renters - White residents
- 3,66367.9%Owner occupied
- 1,73432.1%Renter occupied
- House owners and renters - Black or African American residents
- 5915.0%Owner occupied
- 33385.0%Renter occupied
- House owners and renters - American Indian / Alaska Native residents
- 4255.9%Owner occupied
- 3344.1%Renter occupied
- House owners and renters - Asian residents
- 3159.3%Owner occupied
- 2240.7%Renter occupied
- House owners and renters - Other race residents
- 20286.1%Owner occupied
- 3213.9%Renter occupied
- House owners and renters - Two or more races residents
- 37137.6%Owner occupied
- 61562.4%Renter occupied
- House owners and renters - White alone residents
- 3,66368.8%Owner occupied
- 1,66331.2%Renter occupied
- House owners and renters - Hispanic or Latino residents
- 45142.2%Owner occupied
- 61857.8%Renter occupied
Language usage in Villas
- English speakers - Total
- 78.4% of residents of Villas speak English at home.
- 13.5% of residents speak Spanish at home
- 1,40472.6%Speak English very well
- 52927.4%Speak English less than very well
- 7.4% of residents speak other language at home
- 62659.1%Speak English very well
- 43340.9%Speak English less than very well
- English speakers - Born in the United States
- 96.1% of residents of Villas speak English at home.
- 1.7% of residents speak Spanish at home
- 12992.1%Speak English very well
- 117.9%Speak English less than very well
- 2.0% of residents speak other language at home
- 167100.0%Speak English very well
- English speakers - Native, born elsewhere
- 31.4% of residents of Villas speak English at home.
- 70.1% of residents speak Spanish at home
- 239100.0%Speak English very well
- English speakers - Foreign-born
- 40.3% of residents of Villas speak English at home.
- 30.3% of residents speak Spanish at home
- 47651.6%Speak English very well
- 44748.4%Speak English less than very well
- 28.6% of residents speak other language at home
- 41547.6%Speak English very well
- 45652.4%Speak English less than very well
White (Caucasian) - Speak only English
| Native: | 98.9% (8,675) |
| Foreign-born: | 74.0% (797) |
White (Caucasian) - Speak another language
| Native: | 2.4% (212) |
| Foreign-born: | 39.9% (430) |
Black or African American - Speak only English
| Native: | 94.4% (585) |
| Foreign-born: | 100.0% (144) |
American Indian / Alaska Native - Speak only English
| Native: | 57.7% (36) |
| Foreign-born: | 61.4% (6) |
Asian - Speak another language
| Native: | 58.5% (11) |
| Foreign-born: | 94.0% (112) |
Other race - Speak only English
| Native: | 5.5% (14) |
| Foreign-born: | 14.1% (56) |
Other race - Speak another language
| Native: | 100.0% (259) |
| Foreign-born: | 85.9% (341) |
Two or more races - Speak only English
| Native: | 45.6% (735) |
| Foreign-born: | 9.5% (60) |
Two or more races - Speak another language
| Native: | 54.5% (879) |
| Foreign-born: | 90.5% (574) |
White alone - Speak only English
| Native: | 99.0% (8,651) |
| Foreign-born: | 59.0% (747) |
White alone - Speak another language
| Native: | 1.1% (93) |
| Foreign-born: | 41.3% (522) |
Hispanic or Latino - Speak only English
| Native: | 31.7% (447) |
| Foreign-born: | 19.6% (205) |
Hispanic or Latino - Speak another language
| Native: | 68.7% (970) |
| Foreign-born: | 79.0% (823) |
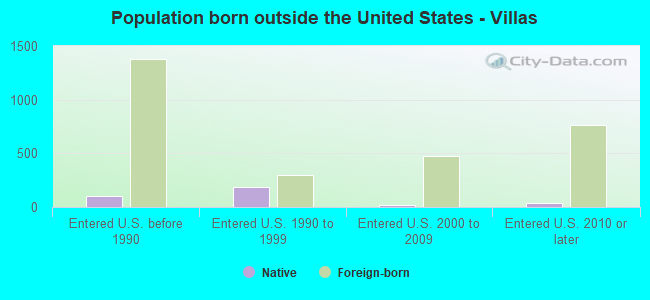
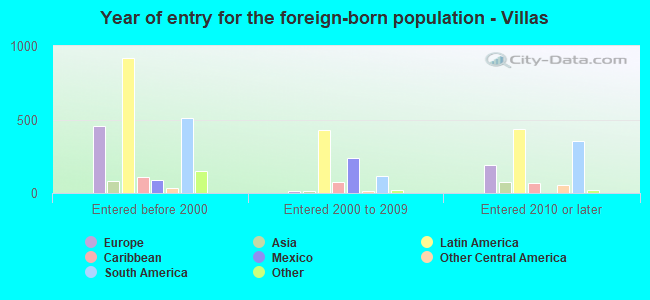
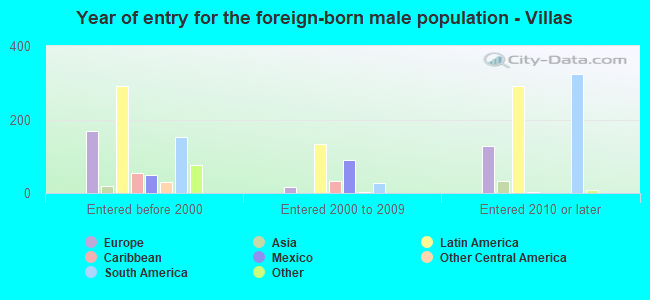
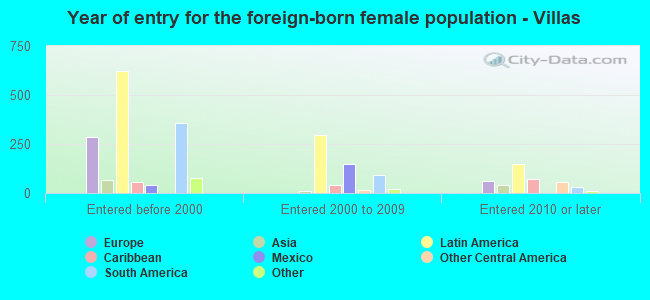
Foreign-born residents in Villas
2,790 residents are foreign born (12.4% Latin America, 4.6% Europe).
| This city: | 19.0% |
| Florida: | 21.1% |
Marital status for residents in Villas
Marital status - White (Caucasian) population 15 years and over
- Males
- 32.1%Never married
- 42.9%Now married
- 0.9%Separated
- 6.3%Widowed
- 17.7%Divorced
- Females
- 21.7%Never married
- 34.8%Now married
- 8.3%Separated
- 15.9%Widowed
- 19.2%Divorced
Women who did not give birth in the past 12 months
| Now married: | 30.8% (471) |
| Unmarried: | 69.2% (1,059) |
Marital status - Black or African American population 15 years and over
- Males
- 76.5%Never married
- 15.3%Now married
- 0.0%Separated
- 2.3%Widowed
- 6.0%Divorced
- Females
- 39.0%Never married
- 19.0%Now married
- 4.3%Separated
- 18.4%Widowed
- 19.3%Divorced
Women who did not give birth in the past 12 months
| Now married: | 22.1% (28) |
| Unmarried: | 77.9% (99) |
Marital status - Asian population 15 years and over
- Males
- 0.0%Never married
- 100.0%Now married
- 0.0%Separated
- 0.0%Widowed
- 0.0%Divorced
- Females
- 20.5%Never married
- 49.3%Now married
- 0.0%Separated
- 0.0%Widowed
- 30.1%Divorced
Women who did not give birth in the past 12 months
| Now married: | 37.5% (10) |
| Unmarried: | 62.5% (17) |
Marital status - Other race population 15 years and over
- Males
- 62.5%Never married
- 11.9%Now married
- 5.4%Separated
- 0.0%Widowed
- 20.3%Divorced
- Females
- 44.6%Never married
- 15.4%Now married
- 0.0%Separated
- 24.3%Widowed
- 15.7%Divorced
Women who did not give birth in the past 12 months
| Now married: | 17.1% (38) |
| Unmarried: | 82.9% (186) |
Marital status - Two or more races population 15 years and over
- Males
- 38.6%Never married
- 55.0%Now married
- 0.0%Separated
- 0.0%Widowed
- 6.5%Divorced
- Females
- 27.7%Never married
- 50.3%Now married
- 0.0%Separated
- 1.3%Widowed
- 20.6%Divorced
Women who did not give birth in the past 12 months
| Now married: | 46.2% (372) |
| Unmarried: | 53.8% (435) |
Marital status - White alone, not Hispanic / Latino population 15 years and over
- Males
- 31.6%Never married
- 43.7%Now married
- 1.0%Separated
- 6.7%Widowed
- 17.0%Divorced
- Females
- 20.0%Never married
- 35.6%Now married
- 9.0%Separated
- 17.2%Widowed
- 18.3%Divorced
Women who did not give birth in the past 12 months
| Now married: | 30.6% (422) |
| Unmarried: | 69.4% (959) |
Marital status - Hispanic or Latino population 15 years and over
- Males
- 41.1%Never married
- 43.1%Now married
- 1.7%Separated
- 0.0%Widowed
- 14.1%Divorced
- Females
- 35.6%Never married
- 34.7%Now married
- 0.0%Separated
- 8.1%Widowed
- 21.6%Divorced
Women who did not give birth in the past 12 months
| Now married: | 36.9% (343) |
| Unmarried: | 63.1% (586) |
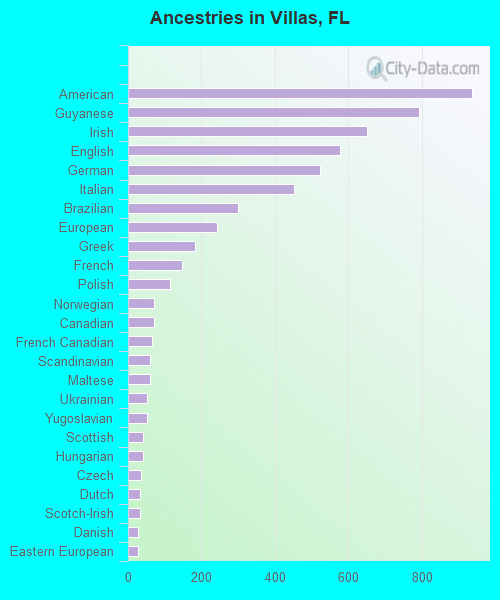
Ancestries in Villas

- 93611.3%American
- 7939.6%Guyanese
- 6527.9%Irish
- 5777.0%English
- 5236.3%German
- 4525.4%Italian
- 3003.6%Brazilian
- 2422.9%European
- 1822.2%Greek
- 1481.8%French
- 1141.4%Polish
- 720.9%Norwegian
- 700.8%Canadian
- 650.8%French Canadian
- 600.7%Scandinavian
- 600.7%Maltese
- 530.6%Ukrainian
- 520.6%Yugoslavian
- 410.5%Scottish
- 400.5%Hungarian
- 350.4%Czech
- 330.4%Dutch
- 320.4%Scotch-Irish
- 280.3%Danish
- 270.3%Eastern European
- 160.2%Palestinian
- 160.2%Haitian
- 150.2%Swiss
- 110.1%Austrian
- 100.1%Romanian
- 90.1%British
- 60.07%Portuguese
- 60.07%Welsh
- 50.06%Russian
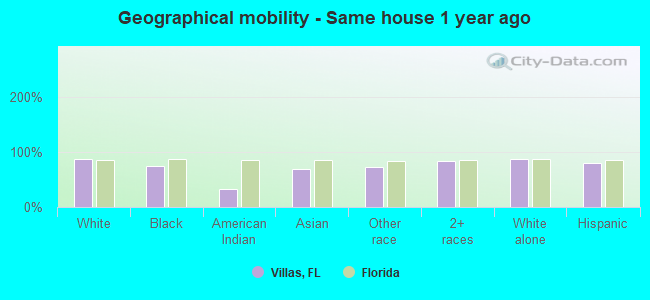
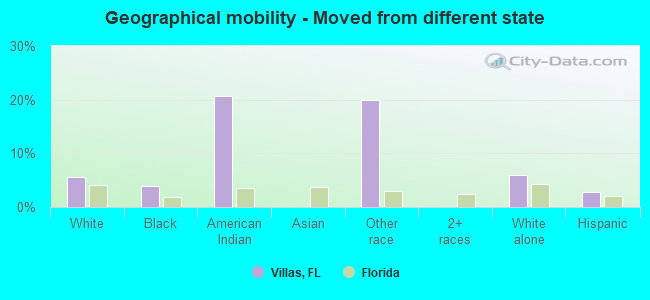
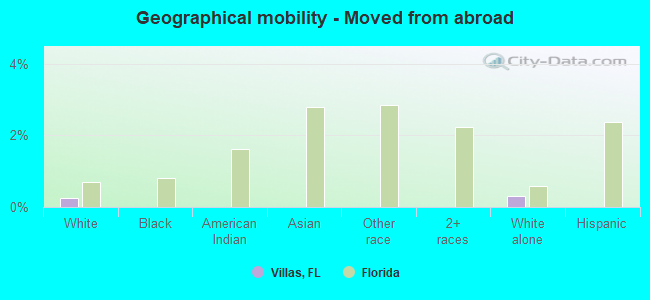
Geographical mobility in Villas

- Same house 1 year ago
- 9,10087.7%White (Caucasian)
- 60074.6%Black or African American
- 2733.1%American Indian / Alaska Native
- 9669.5%Asian
- 49373.0%Other race
- 1,91683.9%Two or more races
- 9,03687.3%White alone, not Hispanic / Latino
- 2,04680.8%Hispanic or Latino
-
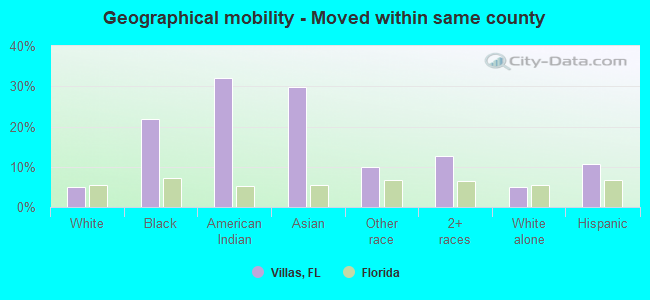
- Moved within same county
- 5245.1%White / Caucasian
- 17621.8%Black or African American
- 2632.1%American Indian / Alaska Native
- 4129.9%Asian
- 6710.0%Other race
- 29212.8%Two or more races
- 5175.0%White alone, not Hispanic / Latino
- 27110.7%Hispanic or Latino
-
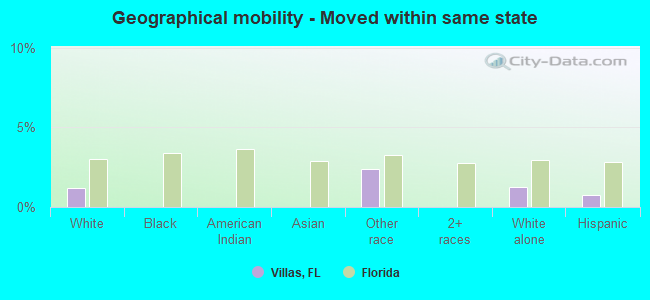
- Moved within same state
- 1241.2%White / Caucasian
- 162.4%Other race
- 1281.2%White alone, not Hispanic / Latino
- 190.7%Hispanic or Latino
-
- Moved from different state
- 5765.6%White / Caucasian
- 323.9%Black or African American
- 1720.7%American Indian / Alaska Native
- 13520.0%Other race
- 6135.9%White alone, not Hispanic / Latino
- 712.8%Hispanic or Latino
-
- Moved from abroad
- 250.2%White
- 310.3%White alone, not Hispanic / Latino
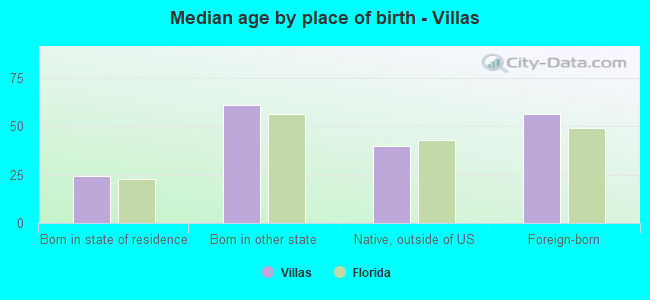
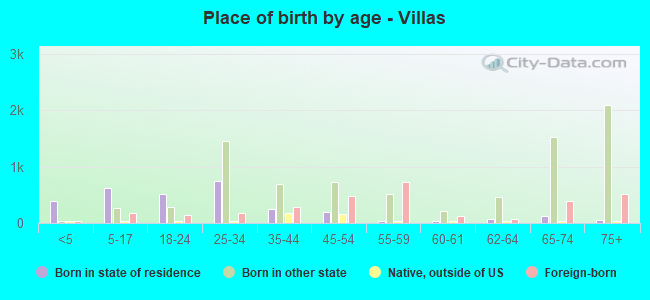
Children Nativity (place of birth) in Villas
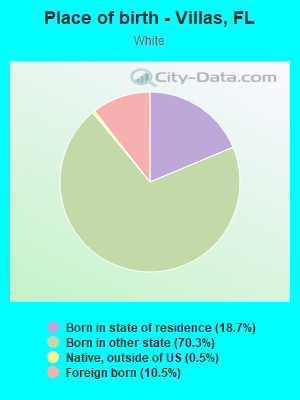
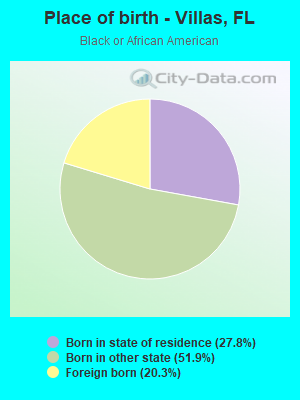
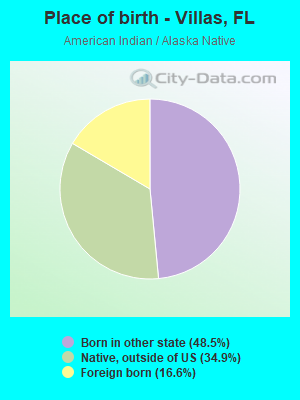
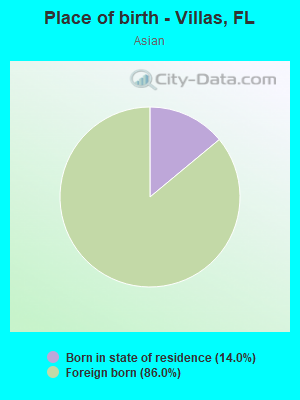
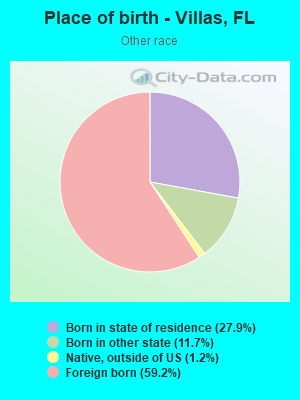
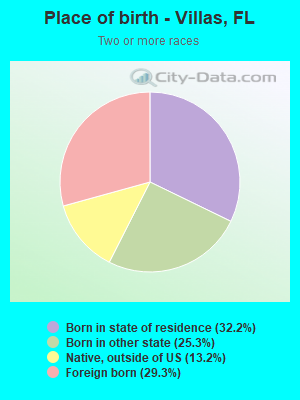
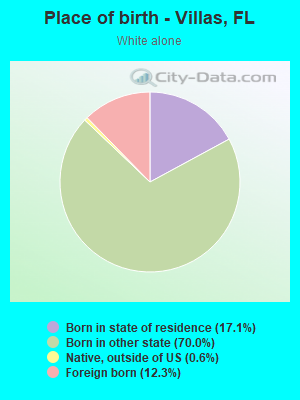
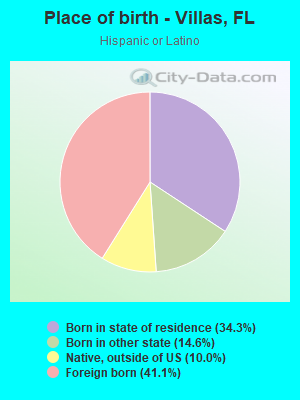
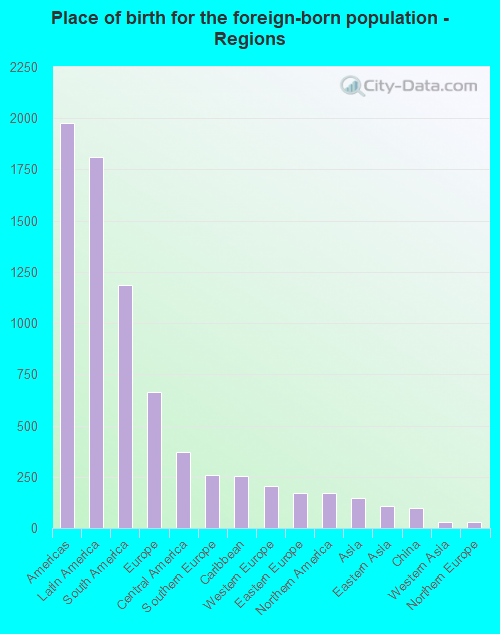
Place of birth for residents in Villas
![Place of birth for the foreign-born population - Regions]()
- 1,979Americas
- 1,809Latin America
- 1,184South America
- 664Europe
- 370Central America
- 258Southern Europe
- 253Caribbean
- 206Western Europe
- 172Eastern Europe
- 170Northern America
- 146Asia
- 106Eastern Asia
- 97China
- 28Western Asia
- 27Northern Europe
- 11South Eastern Asia
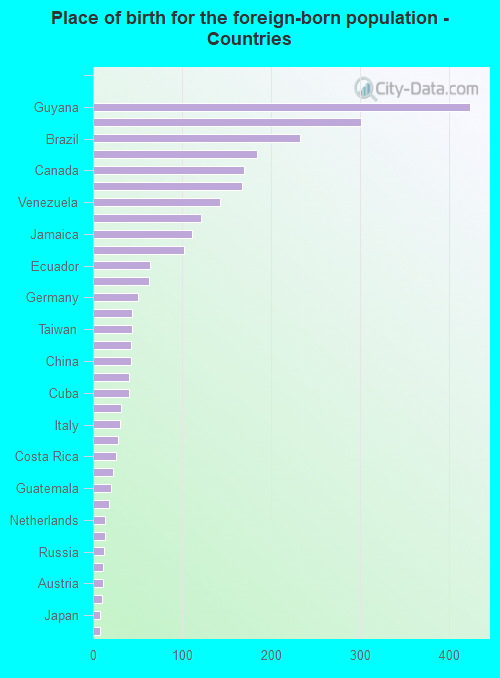
![Place of birth for the foreign-born population - Countries]()
- 424Guyana
- 301Mexico
- 233Brazil
- 184Colombia
- 170Canada
- 168Greece
- 143Venezuela
- 121Argentina
- 111Jamaica
- 102Dominican Republic
- 64Ecuador
- 63France
- 51Germany
- 44Czechoslovakia
- 44Taiwan
- 43Ukraine
- 43China
- 40Hungary
- 40Cuba
- 32Bosnia and Herzegovina
- 30Italy
- 28Turkey
- 26Costa Rica
- 23El Salvador
- 20Guatemala
- 18England
- 14Netherlands
- 13Peru
- 12Russia
- 11Philippines
- 11Austria
- 10Hong Kong
- 8Japan
- 8United Kingdom
Grandparents responsible for own grandchildren in Villas
Zip codes: 33907.