Races in Wales, Maine (ME) Detailed Stats
Ancestries, Foreign-born residents, place of birth
1.5% of Wales, ME residents are foreign-born , which is 98.3% less than the foreign-born rate of 3.0% across the entire state of Maine.
Race distribution in Wales

- 1,28397.0%White alone
- 120.9%Asian alone
- 110.8%Two or more races
- 90.7%Black alone
- 60.5%American Indian alone
- 10.08%Other race alone

2000
2022
-
- 1,230,29796.5%White alone
- 11,7310.9%Two or more races
- 9,3600.7%Hispanic
- 9,0140.7%Asian alone
- 6,4400.5%Black alone
- 6,9110.5%American Indian alone
- 8360.07%Other race alone
- 3340.03%Native Hawaiian and Other
Pacific Islander alone

-
- 1,249,23390.2%White alone
- 58,3574.2%Two or more races
- 28,7172.1%Hispanic
- 21,5831.6%Black alone
- 16,1511.2%Asian alone
- 5,8730.4%Other race alone
- 5,2050.4%American Indian alone
- 2210.02%Native Hawaiian and Other
Pacific Islander alone

Income and house value in Wales
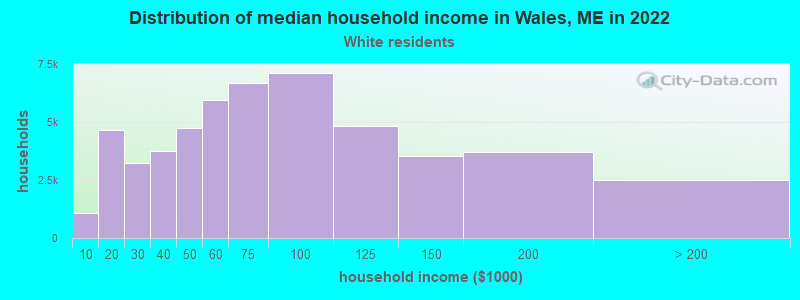
- Median household income in 2022
- $81,595White non-Hispanic householders
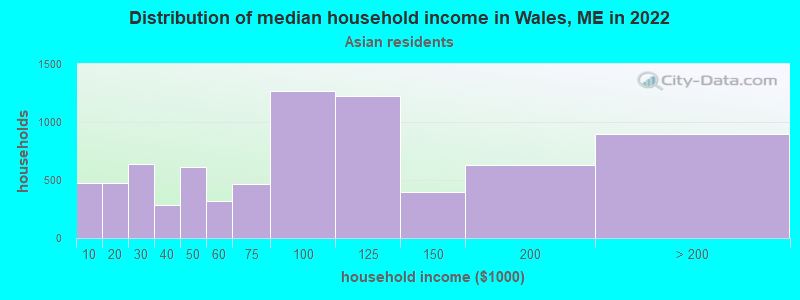
- $45,194Asian householders
- Median 2022 house value
- $283,771White Non-Hispanic householders
- $447,111Asian householders
Household income for White non-Hispanic householders
Household income for Asian householders
Foreign-born residents in Wales
20 residents are foreign born
| This city: | 1.5% |
| Maine: | 2.9% |
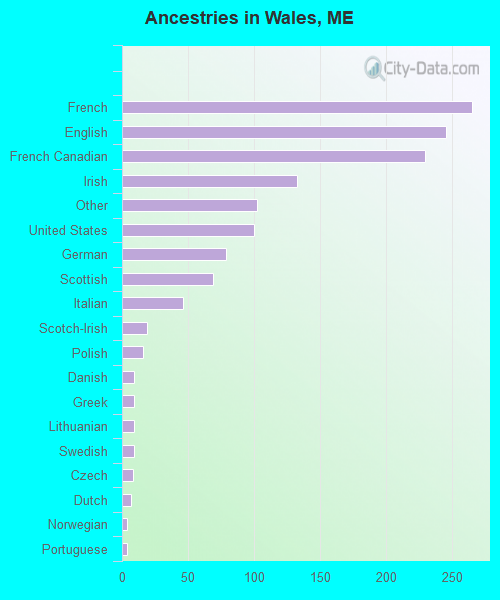
Ancestries in Wales

- 26519.4%French
- 24618.0%English
- 23016.8%French Canadian
- 1339.7%Irish
- 1027.5%Other
- 1007.3%United States
- 795.8%German
- 695.1%Scottish
- 463.4%Italian
- 191.4%Scotch-Irish
- 161.2%Polish
- 90.7%Danish
- 90.7%Greek
- 90.7%Lithuanian
- 90.7%Swedish
- 80.6%Czech
- 70.5%Dutch
- 40.3%Norwegian
- 40.3%Portuguese
- 20.1%Slovak
Zip codes: 04280.