Races in Watertown, New York (NY) Detailed Stats
Data:
Races - White alone (%)
Races - White alone (% change since 2000)
Races - Black alone (%)
Races - Black alone (% change since 2000)
Races - American Indian alone (%)
Races - American Indian alone (% change since 2000)
Races - Asian alone (%)
Races - Asian alone (% change since 2000)
Races - Hispanic (%)
Races - Hispanic (% change since 2000)
Races - Native Hawaiian and Other Pacific Islander alone (%)
Races - Native Hawaiian and Other Pacific Islander alone (% change since 2000)
Races - Two or more races(%)
Races - Two or more races(% change since 2000)
Races - Other race alone (%)
Races - Other race alone (% change since 2000)
Racial diversity
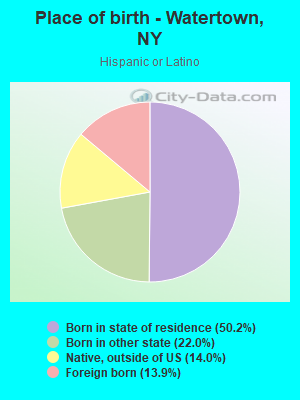
Place of birth - Born in state of residence (%)
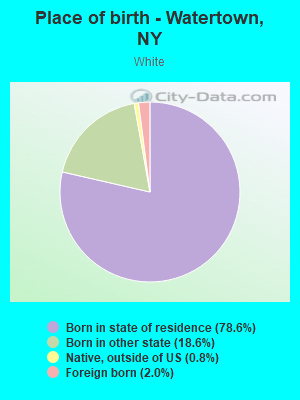
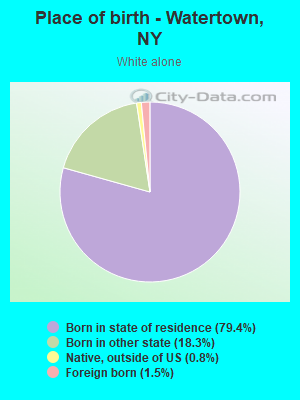
Place of birth - Born in state of residence (%) - White
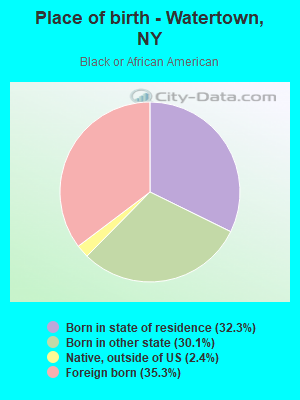
Place of birth - Born in state of residence (%) - Black or African American
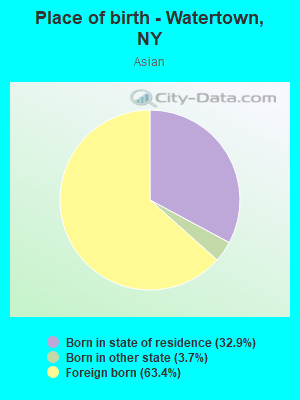
Place of birth - Born in state of residence (%) - Asian
Place of birth - Born in state of residence (%) - Hispanic or Latino
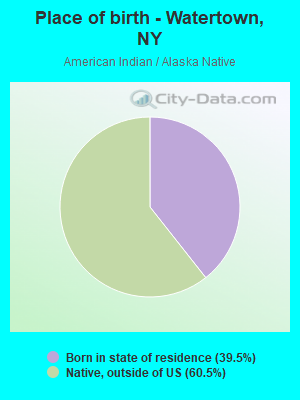
Place of birth - Born in state of residence (%) - American Indian and Alaska Native
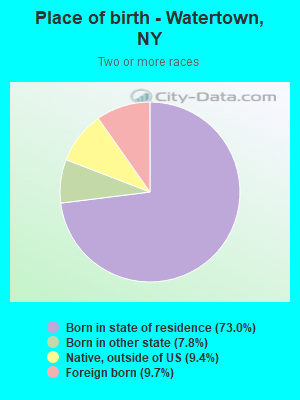
Place of birth - Born in state of residence (%) - Multirace
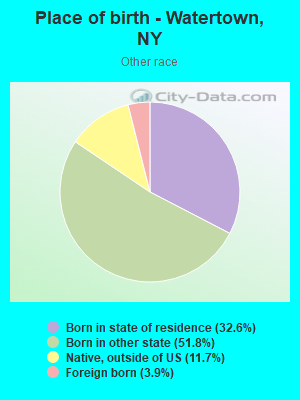
Place of birth - Born in state of residence (%) - Other Race
Place of birth - Born in other state (%)
Place of birth - Born in other state (%) - White
Place of birth - Born in other state (%) - Black or African American
Place of birth - Born in other state (%) - Asian
Place of birth - Born in other state (%) - Hispanic or Latino
Place of birth - Born in other state (%) - American Indian and Alaska Native
Place of birth - Born in other state (%) - Multirace
Place of birth - Born in other state (%) - Other Race
Place of birth - Native, outside of US (%)
Place of birth - Native, outside of US (%) - White
Place of birth - Native, outside of US (%) - Black or African American
Place of birth - Native, outside of US (%) - Asian
Place of birth - Native, outside of US (%) - Hispanic or Latino
Place of birth - Native, outside of US (%) - American Indian and Alaska Native
Place of birth - Native, outside of US (%) - Multirace
Place of birth - Native, outside of US (%) - Other Race
Place of birth - Foreign born (%)
Place of birth - Foreign born (%) - White
Place of birth - Foreign born (%) - Black or African American
Place of birth - Foreign born (%) - Asian
Place of birth - Foreign born (%) - Hispanic or Latino
Place of birth - Foreign born (%) - American Indian and Alaska Native
Place of birth - Foreign born (%) - Multirace
Place of birth - Foreign born (%) - Other Race
Residents speaking English at home (%)
Residents speaking English at home - Born in the United States (%)
Residents speaking English at home - Native, born elsewhere (%)
Residents speaking English at home - Foreign born (%)
Residents speaking Spanish at home (%)
Residents speaking Spanish at home - Born in the United States (%)
Residents speaking Spanish at home - Native, born elsewhere (%)
Residents speaking Spanish at home - Foreign born (%)
Residents speaking other language at home (%)
Residents speaking other language at home - Born in the United States (%)
Residents speaking other language at home - Native, born elsewhere (%)
Residents speaking other language at home - Foreign born (%)
Marital status - Never married (%)
Marital status - Now married (%)
Marital status - Separated (%)
Marital status - Widowed (%)
Marital status - Divorced (%)
Ancestries Reported - Arab (%)
Ancestries Reported - Czech (%)
Ancestries Reported - Danish (%)
Ancestries Reported - Dutch (%)
Ancestries Reported - English (%)
Ancestries Reported - French (%)
Ancestries Reported - French Canadian (%)
Ancestries Reported - German (%)
Ancestries Reported - Greek (%)
Ancestries Reported - Hungarian (%)
Ancestries Reported - Irish (%)
Ancestries Reported - Italian (%)
Ancestries Reported - Lithuanian (%)
Ancestries Reported - Norwegian (%)
Ancestries Reported - Polish (%)
Ancestries Reported - Portuguese (%)
Ancestries Reported - Russian (%)
Ancestries Reported - Scotch-Irish (%)
Ancestries Reported - Scottish (%)
Ancestries Reported - Slovak (%)
Ancestries Reported - Subsaharan African (%)
Ancestries Reported - Swedish (%)
Ancestries Reported - Swiss (%)
Ancestries Reported - Ukrainian (%)
Ancestries Reported - United States (%)
Ancestries Reported - Welsh (%)
Ancestries Reported - West Indian (%)
Ancestries Reported - Other (%)
Geographical mobility - Same house 1 year ago (%)
Geographical mobility - Same house 1 year ago (%) - White
Geographical mobility - Same house 1 year ago (%) - Black or African American
Geographical mobility - Same house 1 year ago (%) - Asian
Geographical mobility - Same house 1 year ago (%) - Hispanic or Latino
Geographical mobility - Same house 1 year ago (%) - American Indian and Alaska Native
Geographical mobility - Same house 1 year ago (%) - Multirace
Geographical mobility - Same house 1 year ago (%) - Other Race
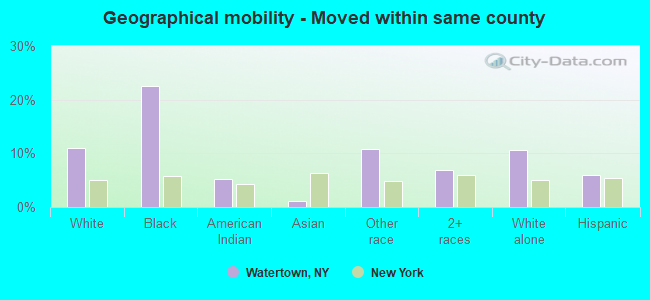
Geographical mobility - Moved within same county (%)
Geographical mobility - Moved within same county (%) - White
Geographical mobility - Moved within same county (%) - Black or African American
Geographical mobility - Moved within same county (%) - Asian
Geographical mobility - Moved within same county (%) - Hispanic or Latino
Geographical mobility - Moved within same county (%) - American Indian and Alaska Native
Geographical mobility - Moved within same county (%) - Multirace
Geographical mobility - Moved within same county (%) - Other Race
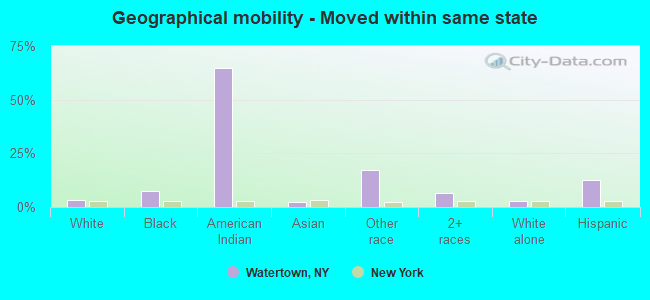
Geographical mobility - Moved from different county within same state (%)
Geographical mobility - Moved from different county within same state (%) - White
Geographical mobility - Moved from different county within same state (%) - Black or African American
Geographical mobility - Moved from different county within same state (%) - Asian
Geographical mobility - Moved from different county within same state (%) - Hispanic or Latino
Geographical mobility - Moved from different county within same state (%) - American Indian and Alaska Native
Geographical mobility - Moved from different county within same state (%) - Multirace
Geographical mobility - Moved from different county within same state (%) - Other Race
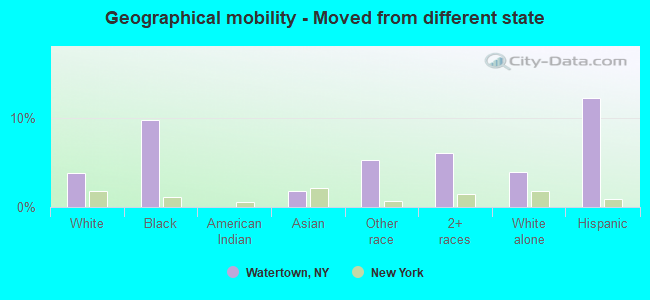
Geographical mobility - Moved from different state (%)
Geographical mobility - Moved from different state (%) - White
Geographical mobility - Moved from different state (%) - Black or African American
Geographical mobility - Moved from different state (%) - Asian
Geographical mobility - Moved from different state (%) - Hispanic or Latino
Geographical mobility - Moved from different state (%) - American Indian and Alaska Native
Geographical mobility - Moved from different state (%) - Multirace
Geographical mobility - Moved from different state (%) - Other Race
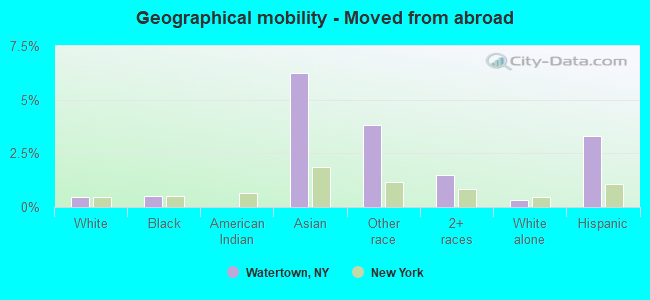
Geographical mobility - Moved from abroad (%)
Geographical mobility - Moved from abroad (%) - White
Geographical mobility - Moved from abroad (%) - Black or African American
Geographical mobility - Moved from abroad (%) - Asian
Geographical mobility - Moved from abroad (%) - Hispanic or Latino
Geographical mobility - Moved from abroad (%) - American Indian and Alaska Native
Geographical mobility - Moved from abroad (%) - Multirace
Geographical mobility - Moved from abroad (%) - Other Race
Place of birth for the foreign-born population - Ireland (%)
Place of birth for the foreign-born population - Denmark (%)
Place of birth for the foreign-born population - Norway (%)
Place of birth for the foreign-born population - Sweden (%)
Place of birth for the foreign-born population - United Kingdom (%)
Place of birth for the foreign-born population - England (%)
Place of birth for the foreign-born population - Scotland (%)
Place of birth for the foreign-born population - Other Northern Europe (%)
Place of birth for the foreign-born population - Austria (%)
Place of birth for the foreign-born population - Belgium (%)
Place of birth for the foreign-born population - France (%)
Place of birth for the foreign-born population - Germany (%)
Place of birth for the foreign-born population - Netherlands (%)
Place of birth for the foreign-born population - Switzerland (%)
Place of birth for the foreign-born population - Other Western Europe (%)
Place of birth for the foreign-born population - Greece (%)
Place of birth for the foreign-born population - Italy (%)
Place of birth for the foreign-born population - Portugal (%)
Place of birth for the foreign-born population - Spain (%)
Place of birth for the foreign-born population - Other Southern Europe (%)
Place of birth for the foreign-born population - Albania (%)
Place of birth for the foreign-born population - Belarus (%)
Place of birth for the foreign-born population - Bosnia and Herzegovina (%)
Place of birth for the foreign-born population - Bulgaria (%)
Place of birth for the foreign-born population - Croatia (%)
Place of birth for the foreign-born population - Czechoslovakia (%)
Place of birth for the foreign-born population - Hungary (%)
Place of birth for the foreign-born population - Latvia (%)
Place of birth for the foreign-born population - Lithuania (%)
Place of birth for the foreign-born population - North Macedonia (Macedonia) (%)
Place of birth for the foreign-born population - Moldova (%)
Place of birth for the foreign-born population - Poland (%)
Place of birth for the foreign-born population - Romania (%)
Place of birth for the foreign-born population - Russia (%)
Place of birth for the foreign-born population - Serbia (%)
Place of birth for the foreign-born population - Ukraine (%)
Place of birth for the foreign-born population - Other Eastern Europe (%)
Place of birth for the foreign-born population - China (%)
Place of birth for the foreign-born population - Hong Kong (%)
Place of birth for the foreign-born population - Taiwan (%)
Place of birth for the foreign-born population - Japan (%)
Place of birth for the foreign-born population - Korea (%)
Place of birth for the foreign-born population - Other Eastern Asia (%)
Place of birth for the foreign-born population - Afghanistan (%)
Place of birth for the foreign-born population - Bangladesh (%)
Place of birth for the foreign-born population - India (%)
Place of birth for the foreign-born population - Iran (%)
Place of birth for the foreign-born population - Kazakhstan (%)
Place of birth for the foreign-born population - Nepal (%)
Place of birth for the foreign-born population - Pakistan (%)
Place of birth for the foreign-born population - Sri Lanka (%)
Place of birth for the foreign-born population - Uzbekistan (%)
Place of birth for the foreign-born population - Other South Central Asia (%)
Place of birth for the foreign-born population - Burma (%)
Place of birth for the foreign-born population - Cambodia (%)
Place of birth for the foreign-born population - Indonesia (%)
Place of birth for the foreign-born population - Laos (%)
Place of birth for the foreign-born population - Malaysia (%)
Place of birth for the foreign-born population - Philippines (%)
Place of birth for the foreign-born population - Singapore (%)
Place of birth for the foreign-born population - Thailand (%)
Place of birth for the foreign-born population - Vietnam (%)
Place of birth for the foreign-born population - Other South Eastern Asia (%)
Place of birth for the foreign-born population - Armenia (%)
Place of birth for the foreign-born population - Iraq (%)
Place of birth for the foreign-born population - Israel (%)
Place of birth for the foreign-born population - Jordan (%)
Place of birth for the foreign-born population - Kuwait (%)
Place of birth for the foreign-born population - Lebanon (%)
Place of birth for the foreign-born population - Saudi Arabia (%)
Place of birth for the foreign-born population - Syria (%)
Place of birth for the foreign-born population - Turkey (%)
Place of birth for the foreign-born population - Yemen (%)
Place of birth for the foreign-born population - Other Western Asia (%)
Place of birth for the foreign-born population - Eritrea (%)
Place of birth for the foreign-born population - Ethiopia (%)
Place of birth for the foreign-born population - Kenya (%)
Place of birth for the foreign-born population - Somalia (%)
Place of birth for the foreign-born population - Uganda (%)
Place of birth for the foreign-born population - Zimbabwe (%)
Place of birth for the foreign-born population - Other Eastern Africa (%)
Place of birth for the foreign-born population - Cameroon (%)
Place of birth for the foreign-born population - Congo (%)
Place of birth for the foreign-born population - Democratic Republic of Congo (Zaire) (%)
Place of birth for the foreign-born population - Other Middle Africa (%)
Place of birth for the foreign-born population - Egypt (%)
Place of birth for the foreign-born population - Morocco (%)
Place of birth for the foreign-born population - Sudan (%)
Place of birth for the foreign-born population - Other Northern Africa (%)
Place of birth for the foreign-born population - South Africa (%)
Place of birth for the foreign-born population - Other Southern Africa (%)
Place of birth for the foreign-born population - Cabo Verde (%)
Place of birth for the foreign-born population - Ghana (%)
Place of birth for the foreign-born population - Liberia (%)
Place of birth for the foreign-born population - Nigeria (%)
Place of birth for the foreign-born population - Senegal (%)
Place of birth for the foreign-born population - Sierra Leone (%)
Place of birth for the foreign-born population - Other Western Africa (%)
Place of birth for the foreign-born population - Australia (%)
Place of birth for the foreign-born population - New Zealand (%)
Place of birth for the foreign-born population - Fiji (%)
Place of birth for the foreign-born population - Micronesia (%)
Place of birth for the foreign-born population - Bahamas (%)
Place of birth for the foreign-born population - Barbados (%)
Place of birth for the foreign-born population - Cuba (%)
Place of birth for the foreign-born population - Dominica (%)
Place of birth for the foreign-born population - Dominican Republic (%)
Place of birth for the foreign-born population - Grenada (%)
Place of birth for the foreign-born population - Haiti (%)
Place of birth for the foreign-born population - Jamaica (%)
Place of birth for the foreign-born population - St. Vincent and the Grenadines (%)
Place of birth for the foreign-born population - Trinidad and Tobago (%)
Place of birth for the foreign-born population - West Indies (%)
Place of birth for the foreign-born population - Other Caribbean (%)
Place of birth for the foreign-born population - Belize (%)
Place of birth for the foreign-born population - Costa Rica (%)
Place of birth for the foreign-born population - El Salvador (%)
Place of birth for the foreign-born population - Guatemala (%)
Place of birth for the foreign-born population - Honduras (%)
Place of birth for the foreign-born population - Mexico (%)
Place of birth for the foreign-born population - Nicaragua (%)
Place of birth for the foreign-born population - Panama (%)
Place of birth for the foreign-born population - Other Central America (%)
Place of birth for the foreign-born population - Argentina (%)
Place of birth for the foreign-born population - Bolivia (%)
Place of birth for the foreign-born population - Brazil (%)
Place of birth for the foreign-born population - Chile (%)
Place of birth for the foreign-born population - Colombia (%)
Place of birth for the foreign-born population - Ecuador (%)
Place of birth for the foreign-born population - Guyana (%)
Place of birth for the foreign-born population - Peru (%)
Place of birth for the foreign-born population - Uruguay (%)
Place of birth for the foreign-born population - Venezuela (%)
Place of birth for the foreign-born population - Other South America (%)
Place of birth for the foreign-born population - Canada (%)
Place of birth for the foreign-born population - Other Northern America (%)
Place of birth for the foreign-born population - Other (%)
Latest news about races in Watertown, NY collected exclusively by city-data.com from local newspapers, TV, and radio stations
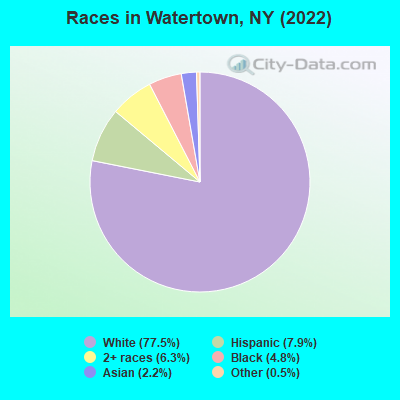
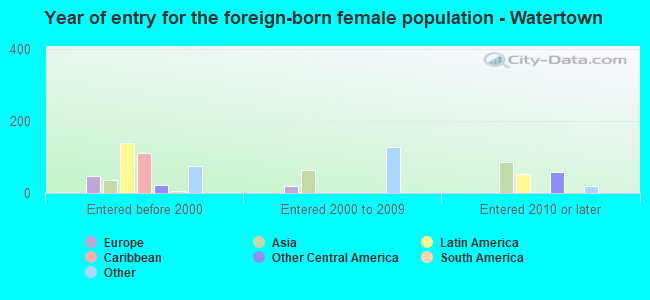
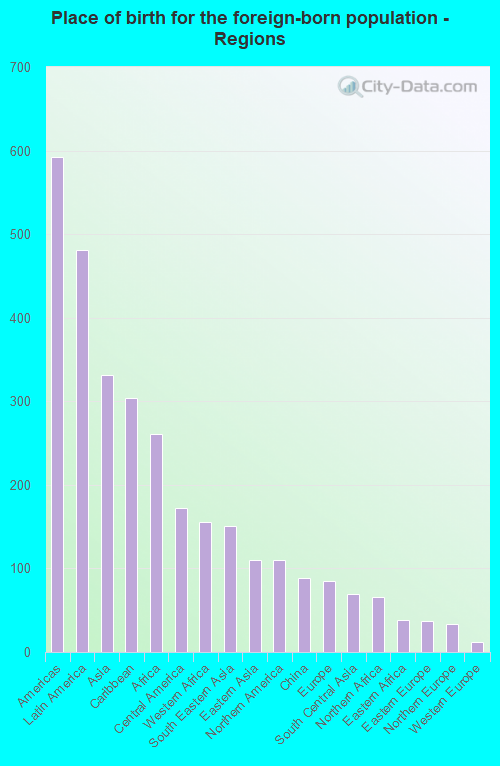
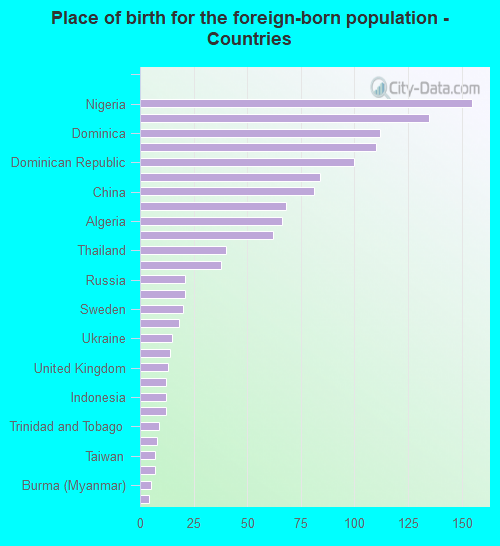
According to 2022 data, the most numerous races in Watertown, NY are White alone (19,133 residents), Hispanic (1,960 residents), and Black alone (1,186 residents). 93.6% of Watertown residents speak English at home. 5.1% of Watertown, NY residents are foreign-born (2.0% born in Latin America, 1.3% born in Asia, 1.1% born in Africa), which is 327.7% less than the foreign-born rate of 22.0% across the entire state of New York.
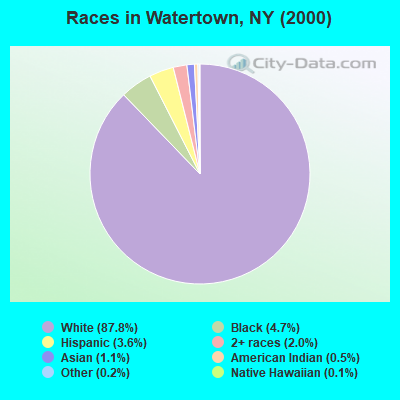
Race distribution in Watertown
2000 2022
11,760,981 62.0% White alone 2,867,583 15.1% Hispanic 2,812,623 14.8% Black alone 1,035,926 5.5% Asian alone 366,116 1.9% Two or more races 75,499 0.4% Other race alone 52,499 0.3% American Indian alone 5,230 0.03% Native Hawaiian and Other
10,408,933 52.9% White alone 3,867,299 19.7% Hispanic 2,633,840 13.4% Black alone 1,776,286 9.0% Asian alone 732,670 3.7% Two or more races 216,110 1.1% Other race alone 35,082 0.2% American Indian alone 6,931 0.04% Native Hawaiian and Other
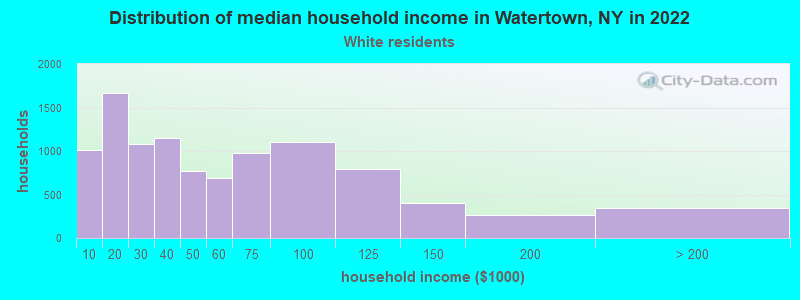
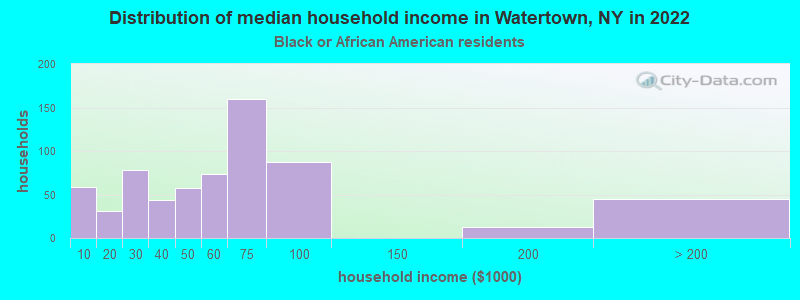
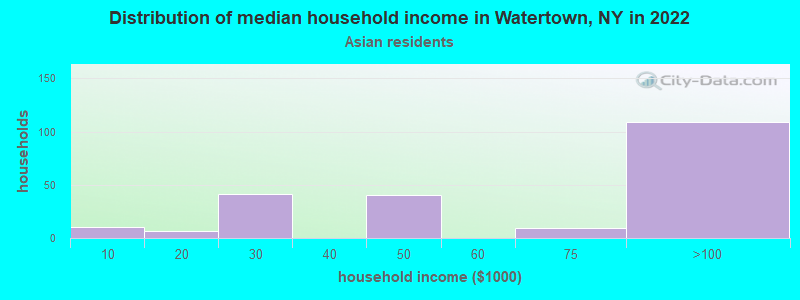
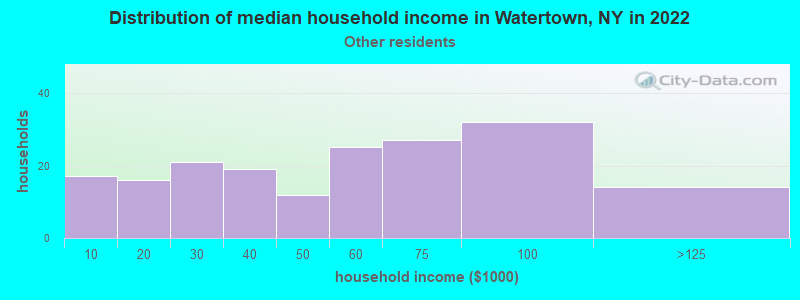
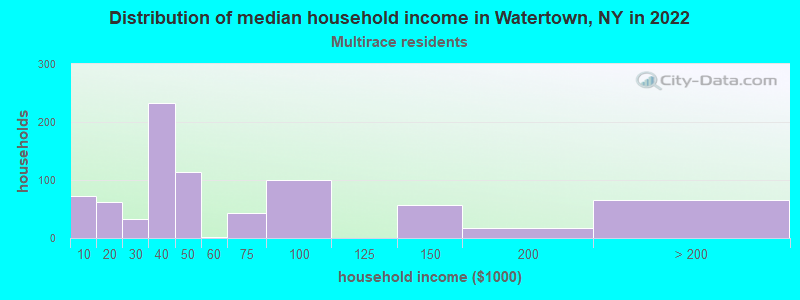
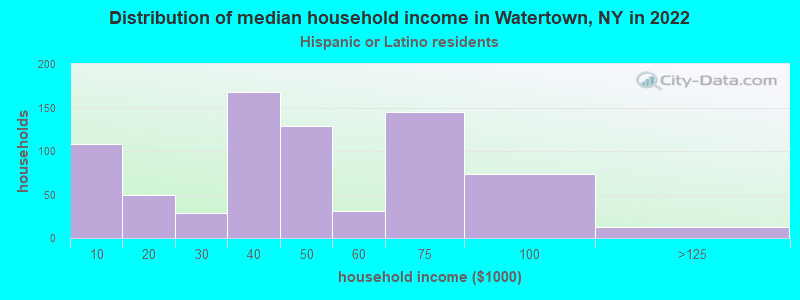
Income and house value in Watertown Median household income in 2022 $46,792 White non-Hispanic householders$58,289 Black householders$73,942 Asian householders$51,345 Some other race householders$74,681 Two or more races householders$39,909 Hispanic or Latino race householdersMedian 2022 house value $157,163 White Non-Hispanic householders$173,100 Black or African American householders$134,852 American Indian or Alaska Native householders $231,455 Asian householders$42,907 Some other race householders$170,158 Two or more races householders$214,537 Hispanic or Latino householders
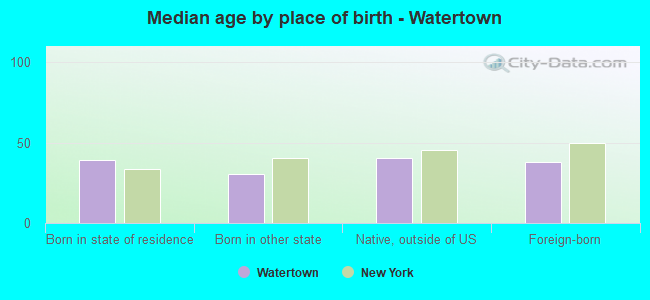
Median age by race in Watertown
38.4 Median age for White residents37.5 41.2 31.3 Median age for Black or African American residents31.9 43.4 54.5 Median age for American Indian / Alaska Native residents57.0 -642,115,202.4 31.7 Median age for Asian residents28.7 50.8 -666,666,666.0 Median age for Native Hawaiian / Pacific Islander residents-663,978,494.0 -497,387,669.3 23.1 Median age for Other race residents22.7 25.5 19.9 Median age for Two or more races residents24.7 14.6 39.6 Median age for White alone residents37.5 41.7 22.2 Median age for Hispanic or Latino residents22.7 22.7
Owner/renter occupied households by race in Watertown
House owners and renters - White residents 4,254 42.7% Owner occupied5,708 57.3% Renter occupiedHouse owners and renters - Black or African American residents 353 46.4% Owner occupied408 53.6% Renter occupiedHouse owners and renters - American Indian / Alaska Native residents 1 100.0% Owner occupiedHouse owners and renters - Asian residents 129 50.4% Owner occupied127 49.6% Renter occupiedHouse owners and renters - Other race residents 15 15.7% Owner occupied81 84.3% Renter occupiedHouse owners and renters - Two or more races residents 269 41.5% Owner occupied379 58.5% Renter occupiedHouse owners and renters - White alone residents 4,194 43.0% Owner occupied5,551 57.0% Renter occupiedHouse owners and renters - Hispanic or Latino residents 393 47.7% Owner occupied432 52.3% Renter occupied
Language usage in Watertown
English speakers - Total 93.6% of residents of Watertown speak English at home.
3.5% of residents speak Spanish at home 607 75.8% Speak English very well194 24.2% Speak English less than very well2.9% of residents speak other language at home 411 61.2% Speak English very well261 38.8% Speak English less than very well
English speakers - Born in the United States 96.6% of residents of Watertown speak English at home.
3.4% of residents speak Spanish at home 127 90.1% Speak English very well14 9.9% Speak English less than very well0.2% of residents speak other language at home 9 100.0% Speak English very well
English speakers - Native, born elsewhere 37.1% of residents of Watertown speak English at home.
48.7% of residents speak Spanish at home 139 54.9% Speak English very well114 45.1% Speak English less than very well10.2% of residents speak other language at home 28 52.8% Speak English very well25 47.2% Speak English less than very well
English speakers - Foreign-born 55.0% of residents of Watertown speak English at home.
7.8% of residents speak Spanish at home 27 24.3% Speak English very well84 75.7% Speak English less than very well37.5% of residents speak other language at home 301 56.3% Speak English very well234 43.7% Speak English less than very well
White (Caucasian) - Speak only English Native:
99.4% (18,042)Foreign-born:
85.3% (297)
White (Caucasian) - Speak another language Native:
1.2% (222)Foreign-born:
17.7% (62)
Black or African American - Speak only English Native:
72.4% (558)Foreign-born:
39.8% (264)
Black or African American - Speak another language Native:
37.3% (287)Foreign-born:
56.5% (375)
Asian - Speak only English Native:
85.9% (88)Foreign-born:
20.3% (73)
Asian - Speak another language Native:
81.9% (84)Foreign-born:
62.3% (225)
Other race - Speak only English Native:
48.3% (195)Foreign-born:
41.5% (15)
Other race - Speak another language Native:
53.9% (218)Foreign-born:
59.2% (21)
Two or more races - Speak only English Native:
81.8% (1,658)Foreign-born:
32.3% (82)
Two or more races - Speak another language Native:
17.7% (359)Foreign-born:
34.4% (87)
White alone - Speak only English Native:
99.5% (17,682)Foreign-born:
100.0% (292)
White alone - Speak another language Native:
0.8% (134)Foreign-born:
13.2% (38)
Hispanic or Latino - Speak only English Native:
67.0% (1,038)Foreign-born:
72.1% (144)
Hispanic or Latino - Speak another language Native:
33.6% (521)Foreign-born:
49.3% (99)
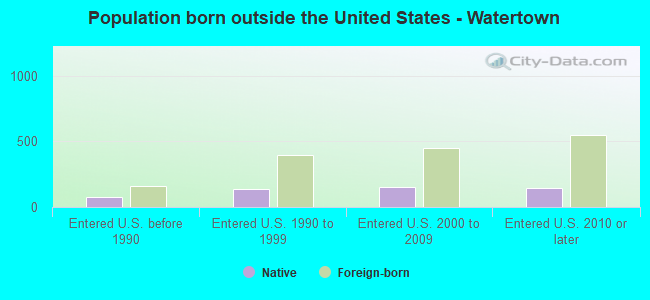
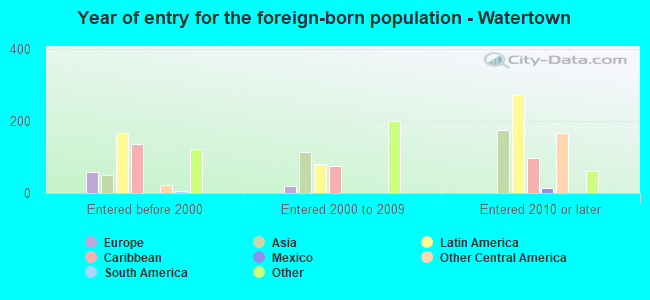
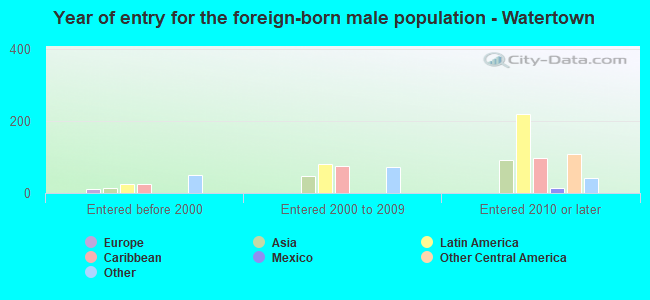
Foreign-born residents in Watertown 1,270 residents are foreign born (2.0% Latin America , 1.3% Asia , 1.1% Africa ).
This city:
5.1%New York:
22.6%
Marital status for residents in Watertown Marital status - White (Caucasian) population 15 years and over
Males 40.8% Never married39.6% Now married2.8% Separated2.8% Widowed14.0% DivorcedFemales 32.3% Never married39.1% Now married2.5% Separated7.5% Widowed18.6% DivorcedWomen who gave birth in the past 12 months Now married:
89.1% (247)Unmarried:
10.9% (30)
Women who did not give birth in the past 12 months Now married:
39.2% (1,602)Unmarried:
60.8% (2,483)
Marital status - Black or African American population 15 years and over
Males 38.6% Never married57.3% Now married1.5% Separated0.3% Widowed2.3% DivorcedFemales 28.8% Never married57.5% Now married6.2% Separated2.6% Widowed4.9% DivorcedWomen who gave birth in the past 12 months Now married:
100.0% (37)Unmarried:
0.0% (0)
Women who did not give birth in the past 12 months Now married:
66.4% (220)Unmarried:
33.6% (111)
Marital status - Asian population 15 years and over
Males 24.6% Never married66.2% Now married0.0% Separated0.0% Widowed9.2% DivorcedFemales 16.2% Never married37.7% Now married5.2% Separated18.2% Widowed22.7% DivorcedWomen who did not give birth in the past 12 months Now married:
52.4% (44)Unmarried:
47.6% (40)
Marital status - Other race population 15 years and over
Males 75.5% Never married19.6% Now married0.0% Separated2.2% Widowed2.7% DivorcedFemales 39.6% Never married21.6% Now married0.0% Separated0.0% Widowed38.8% DivorcedWomen who gave birth in the past 12 months Now married:
100.0% (10)Unmarried:
0.0% (0)
Women who did not give birth in the past 12 months Now married:
13.5% (19)Unmarried:
86.5% (120)
Marital status - Two or more races population 15 years and over
Males 66.9% Never married24.1% Now married0.0% Separated5.4% Widowed3.5% DivorcedFemales 48.9% Never married22.3% Now married2.7% Separated8.3% Widowed17.8% DivorcedWomen who did not give birth in the past 12 months Now married:
24.8% (136)Unmarried:
75.2% (413)
Marital status - White alone, not Hispanic / Latino population 15 years and over
Males 40.4% Never married40.1% Now married2.7% Separated2.9% Widowed13.9% DivorcedFemales 32.5% Never married38.7% Now married2.5% Separated7.5% Widowed18.8% DivorcedWomen who gave birth in the past 12 months Now married:
88.8% (242)Unmarried:
11.2% (31)
Women who did not give birth in the past 12 months Now married:
38.5% (1,556)Unmarried:
61.5% (2,487)
Marital status - Hispanic or Latino population 15 years and over
Males 46.6% Never married41.4% Now married2.4% Separated0.5% Widowed9.1% DivorcedFemales 38.7% Never married28.0% Now married7.6% Separated7.0% Widowed18.7% DivorcedWomen who gave birth in the past 12 months Now married:
100.0% (16)Unmarried:
0.0% (0)
Women who did not give birth in the past 12 months Now married:
34.4% (142)Unmarried:
65.6% (271)
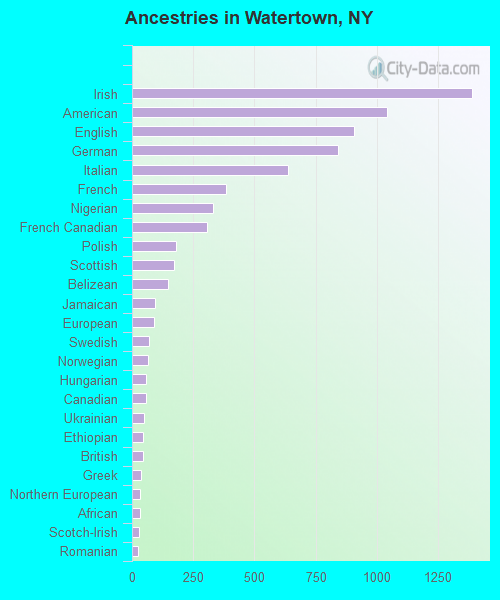
Ancestries in Watertown
1,389 13.7% Irish1,042 10.2% American905 8.9% English840 8.3% German638 6.3% Italian386 3.8% French329 3.2% Nigerian305 3.0% French Canadian180 1.8% Polish170 1.7% Scottish149 1.5% Belizean95 0.9% Jamaican90 0.9% European69 0.7% Swedish64 0.6% Norwegian58 0.6% Hungarian57 0.6% Canadian47 0.5% Ukrainian46 0.5% Ethiopian43 0.4% British35 0.3% Greek32 0.3% Northern European31 0.3% African29 0.3% Scotch-Irish23 0.2% Romanian17 0.2% Belgian16 0.2% Haitian13 0.1% Portuguese12 0.1% Danish8 0.08% Welsh8 0.08% West Indian6 0.06% Dutch1 0.01% Afghan
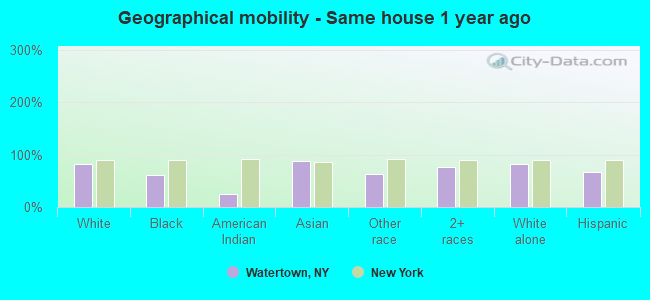
Geographical mobility in Watertown Same house 1 year ago 15,795 81.2% White (Caucasian)1,156 61.9% Black or African American4 23.9% American Indian / Alaska Native388 88.2% Asian320 63.1% Other race1,885 76.8% Two or more races15,507 81.7% White alone, not Hispanic / Latino1,261 66.4% Hispanic or LatinoMoved within same county 2,134 11.0% White / Caucasian421 22.5% Black or African American1 5.1% American Indian / Alaska Native5 1.2% Asian55 10.7% Other race168 6.9% Two or more races2,029 10.7% White alone, not Hispanic / Latino114 6.0% Hispanic or LatinoMoved within same state 639 3.3% White / Caucasian138 7.4% Black or African American11 64.9% American Indian / Alaska Native9 2.1% Asian88 17.3% Other race159 6.5% Two or more races504 2.7% White alone, not Hispanic / Latino242 12.8% Hispanic or LatinoMoved from different state 744 3.8% White / Caucasian183 9.8% Black or African American8 1.8% Asian27 5.3% Other race148 6.0% Two or more races738 3.9% White alone, not Hispanic / Latino232 12.2% Hispanic or LatinoMoved from abroad 94 0.5% White10 0.5% Black or African American27 6.2% Asian19 3.8% Other race36 1.5% Two or more races62 0.3% White alone, not Hispanic / Latino63 3.3% Hispanic or Latino
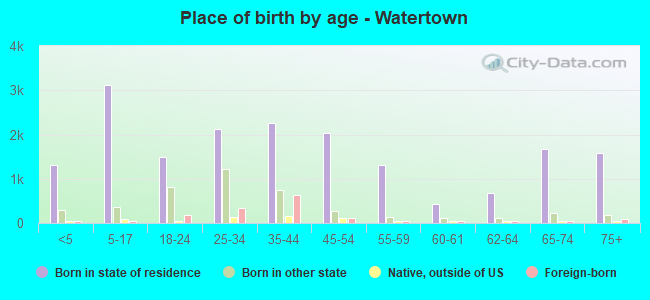
Children Nativity (place of birth) in Watertown
Children under 6 years - Living with two parents Both parents native 810 100.0% NativeBoth parents foreign-born 136 100.0% NativeOne native, one foreign-born parent 66 100.0% NativeChildren under 6 years - Living with one parent Native parent 729 100.0% NativeForeign-born parent 90 100.0% NativeChildren 6 to 17 years - Living with two parents Both parents native 1,448 100.0% NativeBoth parents foreign-born 53 100.0% NativeOne native, one foreign-born parent 11 100.0% NativeChildren 6 to 17 years - Living with one parent Native parent 1,412 100.0% NativeForeign-born parent 31 50.4% Native31 49.6% Foreign-born
Grandparents responsible for own grandchildren in Watertown
Grandparents (30 to 59 years) White / Caucasian 13 57.2% Responsible for grandchildren10 42.8% Not responsible for grandchildrenBlack or African American 5 38.3% Responsible for grandchildren8 61.7% Not responsible for grandchildrenWhite alone, not Hispanic / Latino 13 54.9% Responsible for grandchildren10 45.1% Not responsible for grandchildrenGrandparents (60 years and over) White / Caucasian 17 39.2% Responsible for grandchildren27 60.8% Not responsible for grandchildrenBlack or African American 20 100.0% Not responsible for grandchildrenWhite alone, not Hispanic / Latino 19 41.0% Responsible for grandchildren27 59.0% Not responsible for grandchildren