Races in Wayne, New Jersey (NJ) Detailed Stats
Ancestries, Foreign-born residents, place of birth

Recent posts about races in Wayne, New Jersey on our local forum with over 2,400,000 registered users:

16.3% of Wayne, NJ residents are foreign-born (7.1% born in Europe, 6.1% born in Asia, 2.4% born in Latin America), which is 40.9% less than the foreign-born rate of 23.0% across the entire state of New Jersey.
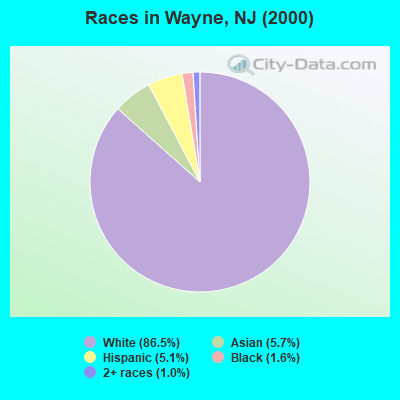
Race distribution in Wayne

- 46,76686.5%White alone
- 3,0565.7%Asian alone
- 2,7545.1%Hispanic
- 8431.6%Black alone
- 5541.0%Two or more races
- 470.09%Other race alone
- 410.08%American Indian alone
- 80.01%Native Hawaiian and Other
Pacific Islander alone
2000
2022
-
- 5,557,20966.0%White alone
- 1,117,19113.3%Hispanic
- 1,096,17113.0%Black alone
- 477,0125.7%Asian alone
- 133,6891.6%Two or more races
- 19,5650.2%Other race alone
- 11,3380.1%American Indian alone
- 2,1750.03%Native Hawaiian and Other
Pacific Islander alone

-
- 4,766,47651.5%White alone
- 2,028,47021.9%Hispanic
- 1,111,63212.0%Black alone
- 923,54610.0%Asian alone
- 332,2373.6%Two or more races
- 89,8471.0%Other race alone
- 8,5570.09%American Indian alone
- 9340.01%Native Hawaiian and Other
Pacific Islander alone

Income and house value in Wayne
- Median household income in 2022
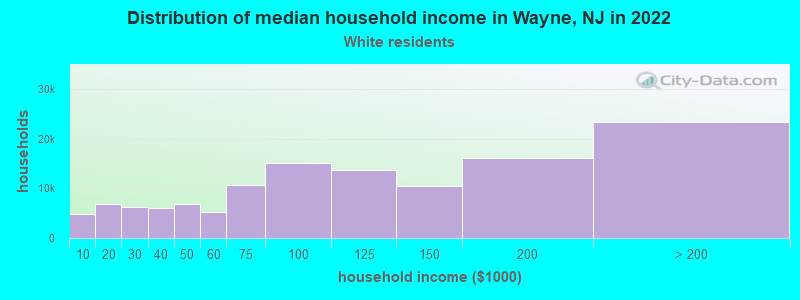
- $147,838White non-Hispanic householders
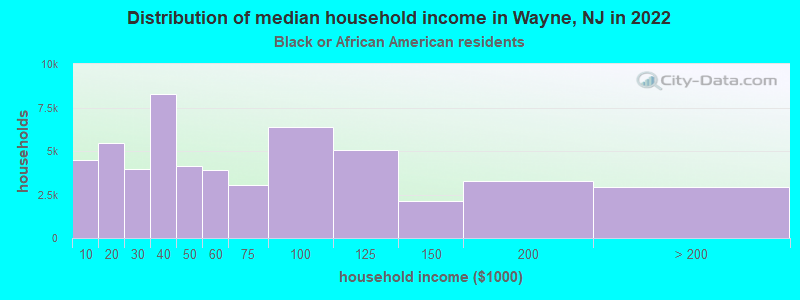
- $140,355Black householders
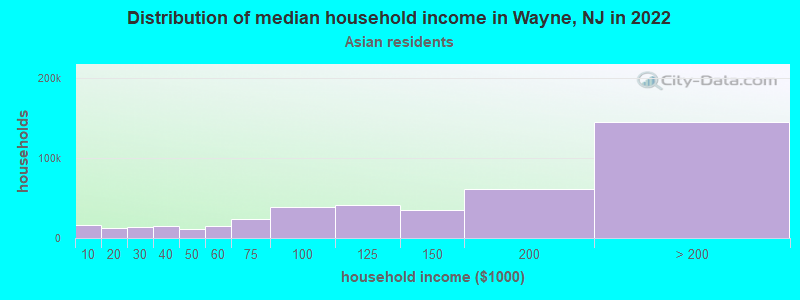
- $187,444Asian householders
- $110,281Some other race householders
- $114,917Two or more races householders
- $114,412Hispanic or Latino race householders
- Median 2022 house value
- $667,965White Non-Hispanic householders
- $678,051Black or African American householders
- $719,095Asian householders
- $658,349Some other race householders
- $676,878Two or more races householders
- $622,699Hispanic or Latino householders
Household income for White non-Hispanic householders
Household income for Black householders
Household income for Asian householders
Household income for Two or more races householders
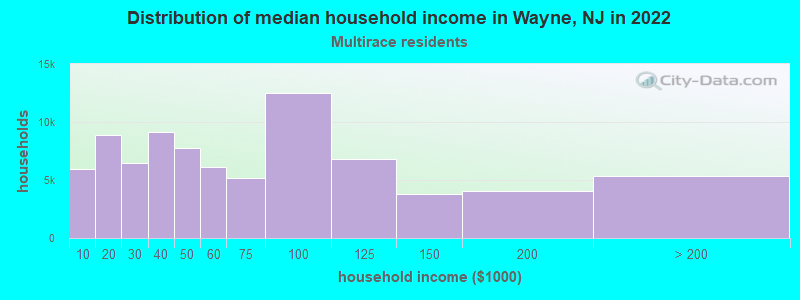
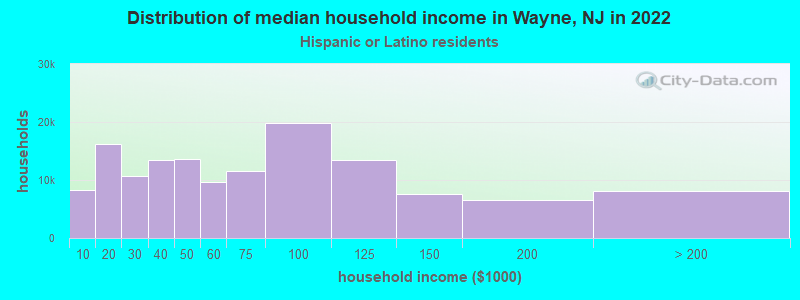
Household income for Hispanic or Latino race householders
Foreign-born residents in Wayne
8,824 residents are foreign born (7.1% Europe, 6.1% Asia, 2.4% Latin America).
| This city: | 16.3% |
| New Jersey: | 17.5% |
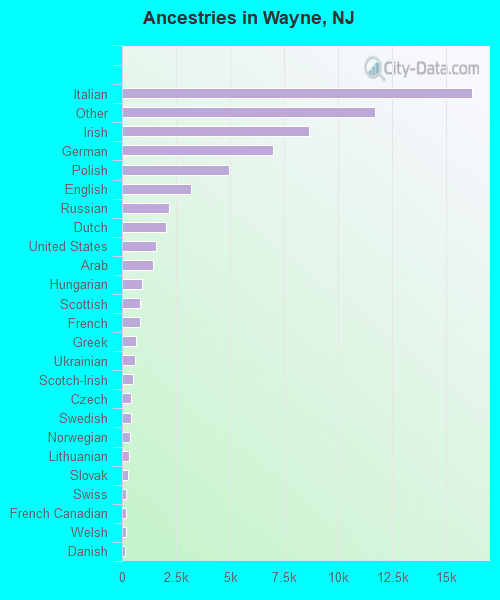
Ancestries in Wayne

- 16,16624.5%Italian
- 11,72017.7%Other
- 8,63213.1%Irish
- 6,96410.5%German
- 4,9307.5%Polish
- 3,1774.8%English
- 2,1853.3%Russian
- 2,0353.1%Dutch
- 1,5882.4%United States
- 1,4482.2%Arab
- 9321.4%Hungarian
- 8451.3%Scottish
- 8191.2%French
- 6521.0%Greek
- 6200.9%Ukrainian
- 4990.8%Scotch-Irish
- 4350.7%Czech
- 4050.6%Swedish
- 3890.6%Norwegian
- 3020.5%Lithuanian
- 2740.4%Slovak
- 2060.3%Swiss
- 1830.3%French Canadian
- 1790.3%Welsh
- 1590.2%Danish
- 1360.2%Portuguese
- 1220.2%West Indian
- 770.1%Subsaharan African
Zip codes: 07470.