Races in West Rancho Dominguez, California (CA) Detailed Stats
Data:
Races - White alone (%)
Races - White alone (% change since 2000)
Races - Black alone (%)
Races - Black alone (% change since 2000)
Races - American Indian alone (%)
Races - American Indian alone (% change since 2000)
Races - Asian alone (%)
Races - Asian alone (% change since 2000)
Races - Hispanic (%)
Races - Hispanic (% change since 2000)
Races - Native Hawaiian and Other Pacific Islander alone (%)
Races - Native Hawaiian and Other Pacific Islander alone (% change since 2000)
Races - Two or more races(%)
Races - Two or more races(% change since 2000)
Races - Other race alone (%)
Races - Other race alone (% change since 2000)
Racial diversity
Place of birth - Born in state of residence (%)
Place of birth - Born in state of residence (%) - White
Place of birth - Born in state of residence (%) - Black or African American
Place of birth - Born in state of residence (%) - Asian
Place of birth - Born in state of residence (%) - Hispanic or Latino
Place of birth - Born in state of residence (%) - American Indian and Alaska Native
Place of birth - Born in state of residence (%) - Multirace
Place of birth - Born in state of residence (%) - Other Race
Place of birth - Born in other state (%)
Place of birth - Born in other state (%) - White
Place of birth - Born in other state (%) - Black or African American
Place of birth - Born in other state (%) - Asian
Place of birth - Born in other state (%) - Hispanic or Latino
Place of birth - Born in other state (%) - American Indian and Alaska Native
Place of birth - Born in other state (%) - Multirace
Place of birth - Born in other state (%) - Other Race
Place of birth - Native, outside of US (%)
Place of birth - Native, outside of US (%) - White
Place of birth - Native, outside of US (%) - Black or African American
Place of birth - Native, outside of US (%) - Asian
Place of birth - Native, outside of US (%) - Hispanic or Latino
Place of birth - Native, outside of US (%) - American Indian and Alaska Native
Place of birth - Native, outside of US (%) - Multirace
Place of birth - Native, outside of US (%) - Other Race
Place of birth - Foreign born (%)
Place of birth - Foreign born (%) - White
Place of birth - Foreign born (%) - Black or African American
Place of birth - Foreign born (%) - Asian
Place of birth - Foreign born (%) - Hispanic or Latino
Place of birth - Foreign born (%) - American Indian and Alaska Native
Place of birth - Foreign born (%) - Multirace
Place of birth - Foreign born (%) - Other Race
Residents speaking English at home (%)
Residents speaking English at home - Born in the United States (%)
Residents speaking English at home - Native, born elsewhere (%)
Residents speaking English at home - Foreign born (%)
Residents speaking Spanish at home (%)
Residents speaking Spanish at home - Born in the United States (%)
Residents speaking Spanish at home - Native, born elsewhere (%)
Residents speaking Spanish at home - Foreign born (%)
Residents speaking other language at home (%)
Residents speaking other language at home - Born in the United States (%)
Residents speaking other language at home - Native, born elsewhere (%)
Residents speaking other language at home - Foreign born (%)
Marital status - Never married (%)
Marital status - Now married (%)
Marital status - Separated (%)
Marital status - Widowed (%)
Marital status - Divorced (%)
Ancestries Reported - Arab (%)
Ancestries Reported - Czech (%)
Ancestries Reported - Danish (%)
Ancestries Reported - Dutch (%)
Ancestries Reported - English (%)
Ancestries Reported - French (%)
Ancestries Reported - French Canadian (%)
Ancestries Reported - German (%)
Ancestries Reported - Greek (%)
Ancestries Reported - Hungarian (%)
Ancestries Reported - Irish (%)
Ancestries Reported - Italian (%)
Ancestries Reported - Lithuanian (%)
Ancestries Reported - Norwegian (%)
Ancestries Reported - Polish (%)
Ancestries Reported - Portuguese (%)
Ancestries Reported - Russian (%)
Ancestries Reported - Scotch-Irish (%)
Ancestries Reported - Scottish (%)
Ancestries Reported - Slovak (%)
Ancestries Reported - Subsaharan African (%)
Ancestries Reported - Swedish (%)
Ancestries Reported - Swiss (%)
Ancestries Reported - Ukrainian (%)
Ancestries Reported - United States (%)
Ancestries Reported - Welsh (%)
Ancestries Reported - West Indian (%)
Ancestries Reported - Other (%)
Geographical mobility - Same house 1 year ago (%)
Geographical mobility - Same house 1 year ago (%) - White
Geographical mobility - Same house 1 year ago (%) - Black or African American
Geographical mobility - Same house 1 year ago (%) - Asian
Geographical mobility - Same house 1 year ago (%) - Hispanic or Latino
Geographical mobility - Same house 1 year ago (%) - American Indian and Alaska Native
Geographical mobility - Same house 1 year ago (%) - Multirace
Geographical mobility - Same house 1 year ago (%) - Other Race
Geographical mobility - Moved within same county (%)
Geographical mobility - Moved within same county (%) - White
Geographical mobility - Moved within same county (%) - Black or African American
Geographical mobility - Moved within same county (%) - Asian
Geographical mobility - Moved within same county (%) - Hispanic or Latino
Geographical mobility - Moved within same county (%) - American Indian and Alaska Native
Geographical mobility - Moved within same county (%) - Multirace
Geographical mobility - Moved within same county (%) - Other Race
Geographical mobility - Moved from different county within same state (%)
Geographical mobility - Moved from different county within same state (%) - White
Geographical mobility - Moved from different county within same state (%) - Black or African American
Geographical mobility - Moved from different county within same state (%) - Asian
Geographical mobility - Moved from different county within same state (%) - Hispanic or Latino
Geographical mobility - Moved from different county within same state (%) - American Indian and Alaska Native
Geographical mobility - Moved from different county within same state (%) - Multirace
Geographical mobility - Moved from different county within same state (%) - Other Race
Geographical mobility - Moved from different state (%)
Geographical mobility - Moved from different state (%) - White
Geographical mobility - Moved from different state (%) - Black or African American
Geographical mobility - Moved from different state (%) - Asian
Geographical mobility - Moved from different state (%) - Hispanic or Latino
Geographical mobility - Moved from different state (%) - American Indian and Alaska Native
Geographical mobility - Moved from different state (%) - Multirace
Geographical mobility - Moved from different state (%) - Other Race
Geographical mobility - Moved from abroad (%)
Geographical mobility - Moved from abroad (%) - White
Geographical mobility - Moved from abroad (%) - Black or African American
Geographical mobility - Moved from abroad (%) - Asian
Geographical mobility - Moved from abroad (%) - Hispanic or Latino
Geographical mobility - Moved from abroad (%) - American Indian and Alaska Native
Geographical mobility - Moved from abroad (%) - Multirace
Geographical mobility - Moved from abroad (%) - Other Race
Place of birth for the foreign-born population - Ireland (%)
Place of birth for the foreign-born population - Denmark (%)
Place of birth for the foreign-born population - Norway (%)
Place of birth for the foreign-born population - Sweden (%)
Place of birth for the foreign-born population - United Kingdom (%)
Place of birth for the foreign-born population - England (%)
Place of birth for the foreign-born population - Scotland (%)
Place of birth for the foreign-born population - Other Northern Europe (%)
Place of birth for the foreign-born population - Austria (%)
Place of birth for the foreign-born population - Belgium (%)
Place of birth for the foreign-born population - France (%)
Place of birth for the foreign-born population - Germany (%)
Place of birth for the foreign-born population - Netherlands (%)
Place of birth for the foreign-born population - Switzerland (%)
Place of birth for the foreign-born population - Other Western Europe (%)
Place of birth for the foreign-born population - Greece (%)
Place of birth for the foreign-born population - Italy (%)
Place of birth for the foreign-born population - Portugal (%)
Place of birth for the foreign-born population - Spain (%)
Place of birth for the foreign-born population - Other Southern Europe (%)
Place of birth for the foreign-born population - Albania (%)
Place of birth for the foreign-born population - Belarus (%)
Place of birth for the foreign-born population - Bosnia and Herzegovina (%)
Place of birth for the foreign-born population - Bulgaria (%)
Place of birth for the foreign-born population - Croatia (%)
Place of birth for the foreign-born population - Czechoslovakia (%)
Place of birth for the foreign-born population - Hungary (%)
Place of birth for the foreign-born population - Latvia (%)
Place of birth for the foreign-born population - Lithuania (%)
Place of birth for the foreign-born population - North Macedonia (Macedonia) (%)
Place of birth for the foreign-born population - Moldova (%)
Place of birth for the foreign-born population - Poland (%)
Place of birth for the foreign-born population - Romania (%)
Place of birth for the foreign-born population - Russia (%)
Place of birth for the foreign-born population - Serbia (%)
Place of birth for the foreign-born population - Ukraine (%)
Place of birth for the foreign-born population - Other Eastern Europe (%)
Place of birth for the foreign-born population - China (%)
Place of birth for the foreign-born population - Hong Kong (%)
Place of birth for the foreign-born population - Taiwan (%)
Place of birth for the foreign-born population - Japan (%)
Place of birth for the foreign-born population - Korea (%)
Place of birth for the foreign-born population - Other Eastern Asia (%)
Place of birth for the foreign-born population - Afghanistan (%)
Place of birth for the foreign-born population - Bangladesh (%)
Place of birth for the foreign-born population - India (%)
Place of birth for the foreign-born population - Iran (%)
Place of birth for the foreign-born population - Kazakhstan (%)
Place of birth for the foreign-born population - Nepal (%)
Place of birth for the foreign-born population - Pakistan (%)
Place of birth for the foreign-born population - Sri Lanka (%)
Place of birth for the foreign-born population - Uzbekistan (%)
Place of birth for the foreign-born population - Other South Central Asia (%)
Place of birth for the foreign-born population - Burma (%)
Place of birth for the foreign-born population - Cambodia (%)
Place of birth for the foreign-born population - Indonesia (%)
Place of birth for the foreign-born population - Laos (%)
Place of birth for the foreign-born population - Malaysia (%)
Place of birth for the foreign-born population - Philippines (%)
Place of birth for the foreign-born population - Singapore (%)
Place of birth for the foreign-born population - Thailand (%)
Place of birth for the foreign-born population - Vietnam (%)
Place of birth for the foreign-born population - Other South Eastern Asia (%)
Place of birth for the foreign-born population - Armenia (%)
Place of birth for the foreign-born population - Iraq (%)
Place of birth for the foreign-born population - Israel (%)
Place of birth for the foreign-born population - Jordan (%)
Place of birth for the foreign-born population - Kuwait (%)
Place of birth for the foreign-born population - Lebanon (%)
Place of birth for the foreign-born population - Saudi Arabia (%)
Place of birth for the foreign-born population - Syria (%)
Place of birth for the foreign-born population - Turkey (%)
Place of birth for the foreign-born population - Yemen (%)
Place of birth for the foreign-born population - Other Western Asia (%)
Place of birth for the foreign-born population - Eritrea (%)
Place of birth for the foreign-born population - Ethiopia (%)
Place of birth for the foreign-born population - Kenya (%)
Place of birth for the foreign-born population - Somalia (%)
Place of birth for the foreign-born population - Uganda (%)
Place of birth for the foreign-born population - Zimbabwe (%)
Place of birth for the foreign-born population - Other Eastern Africa (%)
Place of birth for the foreign-born population - Cameroon (%)
Place of birth for the foreign-born population - Congo (%)
Place of birth for the foreign-born population - Democratic Republic of Congo (Zaire) (%)
Place of birth for the foreign-born population - Other Middle Africa (%)
Place of birth for the foreign-born population - Egypt (%)
Place of birth for the foreign-born population - Morocco (%)
Place of birth for the foreign-born population - Sudan (%)
Place of birth for the foreign-born population - Other Northern Africa (%)
Place of birth for the foreign-born population - South Africa (%)
Place of birth for the foreign-born population - Other Southern Africa (%)
Place of birth for the foreign-born population - Cabo Verde (%)
Place of birth for the foreign-born population - Ghana (%)
Place of birth for the foreign-born population - Liberia (%)
Place of birth for the foreign-born population - Nigeria (%)
Place of birth for the foreign-born population - Senegal (%)
Place of birth for the foreign-born population - Sierra Leone (%)
Place of birth for the foreign-born population - Other Western Africa (%)
Place of birth for the foreign-born population - Australia (%)
Place of birth for the foreign-born population - New Zealand (%)
Place of birth for the foreign-born population - Fiji (%)
Place of birth for the foreign-born population - Micronesia (%)
Place of birth for the foreign-born population - Bahamas (%)
Place of birth for the foreign-born population - Barbados (%)
Place of birth for the foreign-born population - Cuba (%)
Place of birth for the foreign-born population - Dominica (%)
Place of birth for the foreign-born population - Dominican Republic (%)
Place of birth for the foreign-born population - Grenada (%)
Place of birth for the foreign-born population - Haiti (%)
Place of birth for the foreign-born population - Jamaica (%)
Place of birth for the foreign-born population - St. Vincent and the Grenadines (%)
Place of birth for the foreign-born population - Trinidad and Tobago (%)
Place of birth for the foreign-born population - West Indies (%)
Place of birth for the foreign-born population - Other Caribbean (%)
Place of birth for the foreign-born population - Belize (%)
Place of birth for the foreign-born population - Costa Rica (%)
Place of birth for the foreign-born population - El Salvador (%)
Place of birth for the foreign-born population - Guatemala (%)
Place of birth for the foreign-born population - Honduras (%)
Place of birth for the foreign-born population - Mexico (%)
Place of birth for the foreign-born population - Nicaragua (%)
Place of birth for the foreign-born population - Panama (%)
Place of birth for the foreign-born population - Other Central America (%)
Place of birth for the foreign-born population - Argentina (%)
Place of birth for the foreign-born population - Bolivia (%)
Place of birth for the foreign-born population - Brazil (%)
Place of birth for the foreign-born population - Chile (%)
Place of birth for the foreign-born population - Colombia (%)
Place of birth for the foreign-born population - Ecuador (%)
Place of birth for the foreign-born population - Guyana (%)
Place of birth for the foreign-born population - Peru (%)
Place of birth for the foreign-born population - Uruguay (%)
Place of birth for the foreign-born population - Venezuela (%)
Place of birth for the foreign-born population - Other South America (%)
Place of birth for the foreign-born population - Canada (%)
Place of birth for the foreign-born population - Other Northern America (%)
Place of birth for the foreign-born population - Other (%)
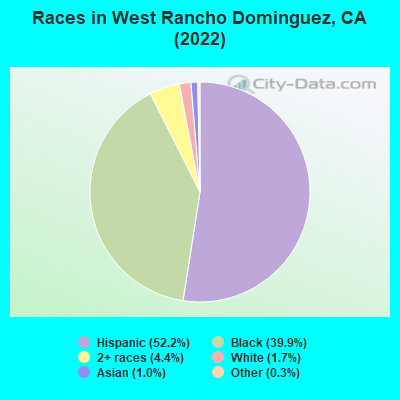
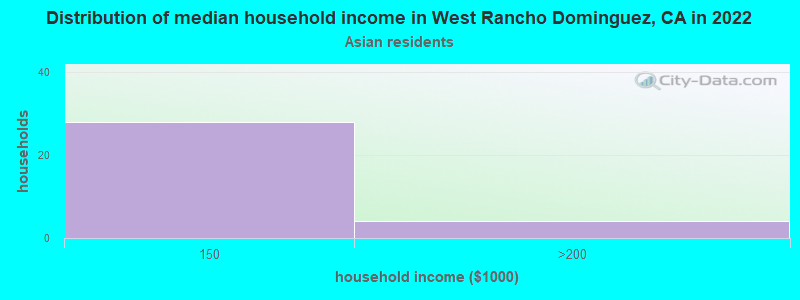
According to 2022 data, the most numerous races in West Rancho Dominguez, CA are Hispanic (12,097 residents), White alone (355 residents), and Asian alone (207 residents). 49.8% of West Rancho Dominguez residents speak English at home.
Race distribution in West Rancho Dominguez 12,097 53.0% Hispanic 9,321 40.8% Black alone 764 3.3% Two or more races 355 1.6% White alone 207 0.9% Asian alone 101 0.4% Other race alone 14 0.06% Native Hawaiian and Other 12 0.05% American Indian alone
2000 2022
15,816,790 46.7% White alone 10,966,556 32.4% Hispanic 3,648,860 10.8% Asian alone 2,181,926 6.4% Black alone 903,115 2.7% Two or more races 178,984 0.5% American Indian alone 103,736 0.3% Native Hawaiian and Other 71,681 0.2% Other race alone
15,732,184 40.3% Hispanic 13,160,426 33.7% White alone 5,957,867 15.3% Asian alone 2,025,218 5.2% Black alone 1,663,222 4.3% Two or more races 251,618 0.6% Other race alone 135,777 0.3% Native Hawaiian and Other 103,030 0.3% American Indian alone
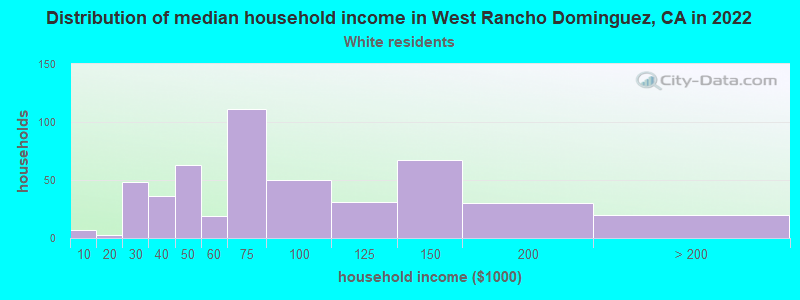
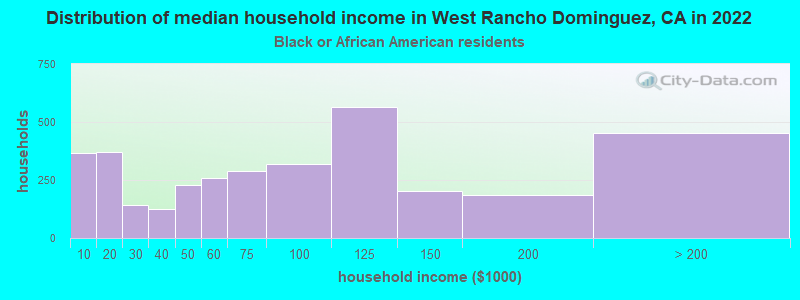
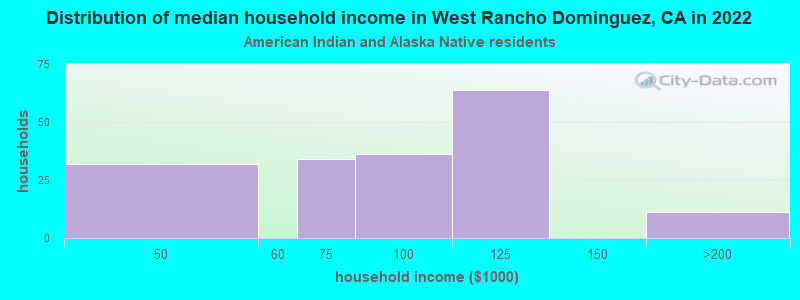
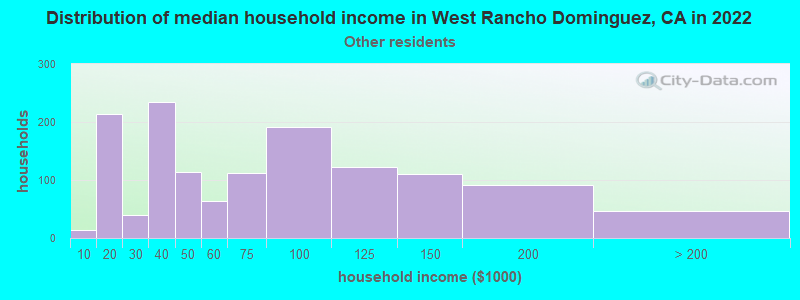
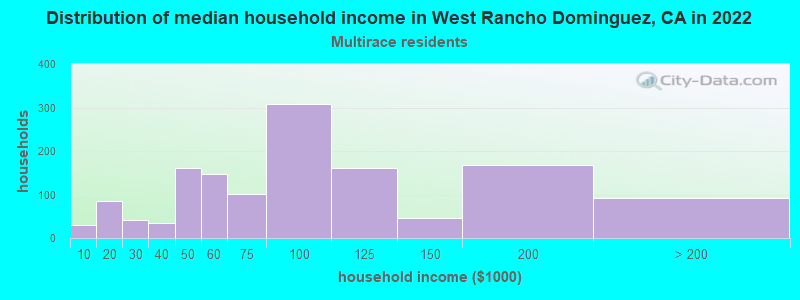
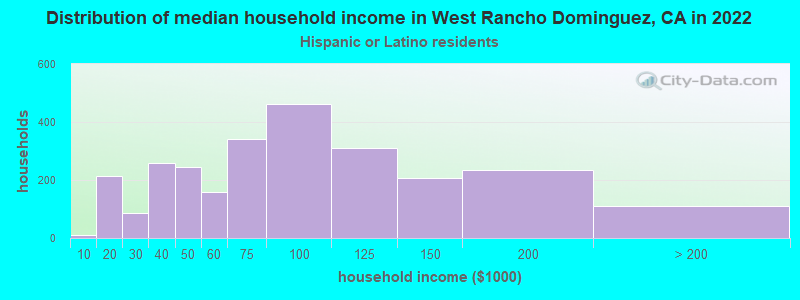
Income and house value in West Rancho Dominguez Median household income in 2022 $49,625 White non-Hispanic householders$83,174 Black householders$128,709 American Indian and Alaska Native householders$126,192 Asian householders$77,828 Some other race householders$26,547 Two or more races householders$84,788 Hispanic or Latino race householders
Median age by race in West Rancho Dominguez
32.7 Median age for White residents30.0 36.7 47.2 Median age for Black or African American residents46.1 47.8 64.0 Median age for American Indian / Alaska Native residents64.1 Median age for Asian residents67.8 58.1 34.9 Median age for Other race residents36.3 31.7 23.1 Median age for Two or more races residents20.8 24.8 50.8 Median age for White alone residents49.6 51.8 33.1 Median age for Hispanic or Latino residents32.6 33.9
Owner/renter occupied households by race in West Rancho Dominguez
House owners and renters - White residents 883 64.2% Owner occupied492 35.8% Renter occupiedHouse owners and renters - Black or African American residents 2,571 71.2% Owner occupied1,038 28.8% Renter occupiedHouse owners and renters - American Indian / Alaska Native residents 87 100.0% Owner occupiedHouse owners and renters - Asian residents 53 100.0% Owner occupiedHouse owners and renters - Other race residents 807 77.8% Owner occupied230 22.2% Renter occupiedHouse owners and renters - Two or more races residents 159 39.9% Owner occupied239 60.1% Renter occupiedHouse owners and renters - White alone residents 45 49.1% Owner occupied47 50.9% Renter occupiedHouse owners and renters - Hispanic or Latino residents 1,867 70.9% Owner occupied767 29.1% Renter occupied
Language usage in West Rancho Dominguez
English speakers - Total 49.8% of residents of West Rancho Dominguez speak English at home.
48.2% of residents speak Spanish at home 6,387 61.6% Speak English very well3,989 38.4% Speak English less than very well1.5% of residents speak other language at home 205 63.9% Speak English very well116 36.1% Speak English less than very well
English speakers - Born in the United States 92.7% of residents of West Rancho Dominguez speak English at home.
5.2% of residents speak Spanish at home 132 95.7% Speak English very well6 4.3% Speak English less than very well2.0% of residents speak other language at home 53 100.0% Speak English very well
English speakers - Native, born elsewhere 22.9% of residents of West Rancho Dominguez speak English at home.
74.6% of residents speak Spanish at home 200 82.0% Speak English very well44 18.0% Speak English less than very well3.7% of residents speak other language at home 12 100.0% Speak English very well
English speakers - Foreign-born 4.0% of residents of West Rancho Dominguez speak English at home.
89.5% of residents speak Spanish at home 1,378 29.4% Speak English very well3,313 70.6% Speak English less than very well3.1% of residents speak other language at home 53 32.5% Speak English very well110 67.5% Speak English less than very well
White (Caucasian) - Speak only English Native:
21.4% (790)Foreign-born:
1.5% (29)
White (Caucasian) - Speak another language Native:
62.2% (2,296)Foreign-born:
93.8% (1,788)
Black or African American - Speak only English Native:
95.8% (8,296)Foreign-born:
65.8% (109)
Black or African American - Speak another language Native:
3.9% (341)Foreign-born:
26.8% (44)
Asian - Speak only English Native:
53.5% (31)Foreign-born:
3.8% (6)
Asian - Speak another language Native:
46.2% (27)Foreign-born:
95.4% (141)
Native Hawaiian / Pacific Islander - Speak another language Native:
76.5% (3)Foreign-born:
97.0% (14)
Other race - Speak only English Native:
5.5% (127)Foreign-born:
3.8% (74)
Other race - Speak another language Native:
90.8% (2,116)Foreign-born:
95.7% (1,854)
White alone - Speak only English Native:
85.9% (276)Foreign-born:
16.0% (6)
White alone - Speak another language Native:
14.6% (47)Foreign-born:
84.6% (30)
Hispanic or Latino - Speak only English Native:
13.7% (902)Foreign-born:
2.2% (102)
Hispanic or Latino - Speak another language Native:
83.8% (5,530)Foreign-born:
97.0% (4,561)
Foreign-born residents in West Rancho Dominguez
Marital status for residents in West Rancho Dominguez Marital status - White (Caucasian) population 15 years and over
Males 53.6% Never married41.1% Now married0.4% Separated0.5% Widowed4.4% DivorcedFemales 39.1% Never married40.2% Now married8.1% Separated7.9% Widowed4.6% DivorcedWomen who gave birth in the past 12 months Now married:
52.7% (62)Unmarried:
47.3% (56)
Women who did not give birth in the past 12 months Now married:
42.5% (611)Unmarried:
57.5% (826)
Marital status - Black or African American population 15 years and over
Males 48.1% Never married31.0% Now married4.5% Separated5.4% Widowed10.9% DivorcedFemales 44.5% Never married26.0% Now married4.4% Separated12.0% Widowed13.2% DivorcedWomen who gave birth in the past 12 months Now married:
41.9% (12)Unmarried:
58.1% (17)
Women who did not give birth in the past 12 months Now married:
22.5% (469)Unmarried:
77.5% (1,617)
Marital status - American Indian / Alaska Native population 15 years and over
Males 40.1% Never married53.3% Now married0.0% Separated0.0% Widowed6.6% DivorcedFemales 0.0% Never married42.9% Now married0.0% Separated57.1% Widowed0.0% DivorcedMarital status - Asian population 15 years and over
Males 39.0% Never married40.3% Now married0.0% Separated0.0% Widowed20.8% DivorcedFemales 61.2% Never married19.0% Now married0.0% Separated19.8% Widowed0.0% DivorcedWomen who did not give birth in the past 12 months Now married:
0.0% (0)Unmarried:
100.0% (39)
Marital status - Other race population 15 years and over
Males 43.1% Never married37.8% Now married3.4% Separated6.0% Widowed9.6% DivorcedFemales 36.7% Never married42.8% Now married3.7% Separated14.9% Widowed1.8% DivorcedWomen who gave birth in the past 12 months Now married:
25.3% (20)Unmarried:
74.7% (60)
Women who did not give birth in the past 12 months Now married:
42.0% (426)Unmarried:
58.0% (589)
Marital status - Two or more races population 15 years and over
Males 76.1% Never married23.9% Now married0.0% Separated0.0% Widowed0.0% DivorcedFemales 52.2% Never married23.9% Now married2.0% Separated11.6% Widowed10.2% DivorcedWomen who gave birth in the past 12 months Now married:
100.0% (94)Unmarried:
0.0% (0)
Women who did not give birth in the past 12 months Now married:
8.8% (47)Unmarried:
91.2% (488)
Marital status - White alone, not Hispanic / Latino population 15 years and over
Males 57.8% Never married16.1% Now married4.9% Separated0.0% Widowed21.1% DivorcedFemales 52.9% Never married14.3% Now married0.0% Separated25.7% Widowed7.1% DivorcedWomen who did not give birth in the past 12 months Now married:
24.2% (15)Unmarried:
75.8% (45)
Marital status - Hispanic or Latino population 15 years and over
Males 49.2% Never married41.7% Now married1.3% Separated2.6% Widowed5.3% DivorcedFemales 37.7% Never married41.2% Now married6.7% Separated10.7% Widowed3.8% DivorcedWomen who gave birth in the past 12 months Now married:
43.6% (98)Unmarried:
56.4% (127)
Women who did not give birth in the past 12 months Now married:
41.6% (1,135)Unmarried:
58.4% (1,594)
Ancestries in West Rancho Dominguez
376 2.2% African118 0.7% American29 0.2% Belizean27 0.2% Ghanaian22 0.1% Irish21 0.1% Egyptian16 0.09% Israeli9 0.05% English5 0.03% Armenian4 0.02% Polish4 0.02% Scottish
Children Nativity (place of birth) in West Rancho Dominguez
Children under 6 years - Living with two parents Both parents native 385 100.0% NativeBoth parents foreign-born 141 100.0% NativeOne native, one foreign-born parent 183 100.0% NativeChildren under 6 years - Living with one parent Native parent 683 100.0% NativeForeign-born parent 64 100.0% NativeChildren 6 to 17 years - Living with two parents Both parents native 717 100.0% NativeBoth parents foreign-born 696 94.5% Native41 5.5% Foreign-bornOne native, one foreign-born parent 231 100.0% NativeChildren 6 to 17 years - Living with one parent Native parent 1,481 100.0% NativeForeign-born parent 321 50.0% Native320 50.0% Foreign-born
Grandparents responsible for own grandchildren in West Rancho Dominguez
Grandparents (30 to 59 years) White / Caucasian 16 10.8% Responsible for grandchildren132 89.2% Not responsible for grandchildrenBlack or African American 24 42.2% Responsible for grandchildren33 57.8% Not responsible for grandchildrenOther race 40 29.9% Responsible for grandchildren94 70.1% Not responsible for grandchildrenHispanic or Latino 58 16.7% Responsible for grandchildren289 83.3% Not responsible for grandchildrenGrandparents (60 years and over) White / Caucasian 5 1.8% Responsible for grandchildren287 98.2% Not responsible for grandchildrenBlack or African American 30 14.2% Responsible for grandchildren183 85.8% Not responsible for grandchildrenOther race 83 75.7% Responsible for grandchildren27 24.3% Not responsible for grandchildrenHispanic or Latino 76 16.4% Responsible for grandchildren389 83.6% Not responsible for grandchildren