Races in Westwood, Massachusetts (MA) Detailed Stats
Ancestries, Foreign-born residents, place of birth

Recent posts about races in Westwood, Massachusetts on our local forum with over 2,400,000 registered users:
 | 2023 Real Estate Observations (5278 replies) |
| Needham or WestWood...? (18 replies) |
| towns that offer the most jobs per dollar of house (58 replies) |
| 2021 Real Estate Observations (1729 replies) |
| Boston job possibility.. (142 replies) |
| Weston Wellesley vs Medfield, Westwood etc (41 replies) |
Latest news about races in Westwood, MA collected exclusively by city-data.com from local newspapers, TV, and radio stations
8.9% of Westwood, MA residents are foreign-born (3.7% born in Europe, 3.4% born in Asia, 0.9% born in North America), which is 102.3% less than the foreign-born rate of 18.0% across the entire state of Massachusetts.
Race distribution in Westwood

- 13,46095.3%White alone
- 3502.5%Asian alone
- 1320.9%Hispanic
- 930.7%Two or more races
- 630.4%Black alone
- 130.09%Other race alone
- 60.04%American Indian alone

2000
2022
-
- 5,198,35981.9%White alone
- 428,7296.8%Hispanic
- 318,3295.0%Black alone
- 236,7863.7%Asian alone
- 110,3381.7%Two or more races
- 43,5860.7%Other race alone
- 11,2640.2%American Indian alone
- 1,7060.03%Native Hawaiian and Other
Pacific Islander alone

-
- 4,676,62767.0%White alone
- 911,03813.0%Hispanic
- 501,4637.2%Asian alone
- 459,7406.6%Black alone
- 341,8894.9%Two or more races
- 84,4031.2%Other race alone
- 5,8380.08%American Indian alone
- 9760.01%Native Hawaiian and Other
Pacific Islander alone

Income and house value in Westwood
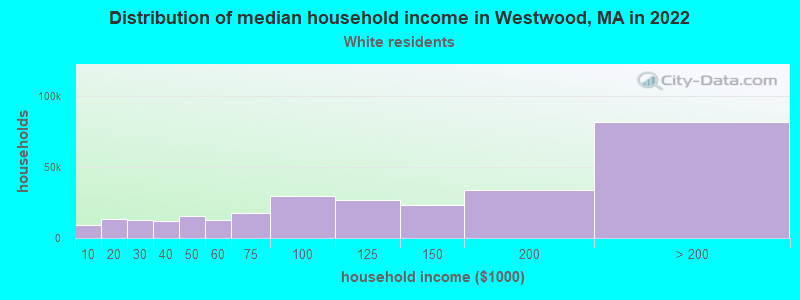
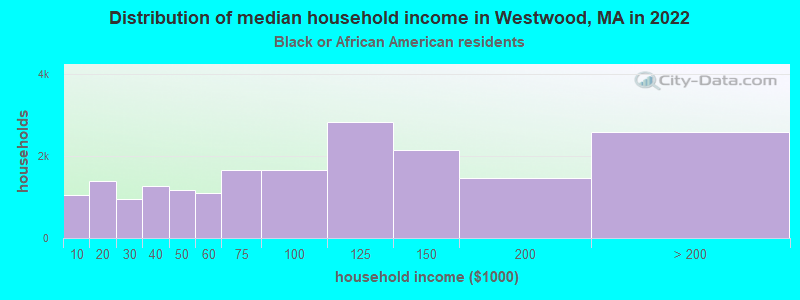
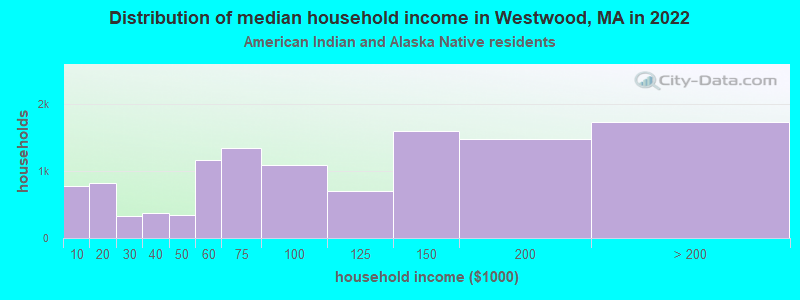
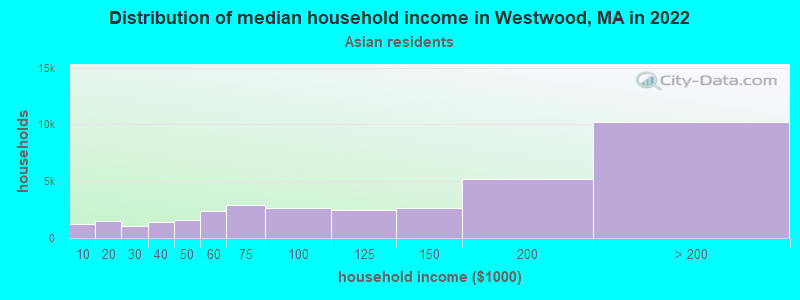
- Median household income in 2022
- $163,028White non-Hispanic householders
- $105,696Black householders
- $142,745American Indian and Alaska Native householders
- $146,678Asian householders
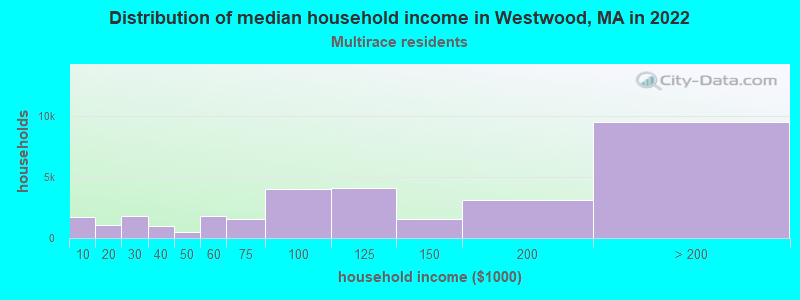
- over $200,000Two or more races householders
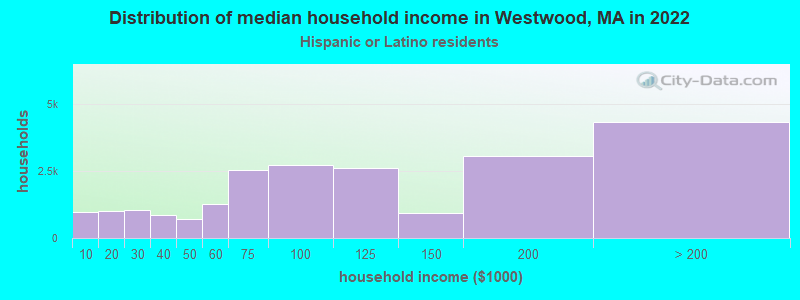
- $174,690Hispanic or Latino race householders
- Median 2022 house value
- over $1,000,000White Non-Hispanic householders
- $646,118Black or African American householders
- over $1,000,000Asian householders
- over $1,000,000Two or more races householders
- $622,283Hispanic or Latino householders
Household income for White non-Hispanic householders
Household income for Black householders
Household income for American Indian and Alaska Native householders
Household income for Asian householders
Household income for Two or more races householders
Household income for Hispanic or Latino race householders
Foreign-born residents in Westwood
1,256 residents are foreign born (3.7% Europe, 3.4% Asia, 0.9% North America).
| This city: | 8.9% |
| Massachusetts: | 12.2% |
Ancestries in Westwood

- 4,74428.4%Irish
- 2,29013.7%Italian
- 1,94111.6%English
- 1,78510.7%Other
- 1,1917.1%German
- 5633.4%Polish
- 5273.2%United States
- 4702.8%Scottish
- 4362.6%Arab
- 3622.2%French
- 3592.2%French Canadian
- 3412.0%Greek
- 3272.0%Swedish
- 2941.8%Russian
- 2941.8%Scotch-Irish
- 1821.1%Lithuanian
- 1070.6%Portuguese
- 1050.6%Norwegian
- 910.5%Dutch
- 820.5%Ukrainian
- 590.4%Welsh
- 360.2%Hungarian
- 340.2%Swiss
- 250.1%Czech
- 190.1%Subsaharan African
- 160.10%West Indian

Zip codes: 02090.