Races in White City, Oregon (OR) Detailed Stats
Data:
Races - White alone (%)
Races - White alone (% change since 2000)
Races - Black alone (%)
Races - Black alone (% change since 2000)
Races - American Indian alone (%)
Races - American Indian alone (% change since 2000)
Races - Asian alone (%)
Races - Asian alone (% change since 2000)
Races - Hispanic (%)
Races - Hispanic (% change since 2000)
Races - Native Hawaiian and Other Pacific Islander alone (%)
Races - Native Hawaiian and Other Pacific Islander alone (% change since 2000)
Races - Two or more races(%)
Races - Two or more races(% change since 2000)
Races - Other race alone (%)
Races - Other race alone (% change since 2000)
Racial diversity
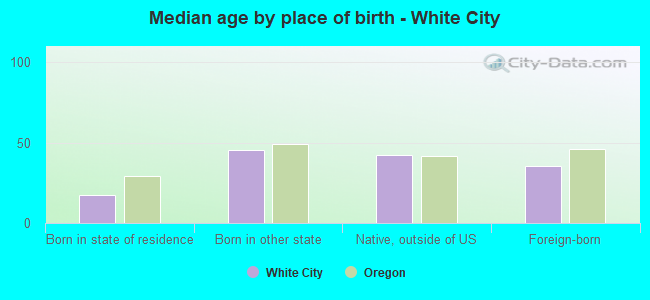
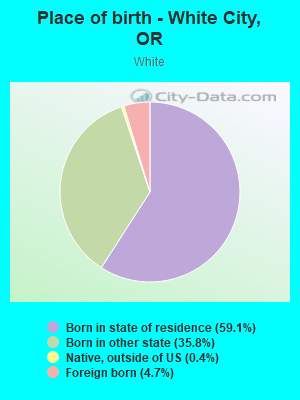
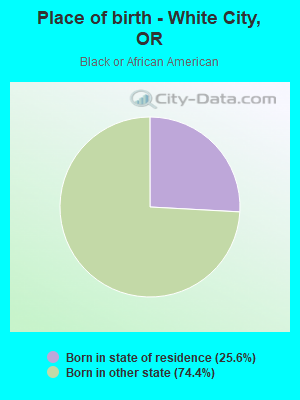
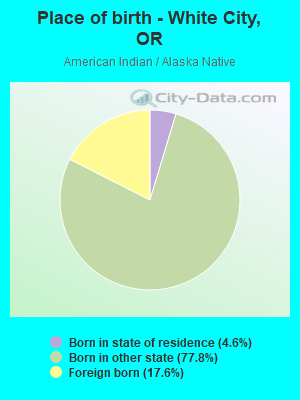
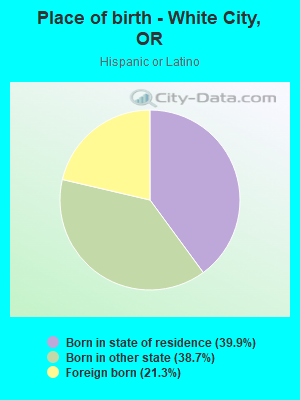
Place of birth - Born in state of residence (%)
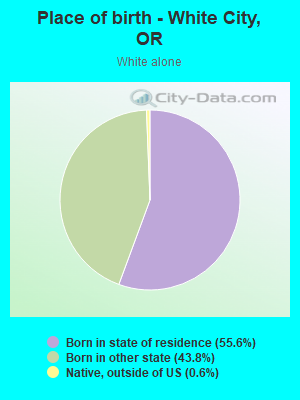
Place of birth - Born in state of residence (%) - White
Place of birth - Born in state of residence (%) - Black or African American
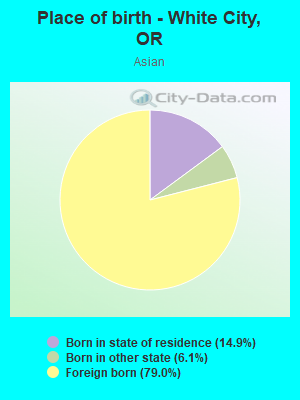
Place of birth - Born in state of residence (%) - Asian
Place of birth - Born in state of residence (%) - Hispanic or Latino
Place of birth - Born in state of residence (%) - American Indian and Alaska Native
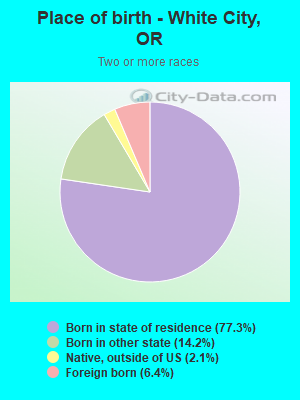
Place of birth - Born in state of residence (%) - Multirace
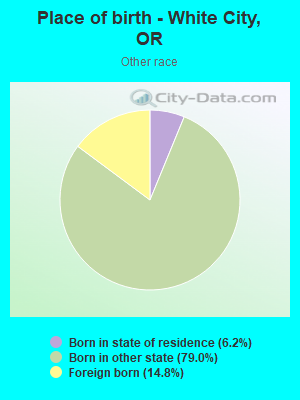
Place of birth - Born in state of residence (%) - Other Race
Place of birth - Born in other state (%)
Place of birth - Born in other state (%) - White
Place of birth - Born in other state (%) - Black or African American
Place of birth - Born in other state (%) - Asian
Place of birth - Born in other state (%) - Hispanic or Latino
Place of birth - Born in other state (%) - American Indian and Alaska Native
Place of birth - Born in other state (%) - Multirace
Place of birth - Born in other state (%) - Other Race
Place of birth - Native, outside of US (%)
Place of birth - Native, outside of US (%) - White
Place of birth - Native, outside of US (%) - Black or African American
Place of birth - Native, outside of US (%) - Asian
Place of birth - Native, outside of US (%) - Hispanic or Latino
Place of birth - Native, outside of US (%) - American Indian and Alaska Native
Place of birth - Native, outside of US (%) - Multirace
Place of birth - Native, outside of US (%) - Other Race
Place of birth - Foreign born (%)
Place of birth - Foreign born (%) - White
Place of birth - Foreign born (%) - Black or African American
Place of birth - Foreign born (%) - Asian
Place of birth - Foreign born (%) - Hispanic or Latino
Place of birth - Foreign born (%) - American Indian and Alaska Native
Place of birth - Foreign born (%) - Multirace
Place of birth - Foreign born (%) - Other Race
Residents speaking English at home (%)
Residents speaking English at home - Born in the United States (%)
Residents speaking English at home - Native, born elsewhere (%)
Residents speaking English at home - Foreign born (%)
Residents speaking Spanish at home (%)
Residents speaking Spanish at home - Born in the United States (%)
Residents speaking Spanish at home - Native, born elsewhere (%)
Residents speaking Spanish at home - Foreign born (%)
Residents speaking other language at home (%)
Residents speaking other language at home - Born in the United States (%)
Residents speaking other language at home - Native, born elsewhere (%)
Residents speaking other language at home - Foreign born (%)
Marital status - Never married (%)
Marital status - Now married (%)
Marital status - Separated (%)
Marital status - Widowed (%)
Marital status - Divorced (%)
Ancestries Reported - Arab (%)
Ancestries Reported - Czech (%)
Ancestries Reported - Danish (%)
Ancestries Reported - Dutch (%)
Ancestries Reported - English (%)
Ancestries Reported - French (%)
Ancestries Reported - French Canadian (%)
Ancestries Reported - German (%)
Ancestries Reported - Greek (%)
Ancestries Reported - Hungarian (%)
Ancestries Reported - Irish (%)
Ancestries Reported - Italian (%)
Ancestries Reported - Lithuanian (%)
Ancestries Reported - Norwegian (%)
Ancestries Reported - Polish (%)
Ancestries Reported - Portuguese (%)
Ancestries Reported - Russian (%)
Ancestries Reported - Scotch-Irish (%)
Ancestries Reported - Scottish (%)
Ancestries Reported - Slovak (%)
Ancestries Reported - Subsaharan African (%)
Ancestries Reported - Swedish (%)
Ancestries Reported - Swiss (%)
Ancestries Reported - Ukrainian (%)
Ancestries Reported - United States (%)
Ancestries Reported - Welsh (%)
Ancestries Reported - West Indian (%)
Ancestries Reported - Other (%)
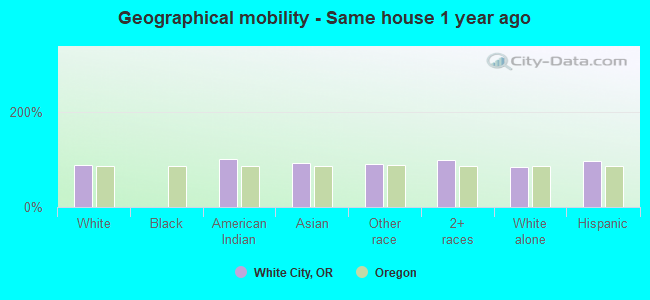
Geographical mobility - Same house 1 year ago (%)
Geographical mobility - Same house 1 year ago (%) - White
Geographical mobility - Same house 1 year ago (%) - Black or African American
Geographical mobility - Same house 1 year ago (%) - Asian
Geographical mobility - Same house 1 year ago (%) - Hispanic or Latino
Geographical mobility - Same house 1 year ago (%) - American Indian and Alaska Native
Geographical mobility - Same house 1 year ago (%) - Multirace
Geographical mobility - Same house 1 year ago (%) - Other Race
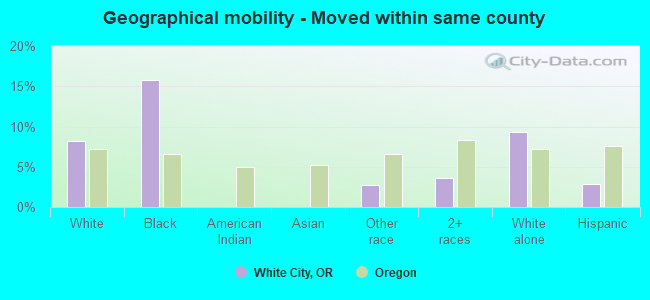
Geographical mobility - Moved within same county (%)
Geographical mobility - Moved within same county (%) - White
Geographical mobility - Moved within same county (%) - Black or African American
Geographical mobility - Moved within same county (%) - Asian
Geographical mobility - Moved within same county (%) - Hispanic or Latino
Geographical mobility - Moved within same county (%) - American Indian and Alaska Native
Geographical mobility - Moved within same county (%) - Multirace
Geographical mobility - Moved within same county (%) - Other Race
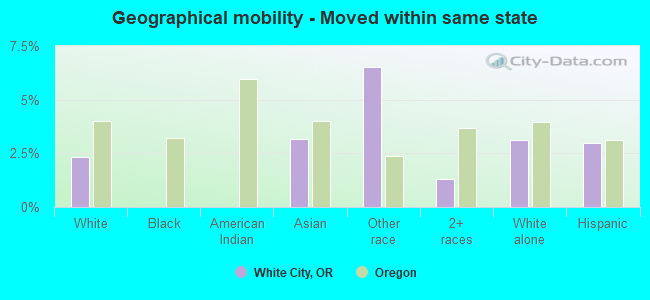
Geographical mobility - Moved from different county within same state (%)
Geographical mobility - Moved from different county within same state (%) - White
Geographical mobility - Moved from different county within same state (%) - Black or African American
Geographical mobility - Moved from different county within same state (%) - Asian
Geographical mobility - Moved from different county within same state (%) - Hispanic or Latino
Geographical mobility - Moved from different county within same state (%) - American Indian and Alaska Native
Geographical mobility - Moved from different county within same state (%) - Multirace
Geographical mobility - Moved from different county within same state (%) - Other Race
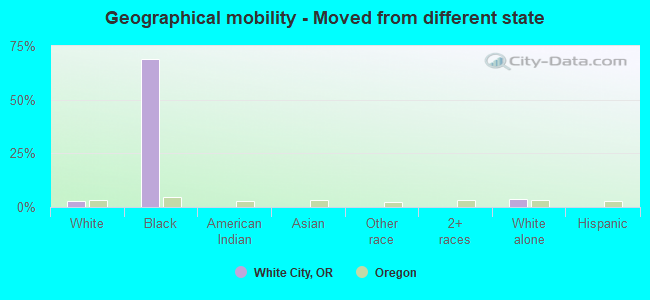
Geographical mobility - Moved from different state (%)
Geographical mobility - Moved from different state (%) - White
Geographical mobility - Moved from different state (%) - Black or African American
Geographical mobility - Moved from different state (%) - Asian
Geographical mobility - Moved from different state (%) - Hispanic or Latino
Geographical mobility - Moved from different state (%) - American Indian and Alaska Native
Geographical mobility - Moved from different state (%) - Multirace
Geographical mobility - Moved from different state (%) - Other Race
Geographical mobility - Moved from abroad (%)
Geographical mobility - Moved from abroad (%) - White
Geographical mobility - Moved from abroad (%) - Black or African American
Geographical mobility - Moved from abroad (%) - Asian
Geographical mobility - Moved from abroad (%) - Hispanic or Latino
Geographical mobility - Moved from abroad (%) - American Indian and Alaska Native
Geographical mobility - Moved from abroad (%) - Multirace
Geographical mobility - Moved from abroad (%) - Other Race
Place of birth for the foreign-born population - Ireland (%)
Place of birth for the foreign-born population - Denmark (%)
Place of birth for the foreign-born population - Norway (%)
Place of birth for the foreign-born population - Sweden (%)
Place of birth for the foreign-born population - United Kingdom (%)
Place of birth for the foreign-born population - England (%)
Place of birth for the foreign-born population - Scotland (%)
Place of birth for the foreign-born population - Other Northern Europe (%)
Place of birth for the foreign-born population - Austria (%)
Place of birth for the foreign-born population - Belgium (%)
Place of birth for the foreign-born population - France (%)
Place of birth for the foreign-born population - Germany (%)
Place of birth for the foreign-born population - Netherlands (%)
Place of birth for the foreign-born population - Switzerland (%)
Place of birth for the foreign-born population - Other Western Europe (%)
Place of birth for the foreign-born population - Greece (%)
Place of birth for the foreign-born population - Italy (%)
Place of birth for the foreign-born population - Portugal (%)
Place of birth for the foreign-born population - Spain (%)
Place of birth for the foreign-born population - Other Southern Europe (%)
Place of birth for the foreign-born population - Albania (%)
Place of birth for the foreign-born population - Belarus (%)
Place of birth for the foreign-born population - Bosnia and Herzegovina (%)
Place of birth for the foreign-born population - Bulgaria (%)
Place of birth for the foreign-born population - Croatia (%)
Place of birth for the foreign-born population - Czechoslovakia (%)
Place of birth for the foreign-born population - Hungary (%)
Place of birth for the foreign-born population - Latvia (%)
Place of birth for the foreign-born population - Lithuania (%)
Place of birth for the foreign-born population - North Macedonia (Macedonia) (%)
Place of birth for the foreign-born population - Moldova (%)
Place of birth for the foreign-born population - Poland (%)
Place of birth for the foreign-born population - Romania (%)
Place of birth for the foreign-born population - Russia (%)
Place of birth for the foreign-born population - Serbia (%)
Place of birth for the foreign-born population - Ukraine (%)
Place of birth for the foreign-born population - Other Eastern Europe (%)
Place of birth for the foreign-born population - China (%)
Place of birth for the foreign-born population - Hong Kong (%)
Place of birth for the foreign-born population - Taiwan (%)
Place of birth for the foreign-born population - Japan (%)
Place of birth for the foreign-born population - Korea (%)
Place of birth for the foreign-born population - Other Eastern Asia (%)
Place of birth for the foreign-born population - Afghanistan (%)
Place of birth for the foreign-born population - Bangladesh (%)
Place of birth for the foreign-born population - India (%)
Place of birth for the foreign-born population - Iran (%)
Place of birth for the foreign-born population - Kazakhstan (%)
Place of birth for the foreign-born population - Nepal (%)
Place of birth for the foreign-born population - Pakistan (%)
Place of birth for the foreign-born population - Sri Lanka (%)
Place of birth for the foreign-born population - Uzbekistan (%)
Place of birth for the foreign-born population - Other South Central Asia (%)
Place of birth for the foreign-born population - Burma (%)
Place of birth for the foreign-born population - Cambodia (%)
Place of birth for the foreign-born population - Indonesia (%)
Place of birth for the foreign-born population - Laos (%)
Place of birth for the foreign-born population - Malaysia (%)
Place of birth for the foreign-born population - Philippines (%)
Place of birth for the foreign-born population - Singapore (%)
Place of birth for the foreign-born population - Thailand (%)
Place of birth for the foreign-born population - Vietnam (%)
Place of birth for the foreign-born population - Other South Eastern Asia (%)
Place of birth for the foreign-born population - Armenia (%)
Place of birth for the foreign-born population - Iraq (%)
Place of birth for the foreign-born population - Israel (%)
Place of birth for the foreign-born population - Jordan (%)
Place of birth for the foreign-born population - Kuwait (%)
Place of birth for the foreign-born population - Lebanon (%)
Place of birth for the foreign-born population - Saudi Arabia (%)
Place of birth for the foreign-born population - Syria (%)
Place of birth for the foreign-born population - Turkey (%)
Place of birth for the foreign-born population - Yemen (%)
Place of birth for the foreign-born population - Other Western Asia (%)
Place of birth for the foreign-born population - Eritrea (%)
Place of birth for the foreign-born population - Ethiopia (%)
Place of birth for the foreign-born population - Kenya (%)
Place of birth for the foreign-born population - Somalia (%)
Place of birth for the foreign-born population - Uganda (%)
Place of birth for the foreign-born population - Zimbabwe (%)
Place of birth for the foreign-born population - Other Eastern Africa (%)
Place of birth for the foreign-born population - Cameroon (%)
Place of birth for the foreign-born population - Congo (%)
Place of birth for the foreign-born population - Democratic Republic of Congo (Zaire) (%)
Place of birth for the foreign-born population - Other Middle Africa (%)
Place of birth for the foreign-born population - Egypt (%)
Place of birth for the foreign-born population - Morocco (%)
Place of birth for the foreign-born population - Sudan (%)
Place of birth for the foreign-born population - Other Northern Africa (%)
Place of birth for the foreign-born population - South Africa (%)
Place of birth for the foreign-born population - Other Southern Africa (%)
Place of birth for the foreign-born population - Cabo Verde (%)
Place of birth for the foreign-born population - Ghana (%)
Place of birth for the foreign-born population - Liberia (%)
Place of birth for the foreign-born population - Nigeria (%)
Place of birth for the foreign-born population - Senegal (%)
Place of birth for the foreign-born population - Sierra Leone (%)
Place of birth for the foreign-born population - Other Western Africa (%)
Place of birth for the foreign-born population - Australia (%)
Place of birth for the foreign-born population - New Zealand (%)
Place of birth for the foreign-born population - Fiji (%)
Place of birth for the foreign-born population - Micronesia (%)
Place of birth for the foreign-born population - Bahamas (%)
Place of birth for the foreign-born population - Barbados (%)
Place of birth for the foreign-born population - Cuba (%)
Place of birth for the foreign-born population - Dominica (%)
Place of birth for the foreign-born population - Dominican Republic (%)
Place of birth for the foreign-born population - Grenada (%)
Place of birth for the foreign-born population - Haiti (%)
Place of birth for the foreign-born population - Jamaica (%)
Place of birth for the foreign-born population - St. Vincent and the Grenadines (%)
Place of birth for the foreign-born population - Trinidad and Tobago (%)
Place of birth for the foreign-born population - West Indies (%)
Place of birth for the foreign-born population - Other Caribbean (%)
Place of birth for the foreign-born population - Belize (%)
Place of birth for the foreign-born population - Costa Rica (%)
Place of birth for the foreign-born population - El Salvador (%)
Place of birth for the foreign-born population - Guatemala (%)
Place of birth for the foreign-born population - Honduras (%)
Place of birth for the foreign-born population - Mexico (%)
Place of birth for the foreign-born population - Nicaragua (%)
Place of birth for the foreign-born population - Panama (%)
Place of birth for the foreign-born population - Other Central America (%)
Place of birth for the foreign-born population - Argentina (%)
Place of birth for the foreign-born population - Bolivia (%)
Place of birth for the foreign-born population - Brazil (%)
Place of birth for the foreign-born population - Chile (%)
Place of birth for the foreign-born population - Colombia (%)
Place of birth for the foreign-born population - Ecuador (%)
Place of birth for the foreign-born population - Guyana (%)
Place of birth for the foreign-born population - Peru (%)
Place of birth for the foreign-born population - Uruguay (%)
Place of birth for the foreign-born population - Venezuela (%)
Place of birth for the foreign-born population - Other South America (%)
Place of birth for the foreign-born population - Canada (%)
Place of birth for the foreign-born population - Other Northern America (%)
Place of birth for the foreign-born population - Other (%)
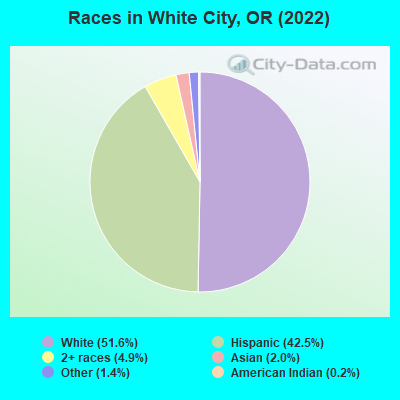
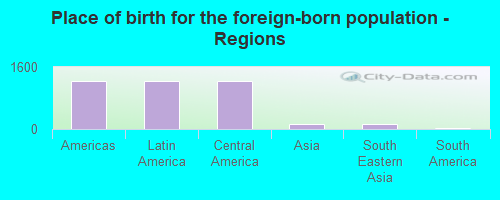
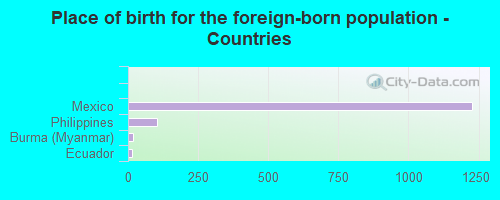
According to 2022 data, the most numerous races in White City, OR are White alone (5,719 residents), Hispanic (4,710 residents), and Two or more races (548 residents). 75.0% of White City residents speak English at home. 12.3% of White City, OR residents are foreign-born (11.0% born in Latin America), which is 27.1% greater than the foreign-born rate of 9.0% across the entire state of Oregon.
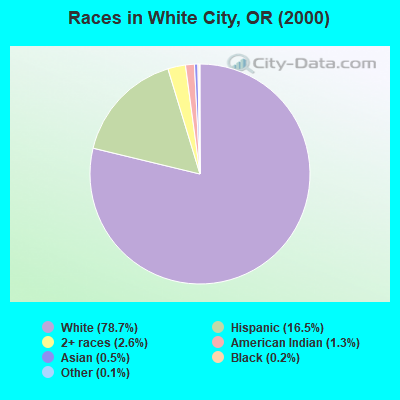
Race distribution in White City
2000 2022
2,857,616 83.5% White alone 275,314 8.0% Hispanic 100,333 2.9% Asian alone 82,733 2.4% Two or more races 53,325 1.6% Black alone 40,130 1.2% American Indian alone 7,398 0.2% Native Hawaiian and Other 4,550 0.1% Other race alone
3,037,571 71.6% White alone 609,538 14.4% Hispanic 252,744 6.0% Two or more races 191,283 4.5% Asian alone 78,228 1.8% Black alone 29,399 0.7% American Indian alone 25,731 0.6% Other race alone 15,643 0.4% Native Hawaiian and Other
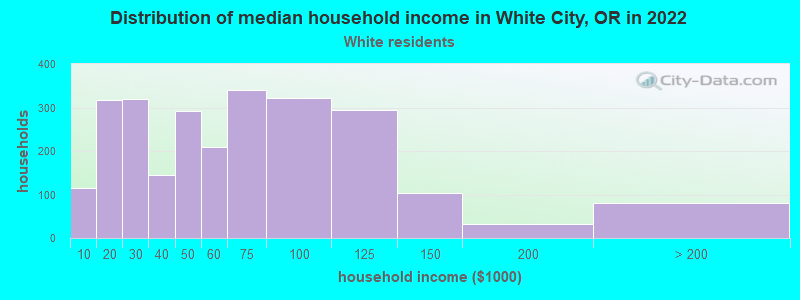
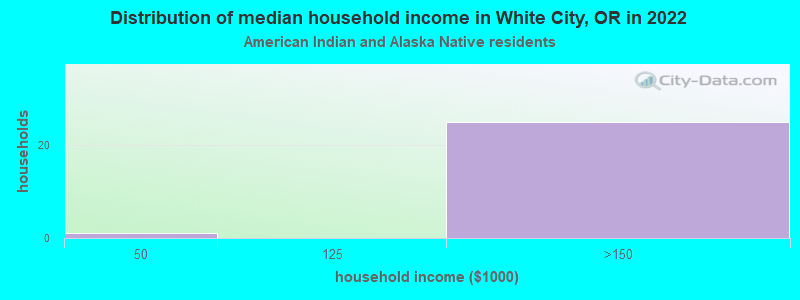
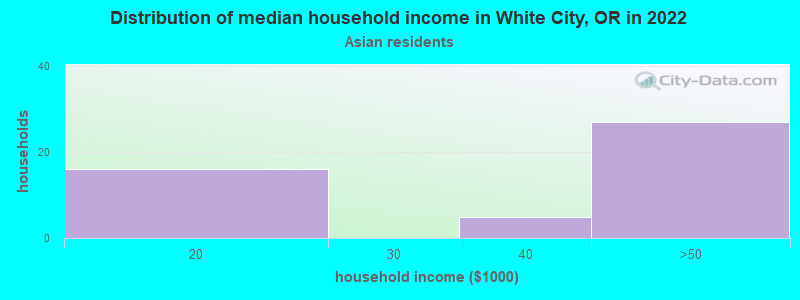
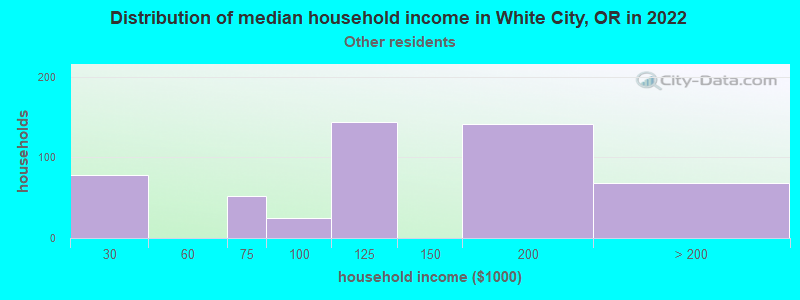
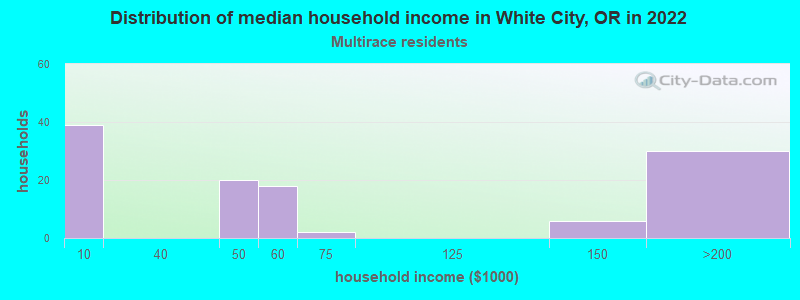
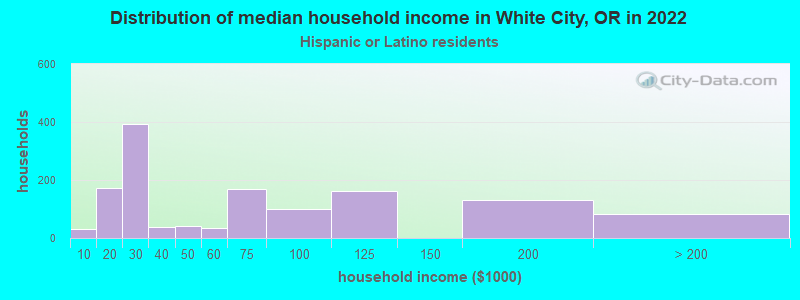
Income and house value in White City Median household income in 2022 $56,781 White non-Hispanic householders$107,361 Some other race householders$70,841 Hispanic or Latino race householdersMedian 2022 house value $337,820 White Non-Hispanic householders$321,914 American Indian or Alaska Native householders$359,786 Some other race householders$367,361 Two or more races householders$324,186 Hispanic or Latino householders
Median age by race in White City
35.8 Median age for White residents36.2 35.2 -788,461,537.7 Median age for Black or African American residents-668,358,713.4 -1,184,713,374.6 57.7 Median age for American Indian / Alaska Native residents-1,025,435,072.6 45.9 52.8 Median age for Asian residents-653,530,377.0 46.1 -764,705,881.6 Median age for Native Hawaiian / Pacific Islander residents-764,119,600.6 -774,891,774.1 34.1 Median age for Other race residents33.2 35.6 18.0 Median age for Two or more races residents35.4 17.0 40.1 Median age for White alone residents41.7 39.5 23.7 Median age for Hispanic or Latino residents18.9 26.8
Owner/renter occupied households by race in White City
House owners and renters - White residents 2,244 84.2% Owner occupied421 15.8% Renter occupiedHouse owners and renters - American Indian / Alaska Native residents 19 100.0% Owner occupiedHouse owners and renters - Asian residents 103 100.0% Owner occupiedHouse owners and renters - Other race residents 576 100.0% Owner occupiedHouse owners and renters - Two or more races residents 86 62.0% Owner occupied53 38.0% Renter occupiedHouse owners and renters - White alone residents 1,735 80.8% Owner occupied412 19.2% Renter occupiedHouse owners and renters - Hispanic or Latino residents 784 92.3% Owner occupied66 7.7% Renter occupied
Language usage in White City
English speakers - Total 75.0% of residents of White City speak English at home.
18.8% of residents speak Spanish at home 1,141 61.0% Speak English very well728 39.0% Speak English less than very well1.9% of residents speak other language at home 112 59.3% Speak English very well77 40.7% Speak English less than very well
English speakers - Born in the United States 84.3% of residents of White City speak English at home.
14.5% of residents speak Spanish at home 416 69.0% Speak English very well187 31.0% Speak English less than very well0.6% of residents speak other language at home 15 65.2% Speak English very well8 34.8% Speak English less than very well
All residents speak only English at home
English speakers - Foreign-born 12.9% of residents of White City speak English at home.
75.3% of residents speak Spanish at home 323 36.5% Speak English very well563 63.5% Speak English less than very well9.0% of residents speak other language at home 40 37.7% Speak English very well66 62.3% Speak English less than very well
White (Caucasian) - Speak only English Native:
91.8% (5,801)Foreign-born:
30.2% (104)
White (Caucasian) - Speak another language Native:
6.3% (397)Foreign-born:
100.0% (344)
Asian - Speak only English Native:
100.0% (51)Foreign-born:
13.1% (23)
Other race - Speak only English Native:
59.7% (1,414)Foreign-born:
3.0% (16)
Other race - Speak another language Native:
39.2% (929)Foreign-born:
99.7% (531)
Two or more races - Speak another language Native:
14.9% (119)Foreign-born:
100.0% (76)
Hispanic or Latino - Speak only English Native:
52.7% (1,448)Foreign-born:
9.8% (97)
Hispanic or Latino - Speak another language Native:
36.2% (995)Foreign-born:
90.0% (891)
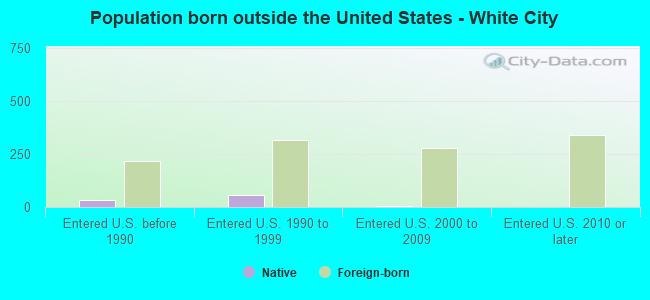
Foreign-born residents in White City 1,367 residents are foreign born (11.0% Latin America ).
This city:
12.3%Oregon:
9.8%
Marital status for residents in White City Marital status - White (Caucasian) population 15 years and over
Males 32.9% Never married44.2% Now married2.1% Separated3.6% Widowed17.1% DivorcedFemales 28.1% Never married45.2% Now married0.1% Separated10.6% Widowed16.1% DivorcedWomen who gave birth in the past 12 months Now married:
93.5% (118)Unmarried:
6.5% (8)
Women who did not give birth in the past 12 months Now married:
43.7% (621)Unmarried:
56.3% (800)
Marital status - American Indian / Alaska Native population 15 years and over
Males 0.0% Never married100.0% Now married0.0% Separated0.0% Widowed0.0% DivorcedFemales 0.0% Never married100.0% Now married0.0% Separated0.0% Widowed0.0% DivorcedWomen who did not give birth in the past 12 months Now married:
100.0% (26)Unmarried:
0.0% (0)
Marital status - Asian population 15 years and over
Males 73.9% Never married26.1% Now married0.0% Separated0.0% Widowed0.0% DivorcedFemales 10.3% Never married41.2% Now married0.0% Separated45.6% Widowed2.9% DivorcedWomen who gave birth in the past 12 months Now married:
100.0% (26)Unmarried:
0.0% (0)
Women who did not give birth in the past 12 months Now married:
63.3% (32)Unmarried:
36.7% (19)
Marital status - Other race population 15 years and over
Males 44.4% Never married45.0% Now married0.0% Separated10.6% Widowed0.0% DivorcedFemales 47.1% Never married38.4% Now married0.0% Separated8.5% Widowed6.0% DivorcedWomen who did not give birth in the past 12 months Now married:
40.6% (361)Unmarried:
59.4% (529)
Marital status - Two or more races population 15 years and over
Males 28.1% Never married48.3% Now married0.0% Separated0.0% Widowed23.6% DivorcedFemales 51.3% Never married10.2% Now married0.0% Separated6.0% Widowed32.5% DivorcedWomen who gave birth in the past 12 months Now married:
0.0% (0)Unmarried:
100.0% (49)
Women who did not give birth in the past 12 months Now married:
6.4% (12)Unmarried:
93.6% (176)
Marital status - White alone, not Hispanic / Latino population 15 years and over
Males 34.2% Never married39.7% Now married0.4% Separated4.5% Widowed21.1% DivorcedFemales 21.7% Never married45.7% Now married0.1% Separated12.9% Widowed19.5% DivorcedWomen who gave birth in the past 12 months Now married:
85.9% (53)Unmarried:
14.1% (9)
Women who did not give birth in the past 12 months Now married:
47.7% (539)Unmarried:
52.3% (591)
Marital status - Hispanic or Latino population 15 years and over
Males 35.5% Never married51.6% Now married4.2% Separated5.4% Widowed3.2% DivorcedFemales 51.6% Never married37.8% Now married0.0% Separated5.2% Widowed5.4% DivorcedWomen who gave birth in the past 12 months Now married:
100.0% (77)Unmarried:
0.0% (0)
Women who did not give birth in the past 12 months Now married:
34.8% (396)Unmarried:
65.2% (743)
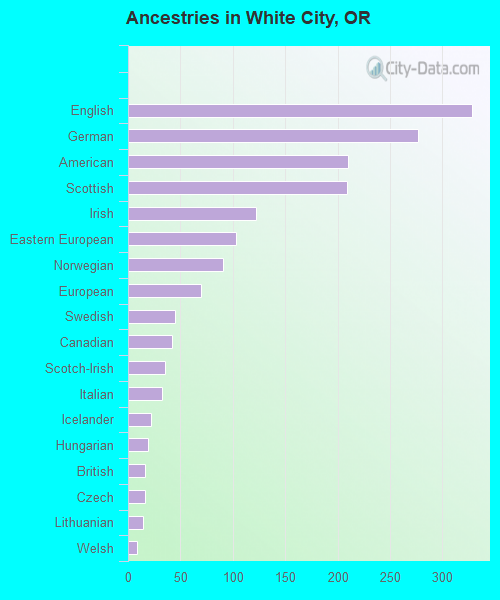
Ancestries in White City
328 6.1% English277 5.2% German210 3.9% American209 3.9% Scottish122 2.3% Irish103 1.9% Eastern European91 1.7% Norwegian70 1.3% European45 0.8% Swedish42 0.8% Canadian35 0.7% Scotch-Irish32 0.6% Italian22 0.4% Icelander19 0.4% Hungarian16 0.3% British16 0.3% Czech14 0.3% Lithuanian9 0.2% Welsh
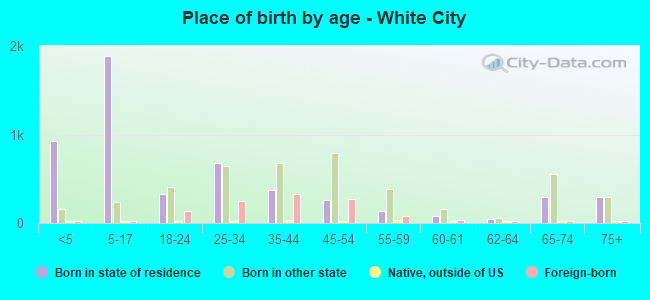
Children Nativity (place of birth) in White City
Children under 6 years - Living with two parents Both parents native 309 100.0% NativeBoth parents foreign-born 268 100.0% NativeChildren under 6 years - Living with one parent Native parent 330 100.0% NativeForeign-born parent 148 100.0% NativeChildren 6 to 17 years - Living with two parents Both parents native 750 100.0% NativeBoth parents foreign-born 331 100.0% NativeOne native, one foreign-born parent 40 100.0% NativeChildren 6 to 17 years - Living with one parent Native parent 496 100.0% NativeForeign-born parent 347 50.1% Native347 49.9% Foreign-born
Grandparents responsible for own grandchildren in White City
Grandparents (30 to 59 years) White / Caucasian 57 30.8% Responsible for grandchildren129 69.2% Not responsible for grandchildrenAsian 48 100.0% Not responsible for grandchildrenOther race 194 100.0% Responsible for grandchildrenTwo or more races 14 100.0% Responsible for grandchildrenWhite alone, not Hispanic / Latino 60 32.5% Responsible for grandchildren124 67.5% Not responsible for grandchildrenHispanic or Latino 130 84.6% Responsible for grandchildren24 15.4% Not responsible for grandchildrenGrandparents (60 years and over) White / Caucasian 20 35.4% Responsible for grandchildren37 64.6% Not responsible for grandchildrenAsian 10 100.0% Not responsible for grandchildrenTwo or more races 35 100.0% Responsible for grandchildrenWhite alone, not Hispanic / Latino 22 38.4% Responsible for grandchildren36 61.6% Not responsible for grandchildren