Races in White Marsh, Maryland (MD) Detailed Stats
Data:
Races - White alone (%)
Races - White alone (% change since 2000)
Races - Black alone (%)
Races - Black alone (% change since 2000)
Races - American Indian alone (%)
Races - American Indian alone (% change since 2000)
Races - Asian alone (%)
Races - Asian alone (% change since 2000)
Races - Hispanic (%)
Races - Hispanic (% change since 2000)
Races - Native Hawaiian and Other Pacific Islander alone (%)
Races - Native Hawaiian and Other Pacific Islander alone (% change since 2000)
Races - Two or more races(%)
Races - Two or more races(% change since 2000)
Races - Other race alone (%)
Races - Other race alone (% change since 2000)
Racial diversity
Place of birth - Born in state of residence (%)
Place of birth - Born in state of residence (%) - White
Place of birth - Born in state of residence (%) - Black or African American
Place of birth - Born in state of residence (%) - Asian
Place of birth - Born in state of residence (%) - Hispanic or Latino
Place of birth - Born in state of residence (%) - American Indian and Alaska Native
Place of birth - Born in state of residence (%) - Multirace
Place of birth - Born in state of residence (%) - Other Race
Place of birth - Born in other state (%)
Place of birth - Born in other state (%) - White
Place of birth - Born in other state (%) - Black or African American
Place of birth - Born in other state (%) - Asian
Place of birth - Born in other state (%) - Hispanic or Latino
Place of birth - Born in other state (%) - American Indian and Alaska Native
Place of birth - Born in other state (%) - Multirace
Place of birth - Born in other state (%) - Other Race
Place of birth - Native, outside of US (%)
Place of birth - Native, outside of US (%) - White
Place of birth - Native, outside of US (%) - Black or African American
Place of birth - Native, outside of US (%) - Asian
Place of birth - Native, outside of US (%) - Hispanic or Latino
Place of birth - Native, outside of US (%) - American Indian and Alaska Native
Place of birth - Native, outside of US (%) - Multirace
Place of birth - Native, outside of US (%) - Other Race
Place of birth - Foreign born (%)
Place of birth - Foreign born (%) - White
Place of birth - Foreign born (%) - Black or African American
Place of birth - Foreign born (%) - Asian
Place of birth - Foreign born (%) - Hispanic or Latino
Place of birth - Foreign born (%) - American Indian and Alaska Native
Place of birth - Foreign born (%) - Multirace
Place of birth - Foreign born (%) - Other Race
Residents speaking English at home (%)
Residents speaking English at home - Born in the United States (%)
Residents speaking English at home - Native, born elsewhere (%)
Residents speaking English at home - Foreign born (%)
Residents speaking Spanish at home (%)
Residents speaking Spanish at home - Born in the United States (%)
Residents speaking Spanish at home - Native, born elsewhere (%)
Residents speaking Spanish at home - Foreign born (%)
Residents speaking other language at home (%)
Residents speaking other language at home - Born in the United States (%)
Residents speaking other language at home - Native, born elsewhere (%)
Residents speaking other language at home - Foreign born (%)
Marital status - Never married (%)
Marital status - Now married (%)
Marital status - Separated (%)
Marital status - Widowed (%)
Marital status - Divorced (%)
Ancestries Reported - Arab (%)
Ancestries Reported - Czech (%)
Ancestries Reported - Danish (%)
Ancestries Reported - Dutch (%)
Ancestries Reported - English (%)
Ancestries Reported - French (%)
Ancestries Reported - French Canadian (%)
Ancestries Reported - German (%)
Ancestries Reported - Greek (%)
Ancestries Reported - Hungarian (%)
Ancestries Reported - Irish (%)
Ancestries Reported - Italian (%)
Ancestries Reported - Lithuanian (%)
Ancestries Reported - Norwegian (%)
Ancestries Reported - Polish (%)
Ancestries Reported - Portuguese (%)
Ancestries Reported - Russian (%)
Ancestries Reported - Scotch-Irish (%)
Ancestries Reported - Scottish (%)
Ancestries Reported - Slovak (%)
Ancestries Reported - Subsaharan African (%)
Ancestries Reported - Swedish (%)
Ancestries Reported - Swiss (%)
Ancestries Reported - Ukrainian (%)
Ancestries Reported - United States (%)
Ancestries Reported - Welsh (%)
Ancestries Reported - West Indian (%)
Ancestries Reported - Other (%)
Geographical mobility - Same house 1 year ago (%)
Geographical mobility - Same house 1 year ago (%) - White
Geographical mobility - Same house 1 year ago (%) - Black or African American
Geographical mobility - Same house 1 year ago (%) - Asian
Geographical mobility - Same house 1 year ago (%) - Hispanic or Latino
Geographical mobility - Same house 1 year ago (%) - American Indian and Alaska Native
Geographical mobility - Same house 1 year ago (%) - Multirace
Geographical mobility - Same house 1 year ago (%) - Other Race
Geographical mobility - Moved within same county (%)
Geographical mobility - Moved within same county (%) - White
Geographical mobility - Moved within same county (%) - Black or African American
Geographical mobility - Moved within same county (%) - Asian
Geographical mobility - Moved within same county (%) - Hispanic or Latino
Geographical mobility - Moved within same county (%) - American Indian and Alaska Native
Geographical mobility - Moved within same county (%) - Multirace
Geographical mobility - Moved within same county (%) - Other Race
Geographical mobility - Moved from different county within same state (%)
Geographical mobility - Moved from different county within same state (%) - White
Geographical mobility - Moved from different county within same state (%) - Black or African American
Geographical mobility - Moved from different county within same state (%) - Asian
Geographical mobility - Moved from different county within same state (%) - Hispanic or Latino
Geographical mobility - Moved from different county within same state (%) - American Indian and Alaska Native
Geographical mobility - Moved from different county within same state (%) - Multirace
Geographical mobility - Moved from different county within same state (%) - Other Race
Geographical mobility - Moved from different state (%)
Geographical mobility - Moved from different state (%) - White
Geographical mobility - Moved from different state (%) - Black or African American
Geographical mobility - Moved from different state (%) - Asian
Geographical mobility - Moved from different state (%) - Hispanic or Latino
Geographical mobility - Moved from different state (%) - American Indian and Alaska Native
Geographical mobility - Moved from different state (%) - Multirace
Geographical mobility - Moved from different state (%) - Other Race
Geographical mobility - Moved from abroad (%)
Geographical mobility - Moved from abroad (%) - White
Geographical mobility - Moved from abroad (%) - Black or African American
Geographical mobility - Moved from abroad (%) - Asian
Geographical mobility - Moved from abroad (%) - Hispanic or Latino
Geographical mobility - Moved from abroad (%) - American Indian and Alaska Native
Geographical mobility - Moved from abroad (%) - Multirace
Geographical mobility - Moved from abroad (%) - Other Race
Place of birth for the foreign-born population - Ireland (%)
Place of birth for the foreign-born population - Denmark (%)
Place of birth for the foreign-born population - Norway (%)
Place of birth for the foreign-born population - Sweden (%)
Place of birth for the foreign-born population - United Kingdom (%)
Place of birth for the foreign-born population - England (%)
Place of birth for the foreign-born population - Scotland (%)
Place of birth for the foreign-born population - Other Northern Europe (%)
Place of birth for the foreign-born population - Austria (%)
Place of birth for the foreign-born population - Belgium (%)
Place of birth for the foreign-born population - France (%)
Place of birth for the foreign-born population - Germany (%)
Place of birth for the foreign-born population - Netherlands (%)
Place of birth for the foreign-born population - Switzerland (%)
Place of birth for the foreign-born population - Other Western Europe (%)
Place of birth for the foreign-born population - Greece (%)
Place of birth for the foreign-born population - Italy (%)
Place of birth for the foreign-born population - Portugal (%)
Place of birth for the foreign-born population - Spain (%)
Place of birth for the foreign-born population - Other Southern Europe (%)
Place of birth for the foreign-born population - Albania (%)
Place of birth for the foreign-born population - Belarus (%)
Place of birth for the foreign-born population - Bosnia and Herzegovina (%)
Place of birth for the foreign-born population - Bulgaria (%)
Place of birth for the foreign-born population - Croatia (%)
Place of birth for the foreign-born population - Czechoslovakia (%)
Place of birth for the foreign-born population - Hungary (%)
Place of birth for the foreign-born population - Latvia (%)
Place of birth for the foreign-born population - Lithuania (%)
Place of birth for the foreign-born population - North Macedonia (Macedonia) (%)
Place of birth for the foreign-born population - Moldova (%)
Place of birth for the foreign-born population - Poland (%)
Place of birth for the foreign-born population - Romania (%)
Place of birth for the foreign-born population - Russia (%)
Place of birth for the foreign-born population - Serbia (%)
Place of birth for the foreign-born population - Ukraine (%)
Place of birth for the foreign-born population - Other Eastern Europe (%)
Place of birth for the foreign-born population - China (%)
Place of birth for the foreign-born population - Hong Kong (%)
Place of birth for the foreign-born population - Taiwan (%)
Place of birth for the foreign-born population - Japan (%)
Place of birth for the foreign-born population - Korea (%)
Place of birth for the foreign-born population - Other Eastern Asia (%)
Place of birth for the foreign-born population - Afghanistan (%)
Place of birth for the foreign-born population - Bangladesh (%)
Place of birth for the foreign-born population - India (%)
Place of birth for the foreign-born population - Iran (%)
Place of birth for the foreign-born population - Kazakhstan (%)
Place of birth for the foreign-born population - Nepal (%)
Place of birth for the foreign-born population - Pakistan (%)
Place of birth for the foreign-born population - Sri Lanka (%)
Place of birth for the foreign-born population - Uzbekistan (%)
Place of birth for the foreign-born population - Other South Central Asia (%)
Place of birth for the foreign-born population - Burma (%)
Place of birth for the foreign-born population - Cambodia (%)
Place of birth for the foreign-born population - Indonesia (%)
Place of birth for the foreign-born population - Laos (%)
Place of birth for the foreign-born population - Malaysia (%)
Place of birth for the foreign-born population - Philippines (%)
Place of birth for the foreign-born population - Singapore (%)
Place of birth for the foreign-born population - Thailand (%)
Place of birth for the foreign-born population - Vietnam (%)
Place of birth for the foreign-born population - Other South Eastern Asia (%)
Place of birth for the foreign-born population - Armenia (%)
Place of birth for the foreign-born population - Iraq (%)
Place of birth for the foreign-born population - Israel (%)
Place of birth for the foreign-born population - Jordan (%)
Place of birth for the foreign-born population - Kuwait (%)
Place of birth for the foreign-born population - Lebanon (%)
Place of birth for the foreign-born population - Saudi Arabia (%)
Place of birth for the foreign-born population - Syria (%)
Place of birth for the foreign-born population - Turkey (%)
Place of birth for the foreign-born population - Yemen (%)
Place of birth for the foreign-born population - Other Western Asia (%)
Place of birth for the foreign-born population - Eritrea (%)
Place of birth for the foreign-born population - Ethiopia (%)
Place of birth for the foreign-born population - Kenya (%)
Place of birth for the foreign-born population - Somalia (%)
Place of birth for the foreign-born population - Uganda (%)
Place of birth for the foreign-born population - Zimbabwe (%)
Place of birth for the foreign-born population - Other Eastern Africa (%)
Place of birth for the foreign-born population - Cameroon (%)
Place of birth for the foreign-born population - Congo (%)
Place of birth for the foreign-born population - Democratic Republic of Congo (Zaire) (%)
Place of birth for the foreign-born population - Other Middle Africa (%)
Place of birth for the foreign-born population - Egypt (%)
Place of birth for the foreign-born population - Morocco (%)
Place of birth for the foreign-born population - Sudan (%)
Place of birth for the foreign-born population - Other Northern Africa (%)
Place of birth for the foreign-born population - South Africa (%)
Place of birth for the foreign-born population - Other Southern Africa (%)
Place of birth for the foreign-born population - Cabo Verde (%)
Place of birth for the foreign-born population - Ghana (%)
Place of birth for the foreign-born population - Liberia (%)
Place of birth for the foreign-born population - Nigeria (%)
Place of birth for the foreign-born population - Senegal (%)
Place of birth for the foreign-born population - Sierra Leone (%)
Place of birth for the foreign-born population - Other Western Africa (%)
Place of birth for the foreign-born population - Australia (%)
Place of birth for the foreign-born population - New Zealand (%)
Place of birth for the foreign-born population - Fiji (%)
Place of birth for the foreign-born population - Micronesia (%)
Place of birth for the foreign-born population - Bahamas (%)
Place of birth for the foreign-born population - Barbados (%)
Place of birth for the foreign-born population - Cuba (%)
Place of birth for the foreign-born population - Dominica (%)
Place of birth for the foreign-born population - Dominican Republic (%)
Place of birth for the foreign-born population - Grenada (%)
Place of birth for the foreign-born population - Haiti (%)
Place of birth for the foreign-born population - Jamaica (%)
Place of birth for the foreign-born population - St. Vincent and the Grenadines (%)
Place of birth for the foreign-born population - Trinidad and Tobago (%)
Place of birth for the foreign-born population - West Indies (%)
Place of birth for the foreign-born population - Other Caribbean (%)
Place of birth for the foreign-born population - Belize (%)
Place of birth for the foreign-born population - Costa Rica (%)
Place of birth for the foreign-born population - El Salvador (%)
Place of birth for the foreign-born population - Guatemala (%)
Place of birth for the foreign-born population - Honduras (%)
Place of birth for the foreign-born population - Mexico (%)
Place of birth for the foreign-born population - Nicaragua (%)
Place of birth for the foreign-born population - Panama (%)
Place of birth for the foreign-born population - Other Central America (%)
Place of birth for the foreign-born population - Argentina (%)
Place of birth for the foreign-born population - Bolivia (%)
Place of birth for the foreign-born population - Brazil (%)
Place of birth for the foreign-born population - Chile (%)
Place of birth for the foreign-born population - Colombia (%)
Place of birth for the foreign-born population - Ecuador (%)
Place of birth for the foreign-born population - Guyana (%)
Place of birth for the foreign-born population - Peru (%)
Place of birth for the foreign-born population - Uruguay (%)
Place of birth for the foreign-born population - Venezuela (%)
Place of birth for the foreign-born population - Other South America (%)
Place of birth for the foreign-born population - Canada (%)
Place of birth for the foreign-born population - Other Northern America (%)
Place of birth for the foreign-born population - Other (%)
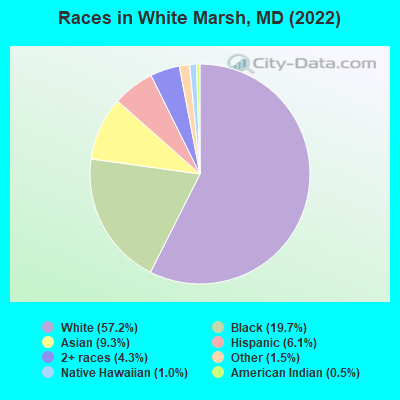
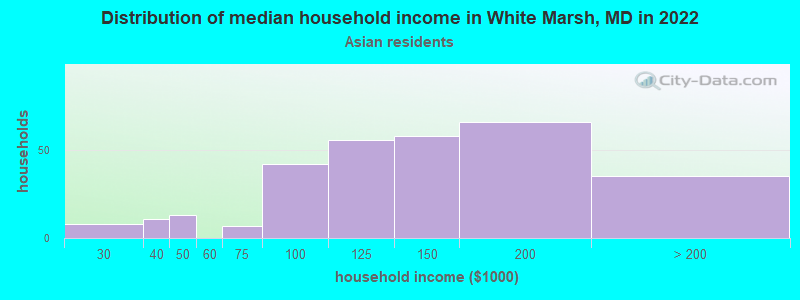
According to 2022 data, the most numerous races in White Marsh, MD are White alone (5,883 residents), Black alone (2,024 residents), and Hispanic (629 residents). 81.3% of White Marsh residents speak English at home. 17.0% of White Marsh, MD residents are foreign-born (7.3% born in Asia, 4.4% born in Africa, 2.2% born in Latin America, 1.9% born in Europe), which is 5.7% greater than the foreign-born rate of 16.0% across the entire state of Maryland.
Race distribution in White Marsh
2000 2022
3,286,547 62.1% White alone 1,464,735 27.7% Black alone 227,916 4.3% Hispanic 209,738 4.0% Asian alone 82,946 1.6% Two or more races 13,312 0.3% American Indian alone 9,379 0.2% Other race alone 1,913 0.04% Native Hawaiian and Other
2,906,492 47.1% White alone 1,800,914 29.2% Black alone 705,842 11.4% Hispanic 401,818 6.5% Asian alone 291,317 4.7% Two or more races 46,930 0.8% Other race alone 8,930 0.1% American Indian alone 2,417 0.04% Native Hawaiian and Other
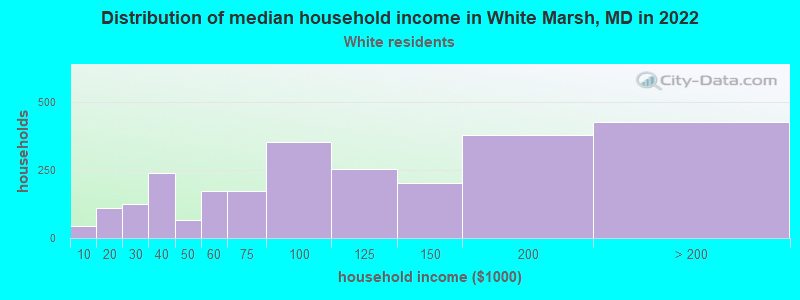
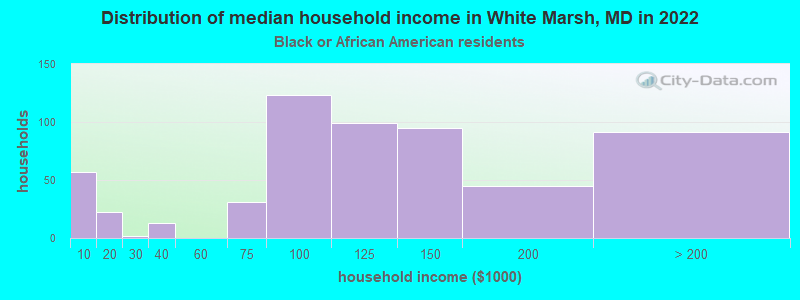
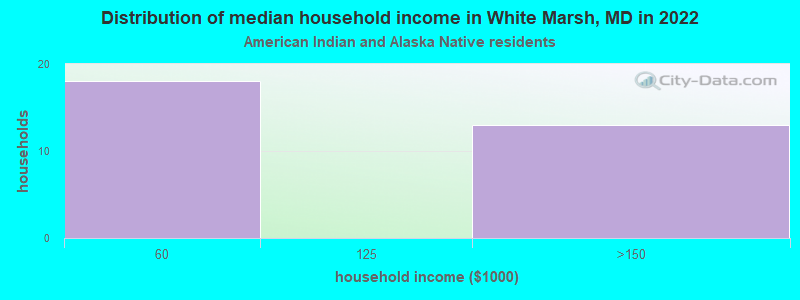
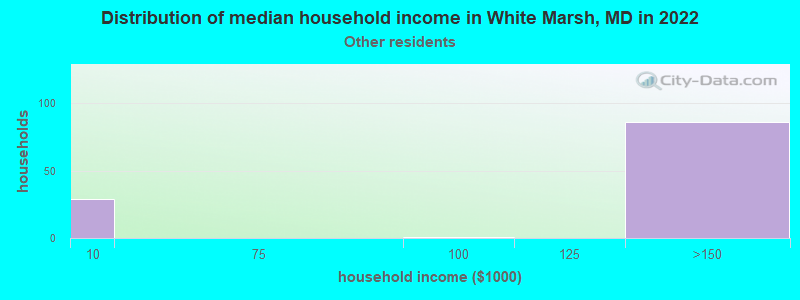
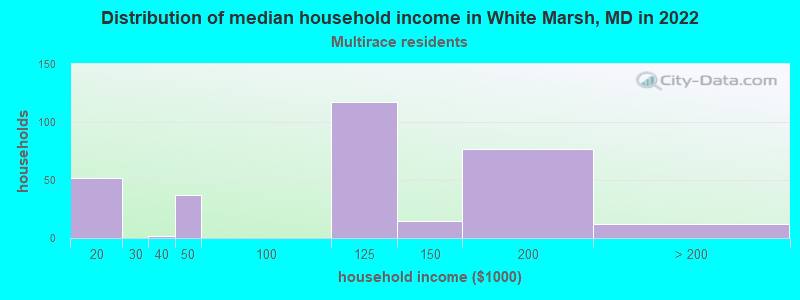
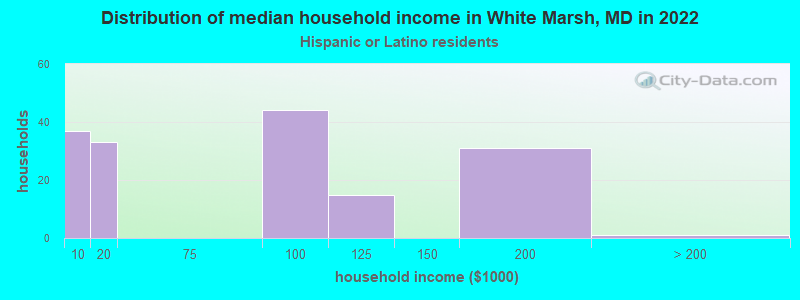
Income and house value in White Marsh Median household income in 2022 $99,327 White non-Hispanic householders$110,156 Black householders$131,118 Asian householders$150,089 Two or more races householders$84,602 Hispanic or Latino race householdersMedian 2022 house value $388,066 White Non-Hispanic householders$337,866 Black or African American householders$267,923 American Indian or Alaska Native householders $436,575 Asian householders$634,556 Some other race householders$423,037 Two or more races householders$617,071 Hispanic or Latino householders
Median age by race in White Marsh
44.0 Median age for White residents42.8 45.3 20.0 Median age for Black or African American residents18.4 26.4 9.0 Median age for American Indian / Alaska Native residents-867,632,849.4 7.7 36.6 Median age for Asian residents36.1 35.2 105.6 Median age for Native Hawaiian / Pacific Islander residents20.0 -760,942,760.2 75.0 Median age for Other race residents80.7 77.6 18.1 Median age for Two or more races residents27.3 14.9 43.8 Median age for White alone residents42.5 45.4 23.6 Median age for Hispanic or Latino residents23.6 20.8
Owner/renter occupied households by race in White Marsh
House owners and renters - White residents 2,069 80.4% Owner occupied504 19.6% Renter occupiedHouse owners and renters - Black or African American residents 336 60.2% Owner occupied222 39.8% Renter occupiedHouse owners and renters - American Indian / Alaska Native residents 23 57.6% Owner occupied17 42.4% Renter occupiedHouse owners and renters - Asian residents 238 82.3% Owner occupied51 17.7% Renter occupiedHouse owners and renters - Native Hawaiian / Pacific Islander residents 29 100.0% Owner occupiedHouse owners and renters - Other race residents 142 80.8% Owner occupied34 19.2% Renter occupiedHouse owners and renters - Two or more races residents 148 52.0% Owner occupied137 48.0% Renter occupiedHouse owners and renters - White alone residents 2,069 81.4% Owner occupied473 18.6% Renter occupiedHouse owners and renters - Hispanic or Latino residents 76 47.0% Owner occupied86 53.0% Renter occupied
Language usage in White Marsh
English speakers - Total 81.3% of residents of White Marsh speak English at home.
1.6% of residents speak Spanish at home 141 87.6% Speak English very well20 12.4% Speak English less than very well17.1% of residents speak other language at home 1,028 60.4% Speak English very well675 39.6% Speak English less than very well
English speakers - Born in the United States 91.5% of residents of White Marsh speak English at home.
1.2% of residents speak Spanish at home 21 100.0% Speak English very well7.1% of residents speak other language at home 68 55.3% Speak English very well55 44.7% Speak English less than very well
English speakers - Native, born elsewhere 44.8% of residents of White Marsh speak English at home.
33.6% of residents speak other language at home 5 11.9% Speak English very well37 88.1% Speak English less than very well
English speakers - Foreign-born 16.6% of residents of White Marsh speak English at home.
4.9% of residents speak Spanish at home 63 74.1% Speak English very well22 25.9% Speak English less than very well75.6% of residents speak other language at home 806 61.5% Speak English very well504 38.5% Speak English less than very well
White (Caucasian) - Speak only English Native:
96.6% (5,399)Foreign-born:
25.6% (57)
White (Caucasian) - Speak another language Native:
3.1% (175)Foreign-born:
74.2% (165)
Black or African American - Speak only English Native:
93.9% (1,436)Foreign-born:
29.6% (172)
Black or African American - Speak another language Native:
5.3% (80)Foreign-born:
65.1% (378)
Asian - Speak only English Native:
70.4% (144)Foreign-born:
1.6% (12)
Asian - Speak another language Native:
30.0% (61)Foreign-born:
96.8% (712)
Native Hawaiian / Pacific Islander - Speak another language Native:
56.6% (49)Foreign-born:
100.0% (22)
Two or more races - Speak only English Native:
95.7% (451)Foreign-born:
51.6% (57)
Two or more races - Speak another language Native:
6.0% (28)Foreign-born:
52.8% (58)
White alone - Speak only English Native:
96.7% (5,346)Foreign-born:
25.8% (57)
White alone - Speak another language Native:
3.1% (170)Foreign-born:
74.3% (163)
Hispanic or Latino - Speak another language Native:
18.0% (80)Foreign-born:
100.0% (95)
Foreign-born residents in White Marsh 1,744 residents are foreign born (7.3% Asia , 4.4% Africa , 2.2% Latin America , 1.9% Europe ).
This city:
17.0%Maryland:
15.7%
Marital status for residents in White Marsh Marital status - White (Caucasian) population 15 years and over
Males 30.1% Never married58.8% Now married0.3% Separated3.2% Widowed7.7% DivorcedFemales 25.6% Never married51.0% Now married0.7% Separated10.0% Widowed12.7% DivorcedWomen who gave birth in the past 12 months Now married:
100.0% (63)Unmarried:
0.0% (0)
Women who did not give birth in the past 12 months Now married:
42.7% (505)Unmarried:
57.3% (678)
Marital status - Black or African American population 15 years and over
Males 43.9% Never married42.3% Now married5.5% Separated0.0% Widowed8.3% DivorcedFemales 45.2% Never married34.1% Now married2.2% Separated3.4% Widowed15.1% DivorcedWomen who did not give birth in the past 12 months Now married:
34.6% (168)Unmarried:
65.4% (319)
Marital status - American Indian / Alaska Native population 15 years and over
Males 0.0% Never married100.0% Now married0.0% Separated0.0% Widowed0.0% DivorcedFemales 0.0% Never married0.0% Now married0.0% Separated0.0% Widowed100.0% DivorcedMarital status - Asian population 15 years and over
Males 25.0% Never married75.0% Now married0.0% Separated0.0% Widowed0.0% DivorcedFemales 33.0% Never married48.6% Now married0.0% Separated10.1% Widowed8.3% DivorcedWomen who did not give birth in the past 12 months Now married:
49.8% (141)Unmarried:
50.2% (142)
Marital status - Native Hawaiian / Pacific Islander population 15 years and over
Males 37.8% Never married62.2% Now married0.0% Separated0.0% Widowed0.0% DivorcedFemales 53.5% Never married46.5% Now married0.0% Separated0.0% Widowed0.0% DivorcedWomen who gave birth in the past 12 months Now married:
100.0% (21)Unmarried:
0.0% (0)
Marital status - Other race population 15 years and over
Males 16.0% Never married84.0% Now married0.0% Separated0.0% Widowed0.0% DivorcedFemales 36.6% Never married63.4% Now married0.0% Separated0.0% Widowed0.0% DivorcedWomen who did not give birth in the past 12 months Now married:
0.0% (0)Unmarried:
100.0% (72)
Marital status - Two or more races population 15 years and over
Males 62.5% Never married33.0% Now married0.0% Separated0.0% Widowed4.5% DivorcedFemales 45.0% Never married24.9% Now married13.8% Separated0.0% Widowed16.4% DivorcedWomen who gave birth in the past 12 months Now married:
100.0% (11)Unmarried:
0.0% (0)
Women who did not give birth in the past 12 months Now married:
35.6% (81)Unmarried:
64.4% (148)
Marital status - White alone, not Hispanic / Latino population 15 years and over
Males 30.4% Never married58.1% Now married0.3% Separated3.3% Widowed7.9% DivorcedFemales 25.7% Never married50.8% Now married0.7% Separated10.1% Widowed12.7% DivorcedWomen who gave birth in the past 12 months Now married:
100.0% (63)Unmarried:
0.0% (0)
Women who did not give birth in the past 12 months Now married:
42.4% (503)Unmarried:
57.6% (682)
Marital status - Hispanic or Latino population 15 years and over
Males 43.7% Never married56.3% Now married0.0% Separated0.0% Widowed0.0% DivorcedFemales 30.6% Never married68.9% Now married0.0% Separated0.0% Widowed0.5% DivorcedWomen who gave birth in the past 12 months Now married:
100.0% (9)Unmarried:
0.0% (0)
Women who did not give birth in the past 12 months Now married:
36.5% (38)Unmarried:
63.5% (65)
Ancestries in White Marsh
827 14.6% American372 6.6% German319 5.6% Irish277 4.9% Italian254 4.5% Ethiopian190 3.3% Greek175 3.1% English170 3.0% Ghanaian124 2.2% Polish98 1.7% European77 1.4% Ukrainian72 1.3% Jamaican65 1.1% West Indian53 0.9% Arab45 0.8% Kenyan37 0.7% Scandinavian37 0.7% African34 0.6% Eastern European34 0.6% Scottish31 0.5% Russian21 0.4% Swedish19 0.3% Nigerian19 0.3% Welsh12 0.2% Scotch-Irish10 0.2% Bulgarian9 0.2% British9 0.2% Czech8 0.1% Turkish7 0.1% Albanian6 0.1% Dutch6 0.1% Lithuanian2 0.04% Canadian
Children Nativity (place of birth) in White Marsh
Children under 6 years - Living with two parents Both parents native 199 98.5% Native3 1.5% Foreign-bornBoth parents foreign-born 83 85.0% Native15 15.0% Foreign-bornChildren under 6 years - Living with one parent Native parent 116 100.0% NativeChildren 6 to 17 years - Living with two parents Both parents native 614 100.0% NativeBoth parents foreign-born 562 88.7% Native71 11.3% Foreign-bornOne native, one foreign-born parent 88 100.0% NativeChildren 6 to 17 years - Living with one parent Native parent 560 100.0% NativeForeign-born parent 157 51.5% Native148 48.5% Foreign-born
Grandparents responsible for own grandchildren in White Marsh
Grandparents (30 to 59 years) Black or African American 12 100.0% Responsible for grandchildrenNative Hawaiian / Pacific Islander 21 100.0% Not responsible for grandchildrenGrandparents (60 years and over) Black or African American 9 30.5% Responsible for grandchildren21 69.5% Not responsible for grandchildren