Races in Wilkes-Barre, Pennsylvania (PA) Detailed Stats
Data:
Races - White alone (%)
Races - White alone (% change since 2000)
Races - Black alone (%)
Races - Black alone (% change since 2000)
Races - American Indian alone (%)
Races - American Indian alone (% change since 2000)
Races - Asian alone (%)
Races - Asian alone (% change since 2000)
Races - Hispanic (%)
Races - Hispanic (% change since 2000)
Races - Native Hawaiian and Other Pacific Islander alone (%)
Races - Native Hawaiian and Other Pacific Islander alone (% change since 2000)
Races - Two or more races(%)
Races - Two or more races(% change since 2000)
Races - Other race alone (%)
Races - Other race alone (% change since 2000)
Racial diversity
Place of birth - Born in state of residence (%)
Place of birth - Born in state of residence (%) - White
Place of birth - Born in state of residence (%) - Black or African American
Place of birth - Born in state of residence (%) - Asian
Place of birth - Born in state of residence (%) - Hispanic or Latino
Place of birth - Born in state of residence (%) - American Indian and Alaska Native
Place of birth - Born in state of residence (%) - Multirace
Place of birth - Born in state of residence (%) - Other Race
Place of birth - Born in other state (%)
Place of birth - Born in other state (%) - White
Place of birth - Born in other state (%) - Black or African American
Place of birth - Born in other state (%) - Asian
Place of birth - Born in other state (%) - Hispanic or Latino
Place of birth - Born in other state (%) - American Indian and Alaska Native
Place of birth - Born in other state (%) - Multirace
Place of birth - Born in other state (%) - Other Race
Place of birth - Native, outside of US (%)
Place of birth - Native, outside of US (%) - White
Place of birth - Native, outside of US (%) - Black or African American
Place of birth - Native, outside of US (%) - Asian
Place of birth - Native, outside of US (%) - Hispanic or Latino
Place of birth - Native, outside of US (%) - American Indian and Alaska Native
Place of birth - Native, outside of US (%) - Multirace
Place of birth - Native, outside of US (%) - Other Race
Place of birth - Foreign born (%)
Place of birth - Foreign born (%) - White
Place of birth - Foreign born (%) - Black or African American
Place of birth - Foreign born (%) - Asian
Place of birth - Foreign born (%) - Hispanic or Latino
Place of birth - Foreign born (%) - American Indian and Alaska Native
Place of birth - Foreign born (%) - Multirace
Place of birth - Foreign born (%) - Other Race
Residents speaking English at home (%)
Residents speaking English at home - Born in the United States (%)
Residents speaking English at home - Native, born elsewhere (%)
Residents speaking English at home - Foreign born (%)
Residents speaking Spanish at home (%)
Residents speaking Spanish at home - Born in the United States (%)
Residents speaking Spanish at home - Native, born elsewhere (%)
Residents speaking Spanish at home - Foreign born (%)
Residents speaking other language at home (%)
Residents speaking other language at home - Born in the United States (%)
Residents speaking other language at home - Native, born elsewhere (%)
Residents speaking other language at home - Foreign born (%)
Marital status - Never married (%)
Marital status - Now married (%)
Marital status - Separated (%)
Marital status - Widowed (%)
Marital status - Divorced (%)
Ancestries Reported - Arab (%)
Ancestries Reported - Czech (%)
Ancestries Reported - Danish (%)
Ancestries Reported - Dutch (%)
Ancestries Reported - English (%)
Ancestries Reported - French (%)
Ancestries Reported - French Canadian (%)
Ancestries Reported - German (%)
Ancestries Reported - Greek (%)
Ancestries Reported - Hungarian (%)
Ancestries Reported - Irish (%)
Ancestries Reported - Italian (%)
Ancestries Reported - Lithuanian (%)
Ancestries Reported - Norwegian (%)
Ancestries Reported - Polish (%)
Ancestries Reported - Portuguese (%)
Ancestries Reported - Russian (%)
Ancestries Reported - Scotch-Irish (%)
Ancestries Reported - Scottish (%)
Ancestries Reported - Slovak (%)
Ancestries Reported - Subsaharan African (%)
Ancestries Reported - Swedish (%)
Ancestries Reported - Swiss (%)
Ancestries Reported - Ukrainian (%)
Ancestries Reported - United States (%)
Ancestries Reported - Welsh (%)
Ancestries Reported - West Indian (%)
Ancestries Reported - Other (%)
Geographical mobility - Same house 1 year ago (%)
Geographical mobility - Same house 1 year ago (%) - White
Geographical mobility - Same house 1 year ago (%) - Black or African American
Geographical mobility - Same house 1 year ago (%) - Asian
Geographical mobility - Same house 1 year ago (%) - Hispanic or Latino
Geographical mobility - Same house 1 year ago (%) - American Indian and Alaska Native
Geographical mobility - Same house 1 year ago (%) - Multirace
Geographical mobility - Same house 1 year ago (%) - Other Race
Geographical mobility - Moved within same county (%)
Geographical mobility - Moved within same county (%) - White
Geographical mobility - Moved within same county (%) - Black or African American
Geographical mobility - Moved within same county (%) - Asian
Geographical mobility - Moved within same county (%) - Hispanic or Latino
Geographical mobility - Moved within same county (%) - American Indian and Alaska Native
Geographical mobility - Moved within same county (%) - Multirace
Geographical mobility - Moved within same county (%) - Other Race
Geographical mobility - Moved from different county within same state (%)
Geographical mobility - Moved from different county within same state (%) - White
Geographical mobility - Moved from different county within same state (%) - Black or African American
Geographical mobility - Moved from different county within same state (%) - Asian
Geographical mobility - Moved from different county within same state (%) - Hispanic or Latino
Geographical mobility - Moved from different county within same state (%) - American Indian and Alaska Native
Geographical mobility - Moved from different county within same state (%) - Multirace
Geographical mobility - Moved from different county within same state (%) - Other Race
Geographical mobility - Moved from different state (%)
Geographical mobility - Moved from different state (%) - White
Geographical mobility - Moved from different state (%) - Black or African American
Geographical mobility - Moved from different state (%) - Asian
Geographical mobility - Moved from different state (%) - Hispanic or Latino
Geographical mobility - Moved from different state (%) - American Indian and Alaska Native
Geographical mobility - Moved from different state (%) - Multirace
Geographical mobility - Moved from different state (%) - Other Race
Geographical mobility - Moved from abroad (%)
Geographical mobility - Moved from abroad (%) - White
Geographical mobility - Moved from abroad (%) - Black or African American
Geographical mobility - Moved from abroad (%) - Asian
Geographical mobility - Moved from abroad (%) - Hispanic or Latino
Geographical mobility - Moved from abroad (%) - American Indian and Alaska Native
Geographical mobility - Moved from abroad (%) - Multirace
Geographical mobility - Moved from abroad (%) - Other Race
Place of birth for the foreign-born population - Ireland (%)
Place of birth for the foreign-born population - Denmark (%)
Place of birth for the foreign-born population - Norway (%)
Place of birth for the foreign-born population - Sweden (%)
Place of birth for the foreign-born population - United Kingdom (%)
Place of birth for the foreign-born population - England (%)
Place of birth for the foreign-born population - Scotland (%)
Place of birth for the foreign-born population - Other Northern Europe (%)
Place of birth for the foreign-born population - Austria (%)
Place of birth for the foreign-born population - Belgium (%)
Place of birth for the foreign-born population - France (%)
Place of birth for the foreign-born population - Germany (%)
Place of birth for the foreign-born population - Netherlands (%)
Place of birth for the foreign-born population - Switzerland (%)
Place of birth for the foreign-born population - Other Western Europe (%)
Place of birth for the foreign-born population - Greece (%)
Place of birth for the foreign-born population - Italy (%)
Place of birth for the foreign-born population - Portugal (%)
Place of birth for the foreign-born population - Spain (%)
Place of birth for the foreign-born population - Other Southern Europe (%)
Place of birth for the foreign-born population - Albania (%)
Place of birth for the foreign-born population - Belarus (%)
Place of birth for the foreign-born population - Bosnia and Herzegovina (%)
Place of birth for the foreign-born population - Bulgaria (%)
Place of birth for the foreign-born population - Croatia (%)
Place of birth for the foreign-born population - Czechoslovakia (%)
Place of birth for the foreign-born population - Hungary (%)
Place of birth for the foreign-born population - Latvia (%)
Place of birth for the foreign-born population - Lithuania (%)
Place of birth for the foreign-born population - North Macedonia (Macedonia) (%)
Place of birth for the foreign-born population - Moldova (%)
Place of birth for the foreign-born population - Poland (%)
Place of birth for the foreign-born population - Romania (%)
Place of birth for the foreign-born population - Russia (%)
Place of birth for the foreign-born population - Serbia (%)
Place of birth for the foreign-born population - Ukraine (%)
Place of birth for the foreign-born population - Other Eastern Europe (%)
Place of birth for the foreign-born population - China (%)
Place of birth for the foreign-born population - Hong Kong (%)
Place of birth for the foreign-born population - Taiwan (%)
Place of birth for the foreign-born population - Japan (%)
Place of birth for the foreign-born population - Korea (%)
Place of birth for the foreign-born population - Other Eastern Asia (%)
Place of birth for the foreign-born population - Afghanistan (%)
Place of birth for the foreign-born population - Bangladesh (%)
Place of birth for the foreign-born population - India (%)
Place of birth for the foreign-born population - Iran (%)
Place of birth for the foreign-born population - Kazakhstan (%)
Place of birth for the foreign-born population - Nepal (%)
Place of birth for the foreign-born population - Pakistan (%)
Place of birth for the foreign-born population - Sri Lanka (%)
Place of birth for the foreign-born population - Uzbekistan (%)
Place of birth for the foreign-born population - Other South Central Asia (%)
Place of birth for the foreign-born population - Burma (%)
Place of birth for the foreign-born population - Cambodia (%)
Place of birth for the foreign-born population - Indonesia (%)
Place of birth for the foreign-born population - Laos (%)
Place of birth for the foreign-born population - Malaysia (%)
Place of birth for the foreign-born population - Philippines (%)
Place of birth for the foreign-born population - Singapore (%)
Place of birth for the foreign-born population - Thailand (%)
Place of birth for the foreign-born population - Vietnam (%)
Place of birth for the foreign-born population - Other South Eastern Asia (%)
Place of birth for the foreign-born population - Armenia (%)
Place of birth for the foreign-born population - Iraq (%)
Place of birth for the foreign-born population - Israel (%)
Place of birth for the foreign-born population - Jordan (%)
Place of birth for the foreign-born population - Kuwait (%)
Place of birth for the foreign-born population - Lebanon (%)
Place of birth for the foreign-born population - Saudi Arabia (%)
Place of birth for the foreign-born population - Syria (%)
Place of birth for the foreign-born population - Turkey (%)
Place of birth for the foreign-born population - Yemen (%)
Place of birth for the foreign-born population - Other Western Asia (%)
Place of birth for the foreign-born population - Eritrea (%)
Place of birth for the foreign-born population - Ethiopia (%)
Place of birth for the foreign-born population - Kenya (%)
Place of birth for the foreign-born population - Somalia (%)
Place of birth for the foreign-born population - Uganda (%)
Place of birth for the foreign-born population - Zimbabwe (%)
Place of birth for the foreign-born population - Other Eastern Africa (%)
Place of birth for the foreign-born population - Cameroon (%)
Place of birth for the foreign-born population - Congo (%)
Place of birth for the foreign-born population - Democratic Republic of Congo (Zaire) (%)
Place of birth for the foreign-born population - Other Middle Africa (%)
Place of birth for the foreign-born population - Egypt (%)
Place of birth for the foreign-born population - Morocco (%)
Place of birth for the foreign-born population - Sudan (%)
Place of birth for the foreign-born population - Other Northern Africa (%)
Place of birth for the foreign-born population - South Africa (%)
Place of birth for the foreign-born population - Other Southern Africa (%)
Place of birth for the foreign-born population - Cabo Verde (%)
Place of birth for the foreign-born population - Ghana (%)
Place of birth for the foreign-born population - Liberia (%)
Place of birth for the foreign-born population - Nigeria (%)
Place of birth for the foreign-born population - Senegal (%)
Place of birth for the foreign-born population - Sierra Leone (%)
Place of birth for the foreign-born population - Other Western Africa (%)
Place of birth for the foreign-born population - Australia (%)
Place of birth for the foreign-born population - New Zealand (%)
Place of birth for the foreign-born population - Fiji (%)
Place of birth for the foreign-born population - Micronesia (%)
Place of birth for the foreign-born population - Bahamas (%)
Place of birth for the foreign-born population - Barbados (%)
Place of birth for the foreign-born population - Cuba (%)
Place of birth for the foreign-born population - Dominica (%)
Place of birth for the foreign-born population - Dominican Republic (%)
Place of birth for the foreign-born population - Grenada (%)
Place of birth for the foreign-born population - Haiti (%)
Place of birth for the foreign-born population - Jamaica (%)
Place of birth for the foreign-born population - St. Vincent and the Grenadines (%)
Place of birth for the foreign-born population - Trinidad and Tobago (%)
Place of birth for the foreign-born population - West Indies (%)
Place of birth for the foreign-born population - Other Caribbean (%)
Place of birth for the foreign-born population - Belize (%)
Place of birth for the foreign-born population - Costa Rica (%)
Place of birth for the foreign-born population - El Salvador (%)
Place of birth for the foreign-born population - Guatemala (%)
Place of birth for the foreign-born population - Honduras (%)
Place of birth for the foreign-born population - Mexico (%)
Place of birth for the foreign-born population - Nicaragua (%)
Place of birth for the foreign-born population - Panama (%)
Place of birth for the foreign-born population - Other Central America (%)
Place of birth for the foreign-born population - Argentina (%)
Place of birth for the foreign-born population - Bolivia (%)
Place of birth for the foreign-born population - Brazil (%)
Place of birth for the foreign-born population - Chile (%)
Place of birth for the foreign-born population - Colombia (%)
Place of birth for the foreign-born population - Ecuador (%)
Place of birth for the foreign-born population - Guyana (%)
Place of birth for the foreign-born population - Peru (%)
Place of birth for the foreign-born population - Uruguay (%)
Place of birth for the foreign-born population - Venezuela (%)
Place of birth for the foreign-born population - Other South America (%)
Place of birth for the foreign-born population - Canada (%)
Place of birth for the foreign-born population - Other Northern America (%)
Place of birth for the foreign-born population - Other (%)
Latest news about races in Wilkes-Barre, PA collected exclusively by city-data.com from local newspapers, TV, and radio stations
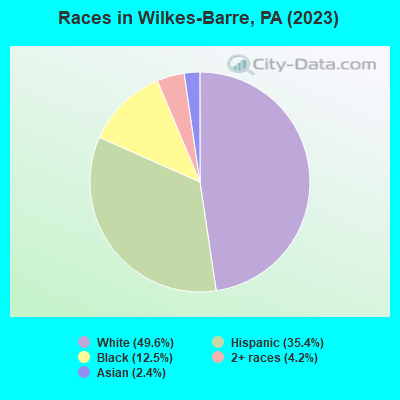
According to 2022 data, the most numerous races in Wilkes-Barre, PA are White alone (23,019 residents), Black alone (3,548 residents), and Hispanic (14,819 residents). 74.4% of Wilkes-Barre residents speak English at home. 15.0% of Wilkes-Barre, PA residents are foreign-born (11.7% born in Latin America), which is 53.3% greater than the foreign-born rate of 7.0% across the entire state of Pennsylvania.
Race distribution in Wilkes-Barre
2000 2022
10,322,455 84.1% White alone 1,202,437 9.8% Black alone 394,088 3.2% Hispanic 218,296 1.8% Asian alone 113,097 0.9% Two or more races 13,086 0.1% Other race alone 14,904 0.1% American Indian alone 2,691 0.02% Native Hawaiian and Other
9,487,228 73.1% White alone 1,311,581 10.1% Black alone 1,115,997 8.6% Hispanic 493,942 3.8% Two or more races 487,124 3.8% Asian alone 63,582 0.5% Other race alone 10,130 0.08% American Indian alone 2,424 0.02% Native Hawaiian and Other
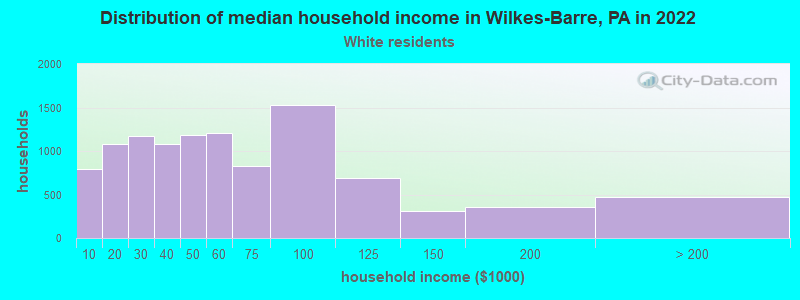
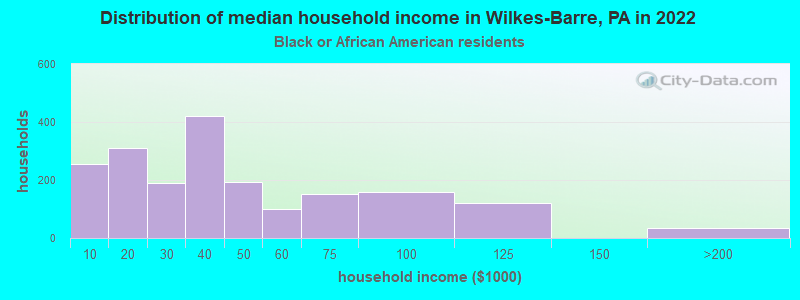
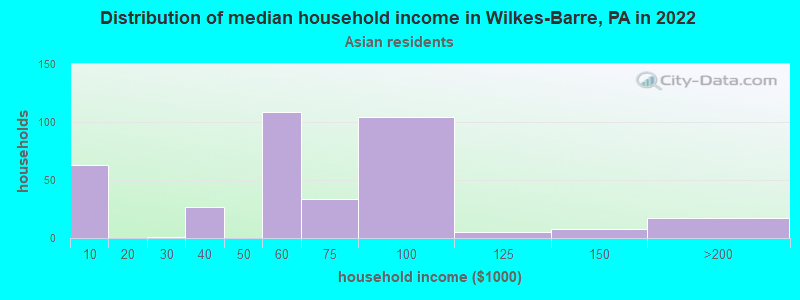
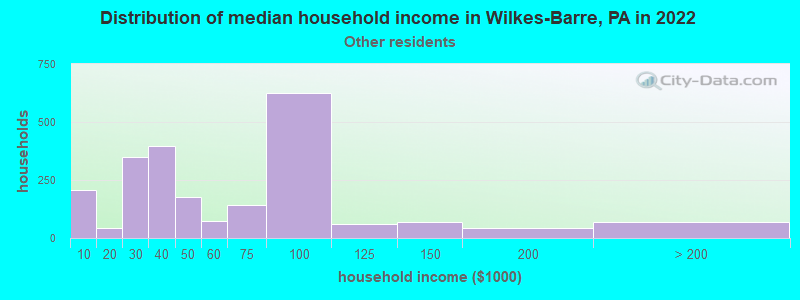
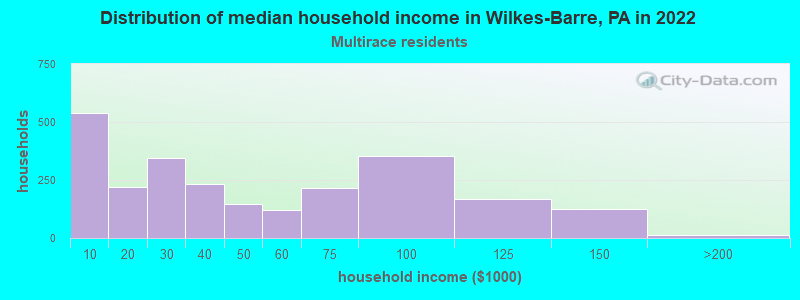
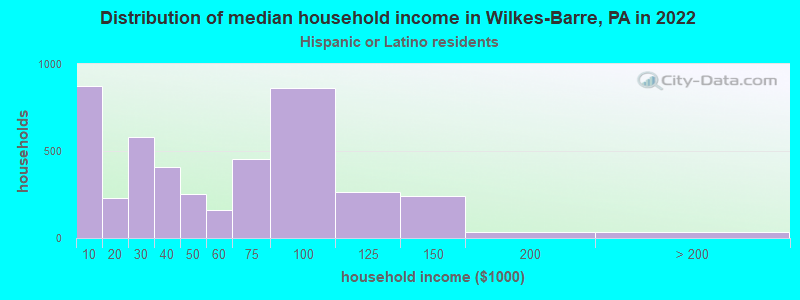
Income and house value in Wilkes-Barre Median household income in 2022 $47,879 White non-Hispanic householders$43,772 Black householders$56,065 Asian householders$48,710 Some other race householders$35,013 Two or more races householders$42,324 Hispanic or Latino race householdersMedian 2022 house value $107,948 White Non-Hispanic householders$99,939 Black or African American householders $123,464 Asian householders$112,619 Two or more races householders$159,669 Hispanic or Latino householders
Median age by race in Wilkes-Barre
44.0 Median age for White residents44.1 44.4 27.5 Median age for Black or African American residents27.8 26.6 28.3 Median age for American Indian / Alaska Native residents18.3 15.9 30.9 Median age for Asian residents20.9 33.1 11.8 Median age for Native Hawaiian / Pacific Islander residents8.9 -747,474,746.7 29.0 Median age for Other race residents33.4 25.6 24.6 Median age for Two or more races residents22.2 29.9 45.9 Median age for White alone residents45.3 47.2 26.3 Median age for Hispanic or Latino residents28.6 25.4
Owner/renter occupied households by race in Wilkes-Barre
House owners and renters - White residents 5,855 54.7% Owner occupied4,852 45.3% Renter occupiedHouse owners and renters - Black or African American residents 296 18.7% Owner occupied1,286 81.3% Renter occupiedHouse owners and renters - American Indian / Alaska Native residents 2 100.0% Owner occupiedHouse owners and renters - Asian residents 188 44.7% Owner occupied232 55.3% Renter occupiedHouse owners and renters - Native Hawaiian / Pacific Islander residents 15 100.0% Renter occupiedHouse owners and renters - Other race residents 1,099 50.5% Owner occupied1,080 49.5% Renter occupiedHouse owners and renters - Two or more races residents 1,276 45.2% Owner occupied1,547 54.8% Renter occupiedHouse owners and renters - White alone residents 5,739 55.3% Owner occupied4,633 44.7% Renter occupiedHouse owners and renters - Hispanic or Latino residents 2,192 49.8% Owner occupied2,211 50.2% Renter occupied
Language usage in Wilkes-Barre
English speakers - Total 74.4% of residents of Wilkes-Barre speak English at home.
24.8% of residents speak Spanish at home 5,225 51.0% Speak English very well5,016 49.0% Speak English less than very well2.7% of residents speak other language at home 695 62.7% Speak English very well413 37.3% Speak English less than very well
English speakers - Born in the United States 73.7% of residents of Wilkes-Barre speak English at home.
26.9% of residents speak Spanish at home 2,629 82.9% Speak English very well541 17.1% Speak English less than very well0.9% of residents speak other language at home 90 81.8% Speak English very well20 18.2% Speak English less than very well
English speakers - Native, born elsewhere 27.5% of residents of Wilkes-Barre speak English at home.
76.2% of residents speak Spanish at home 399 30.8% Speak English very well898 69.2% Speak English less than very well0.1% of residents speak other language at home 1 100.0% Speak English very well
English speakers - Foreign-born 13.2% of residents of Wilkes-Barre speak English at home.
78.5% of residents speak Spanish at home 1,674 32.2% Speak English very well3,531 67.8% Speak English less than very well10.2% of residents speak other language at home 375 55.5% Speak English very well301 44.5% Speak English less than very well
White (Caucasian) - Speak only English Native:
95.5% (22,085)Foreign-born:
43.5% (135)
White (Caucasian) - Speak another language Native:
3.2% (740)Foreign-born:
100.0% (311)
Black or African American - Speak only English Native:
88.1% (3,320)Foreign-born:
79.5% (240)
Black or African American - Speak another language Native:
9.0% (340)Foreign-born:
32.8% (99)
Asian - Speak only English Native:
53.8% (196)Foreign-born:
12.2% (68)
Asian - Speak another language Native:
46.3% (169)Foreign-born:
88.7% (496)
Other race - Speak only English Native:
32.0% (1,276)Foreign-born:
5.7% (224)
Other race - Speak another language Native:
65.9% (2,631)Foreign-born:
94.5% (3,732)
Two or more races - Speak only English Native:
69.8% (3,518)Foreign-born:
5.0% (130)
Two or more races - Speak another language Native:
30.2% (1,523)Foreign-born:
95.7% (2,472)
White alone - Speak only English Native:
98.9% (21,851)Foreign-born:
47.9% (112)
White alone - Speak another language Native:
1.2% (260)Foreign-born:
42.3% (99)
Hispanic or Latino - Speak only English Native:
35.9% (2,753)Foreign-born:
5.0% (277)
Hispanic or Latino - Speak another language Native:
62.7% (4,808)Foreign-born:
95.0% (5,269)
Foreign-born residents in Wilkes-Barre 6,631 residents are foreign born (11.7% Latin America ).
This city:
15.0%Pennsylvania:
7.3%
Marital status for residents in Wilkes-Barre Marital status - White (Caucasian) population 15 years and over
Males 49.7% Never married34.4% Now married1.8% Separated3.7% Widowed10.4% DivorcedFemales 38.4% Never married33.7% Now married1.9% Separated13.6% Widowed12.4% DivorcedWomen who gave birth in the past 12 months Now married:
45.3% (134)Unmarried:
54.7% (162)
Women who did not give birth in the past 12 months Now married:
28.2% (1,490)Unmarried:
71.8% (3,799)
Marital status - Black or African American population 15 years and over
Males 70.8% Never married19.0% Now married4.0% Separated3.1% Widowed3.1% DivorcedFemales 61.6% Never married20.6% Now married7.4% Separated3.1% Widowed7.3% DivorcedWomen who gave birth in the past 12 months Now married:
5.4% (6)Unmarried:
94.6% (111)
Women who did not give birth in the past 12 months Now married:
24.3% (275)Unmarried:
75.7% (857)
Marital status - American Indian / Alaska Native population 15 years and over
Males 100.0% Never married0.0% Now married0.0% Separated0.0% Widowed0.0% DivorcedFemales 60.0% Never married20.0% Now married0.0% Separated0.0% Widowed20.0% DivorcedWomen who did not give birth in the past 12 months Now married:
0.0% (0)Unmarried:
100.0% (5)
Marital status - Asian population 15 years and over
Males 38.9% Never married61.1% Now married0.0% Separated0.0% Widowed0.0% DivorcedFemales 58.7% Never married30.0% Now married3.7% Separated0.9% Widowed6.6% DivorcedWomen who did not give birth in the past 12 months Now married:
31.7% (146)Unmarried:
68.3% (314)
Marital status - Other race population 15 years and over
Males 48.8% Never married40.5% Now married2.7% Separated1.4% Widowed6.6% DivorcedFemales 48.1% Never married33.3% Now married3.3% Separated3.5% Widowed11.8% DivorcedWomen who gave birth in the past 12 months Now married:
86.4% (101)Unmarried:
13.6% (16)
Women who did not give birth in the past 12 months Now married:
29.7% (722)Unmarried:
70.3% (1,705)
Marital status - Two or more races population 15 years and over
Males 56.5% Never married36.0% Now married1.0% Separated2.4% Widowed4.0% DivorcedFemales 48.3% Never married34.2% Now married2.7% Separated4.2% Widowed10.5% DivorcedWomen who gave birth in the past 12 months Now married:
21.9% (40)Unmarried:
78.1% (143)
Women who did not give birth in the past 12 months Now married:
40.1% (782)Unmarried:
59.9% (1,168)
Marital status - White alone, not Hispanic / Latino population 15 years and over
Males 48.5% Never married34.9% Now married1.6% Separated3.9% Widowed11.0% DivorcedFemales 37.3% Never married33.7% Now married1.8% Separated14.3% Widowed13.0% DivorcedWomen who gave birth in the past 12 months Now married:
45.3% (132)Unmarried:
54.7% (160)
Women who did not give birth in the past 12 months Now married:
27.7% (1,384)Unmarried:
72.3% (3,613)
Marital status - Hispanic or Latino population 15 years and over
Males 54.7% Never married36.7% Now married2.6% Separated0.7% Widowed5.3% DivorcedFemales 50.5% Never married35.2% Now married3.1% Separated3.2% Widowed8.1% DivorcedWomen who gave birth in the past 12 months Now married:
36.7% (119)Unmarried:
63.3% (205)
Women who did not give birth in the past 12 months Now married:
35.4% (1,364)Unmarried:
64.6% (2,492)
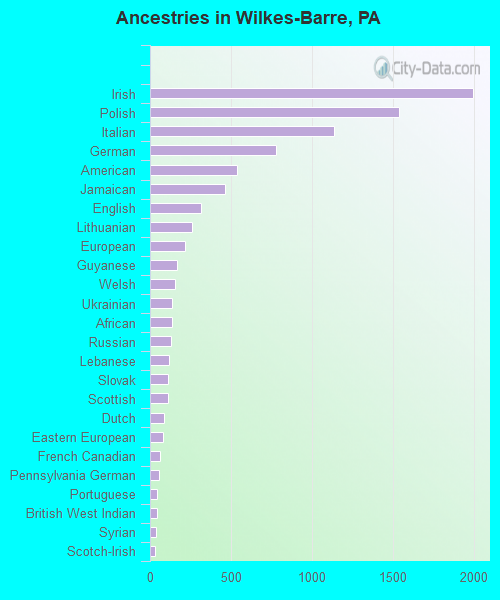
Ancestries in Wilkes-Barre
1,994 10.4% Irish1,538 8.1% Polish1,138 6.0% Italian781 4.1% German536 2.8% American465 2.4% Jamaican315 1.6% English260 1.4% Lithuanian218 1.1% European164 0.9% Guyanese156 0.8% Welsh136 0.7% Ukrainian134 0.7% African128 0.7% Russian115 0.6% Lebanese112 0.6% Slovak110 0.6% Scottish89 0.5% Dutch78 0.4% Eastern European61 0.3% French Canadian57 0.3% Pennsylvania German44 0.2% Portuguese43 0.2% British West Indian38 0.2% Syrian31 0.2% Scotch-Irish29 0.2% Austrian29 0.2% Greek23 0.1% Kenyan21 0.1% Scandinavian20 0.1% Slovene19 0.10% Ethiopian15 0.08% Arab10 0.05% Czech8 0.04% Belgian7 0.04% Norwegian7 0.04% Swedish6 0.03% Czechoslovakian5 0.03% Iranian4 0.02% British4 0.02% Hungarian3 0.02% Brazilian3 0.02% Ghanaian3 0.02% Trinidadian and Tobagonian2 0.01% Yugoslavian
Geographical mobility in Wilkes-Barre Same house 1 year ago 19,740 82.4% White (Caucasian)3,508 79.7% Black or African American60 76.3% American Indian / Alaska Native864 88.3% Asian183 100.0% Native Hawaiian / Pacific Islander6,412 74.0% Other race6,100 77.4% Two or more races18,935 83.1% White alone, not Hispanic / Latino10,659 75.2% Hispanic or LatinoMoved within same county 2,170 9.1% White / Caucasian424 9.6% Black or African American5 6.7% American Indian / Alaska Native66 6.7% Asian556 6.4% Other race737 9.4% Two or more races2,053 9.0% White alone, not Hispanic / Latino874 6.2% Hispanic or LatinoMoved within same state 1,342 5.6% White / Caucasian292 6.6% Black or African American8 9.8% American Indian / Alaska Native21 2.1% Asian1 0.0% Other race50 0.6% Two or more races1,229 5.4% White alone, not Hispanic / Latino188 1.3% Hispanic or LatinoMoved from different state 626 2.6% White / Caucasian808 18.4% Black or African American28 2.9% Asian1,974 22.8% Other race410 5.2% Two or more races598 2.6% White alone, not Hispanic / Latino2,135 15.1% Hispanic or LatinoMoved from abroad 50 0.2% White58 1.3% Black or African American1 0.1% Asian137 1.6% Other race422 5.4% Two or more races30 0.1% White alone, not Hispanic / Latino739 5.2% Hispanic or Latino
Children Nativity (place of birth) in Wilkes-Barre
Children under 6 years - Living with two parents Both parents native 453 100.0% NativeBoth parents foreign-born 269 78.4% Native74 21.6% Foreign-bornOne native, one foreign-born parent 151 100.0% NativeChildren under 6 years - Living with one parent Native parent 2,026 100.0% NativeForeign-born parent 421 85.4% Native72 14.6% Foreign-bornChildren 6 to 17 years - Living with two parents Both parents native 719 100.0% NativeBoth parents foreign-born 893 80.5% Native216 19.5% Foreign-bornOne native, one foreign-born parent 526 99.5% Native2 0.5% Foreign-bornChildren 6 to 17 years - Living with one parent Native parent 2,443 100.0% NativeForeign-born parent 960 54.1% Native814 45.9% Foreign-born
Grandparents responsible for own grandchildren in Wilkes-Barre
Grandparents (30 to 59 years) White / Caucasian 63 40.8% Responsible for grandchildren92 59.2% Not responsible for grandchildrenBlack or African American 66 45.3% Responsible for grandchildren80 54.7% Not responsible for grandchildrenOther race 54 54.4% Responsible for grandchildren45 45.6% Not responsible for grandchildrenTwo or more races 77 70.8% Responsible for grandchildren32 29.2% Not responsible for grandchildrenWhite alone, not Hispanic / Latino 48 36.3% Responsible for grandchildren84 63.7% Not responsible for grandchildrenHispanic or Latino 92 38.8% Responsible for grandchildren146 61.2% Not responsible for grandchildrenGrandparents (60 years and over) White / Caucasian 70 30.0% Responsible for grandchildren164 70.0% Not responsible for grandchildrenBlack or African American 9 100.0% Not responsible for grandchildrenOther race 188 100.0% Not responsible for grandchildrenTwo or more races 26 100.0% Not responsible for grandchildrenWhite alone, not Hispanic / Latino 48 24.8% Responsible for grandchildren146 75.2% Not responsible for grandchildrenHispanic or Latino 36 12.5% Responsible for grandchildren255 87.5% Not responsible for grandchildren