Races in Willows, California (CA) Detailed Stats
Data:
Races - White alone (%)
Races - White alone (% change since 2000)
Races - Black alone (%)
Races - Black alone (% change since 2000)
Races - American Indian alone (%)
Races - American Indian alone (% change since 2000)
Races - Asian alone (%)
Races - Asian alone (% change since 2000)
Races - Hispanic (%)
Races - Hispanic (% change since 2000)
Races - Native Hawaiian and Other Pacific Islander alone (%)
Races - Native Hawaiian and Other Pacific Islander alone (% change since 2000)
Races - Two or more races(%)
Races - Two or more races(% change since 2000)
Races - Other race alone (%)
Races - Other race alone (% change since 2000)
Racial diversity
Place of birth - Born in state of residence (%)
Place of birth - Born in state of residence (%) - White
Place of birth - Born in state of residence (%) - Black or African American
Place of birth - Born in state of residence (%) - Asian
Place of birth - Born in state of residence (%) - Hispanic or Latino
Place of birth - Born in state of residence (%) - American Indian and Alaska Native
Place of birth - Born in state of residence (%) - Multirace
Place of birth - Born in state of residence (%) - Other Race
Place of birth - Born in other state (%)
Place of birth - Born in other state (%) - White
Place of birth - Born in other state (%) - Black or African American
Place of birth - Born in other state (%) - Asian
Place of birth - Born in other state (%) - Hispanic or Latino
Place of birth - Born in other state (%) - American Indian and Alaska Native
Place of birth - Born in other state (%) - Multirace
Place of birth - Born in other state (%) - Other Race
Place of birth - Native, outside of US (%)
Place of birth - Native, outside of US (%) - White
Place of birth - Native, outside of US (%) - Black or African American
Place of birth - Native, outside of US (%) - Asian
Place of birth - Native, outside of US (%) - Hispanic or Latino
Place of birth - Native, outside of US (%) - American Indian and Alaska Native
Place of birth - Native, outside of US (%) - Multirace
Place of birth - Native, outside of US (%) - Other Race
Place of birth - Foreign born (%)
Place of birth - Foreign born (%) - White
Place of birth - Foreign born (%) - Black or African American
Place of birth - Foreign born (%) - Asian
Place of birth - Foreign born (%) - Hispanic or Latino
Place of birth - Foreign born (%) - American Indian and Alaska Native
Place of birth - Foreign born (%) - Multirace
Place of birth - Foreign born (%) - Other Race
Residents speaking English at home (%)
Residents speaking English at home - Born in the United States (%)
Residents speaking English at home - Native, born elsewhere (%)
Residents speaking English at home - Foreign born (%)
Residents speaking Spanish at home (%)
Residents speaking Spanish at home - Born in the United States (%)
Residents speaking Spanish at home - Native, born elsewhere (%)
Residents speaking Spanish at home - Foreign born (%)
Residents speaking other language at home (%)
Residents speaking other language at home - Born in the United States (%)
Residents speaking other language at home - Native, born elsewhere (%)
Residents speaking other language at home - Foreign born (%)
Marital status - Never married (%)
Marital status - Now married (%)
Marital status - Separated (%)
Marital status - Widowed (%)
Marital status - Divorced (%)
Ancestries Reported - Arab (%)
Ancestries Reported - Czech (%)
Ancestries Reported - Danish (%)
Ancestries Reported - Dutch (%)
Ancestries Reported - English (%)
Ancestries Reported - French (%)
Ancestries Reported - French Canadian (%)
Ancestries Reported - German (%)
Ancestries Reported - Greek (%)
Ancestries Reported - Hungarian (%)
Ancestries Reported - Irish (%)
Ancestries Reported - Italian (%)
Ancestries Reported - Lithuanian (%)
Ancestries Reported - Norwegian (%)
Ancestries Reported - Polish (%)
Ancestries Reported - Portuguese (%)
Ancestries Reported - Russian (%)
Ancestries Reported - Scotch-Irish (%)
Ancestries Reported - Scottish (%)
Ancestries Reported - Slovak (%)
Ancestries Reported - Subsaharan African (%)
Ancestries Reported - Swedish (%)
Ancestries Reported - Swiss (%)
Ancestries Reported - Ukrainian (%)
Ancestries Reported - United States (%)
Ancestries Reported - Welsh (%)
Ancestries Reported - West Indian (%)
Ancestries Reported - Other (%)
Geographical mobility - Same house 1 year ago (%)
Geographical mobility - Same house 1 year ago (%) - White
Geographical mobility - Same house 1 year ago (%) - Black or African American
Geographical mobility - Same house 1 year ago (%) - Asian
Geographical mobility - Same house 1 year ago (%) - Hispanic or Latino
Geographical mobility - Same house 1 year ago (%) - American Indian and Alaska Native
Geographical mobility - Same house 1 year ago (%) - Multirace
Geographical mobility - Same house 1 year ago (%) - Other Race
Geographical mobility - Moved within same county (%)
Geographical mobility - Moved within same county (%) - White
Geographical mobility - Moved within same county (%) - Black or African American
Geographical mobility - Moved within same county (%) - Asian
Geographical mobility - Moved within same county (%) - Hispanic or Latino
Geographical mobility - Moved within same county (%) - American Indian and Alaska Native
Geographical mobility - Moved within same county (%) - Multirace
Geographical mobility - Moved within same county (%) - Other Race
Geographical mobility - Moved from different county within same state (%)
Geographical mobility - Moved from different county within same state (%) - White
Geographical mobility - Moved from different county within same state (%) - Black or African American
Geographical mobility - Moved from different county within same state (%) - Asian
Geographical mobility - Moved from different county within same state (%) - Hispanic or Latino
Geographical mobility - Moved from different county within same state (%) - American Indian and Alaska Native
Geographical mobility - Moved from different county within same state (%) - Multirace
Geographical mobility - Moved from different county within same state (%) - Other Race
Geographical mobility - Moved from different state (%)
Geographical mobility - Moved from different state (%) - White
Geographical mobility - Moved from different state (%) - Black or African American
Geographical mobility - Moved from different state (%) - Asian
Geographical mobility - Moved from different state (%) - Hispanic or Latino
Geographical mobility - Moved from different state (%) - American Indian and Alaska Native
Geographical mobility - Moved from different state (%) - Multirace
Geographical mobility - Moved from different state (%) - Other Race
Geographical mobility - Moved from abroad (%)
Geographical mobility - Moved from abroad (%) - White
Geographical mobility - Moved from abroad (%) - Black or African American
Geographical mobility - Moved from abroad (%) - Asian
Geographical mobility - Moved from abroad (%) - Hispanic or Latino
Geographical mobility - Moved from abroad (%) - American Indian and Alaska Native
Geographical mobility - Moved from abroad (%) - Multirace
Geographical mobility - Moved from abroad (%) - Other Race
Place of birth for the foreign-born population - Ireland (%)
Place of birth for the foreign-born population - Denmark (%)
Place of birth for the foreign-born population - Norway (%)
Place of birth for the foreign-born population - Sweden (%)
Place of birth for the foreign-born population - United Kingdom (%)
Place of birth for the foreign-born population - England (%)
Place of birth for the foreign-born population - Scotland (%)
Place of birth for the foreign-born population - Other Northern Europe (%)
Place of birth for the foreign-born population - Austria (%)
Place of birth for the foreign-born population - Belgium (%)
Place of birth for the foreign-born population - France (%)
Place of birth for the foreign-born population - Germany (%)
Place of birth for the foreign-born population - Netherlands (%)
Place of birth for the foreign-born population - Switzerland (%)
Place of birth for the foreign-born population - Other Western Europe (%)
Place of birth for the foreign-born population - Greece (%)
Place of birth for the foreign-born population - Italy (%)
Place of birth for the foreign-born population - Portugal (%)
Place of birth for the foreign-born population - Spain (%)
Place of birth for the foreign-born population - Other Southern Europe (%)
Place of birth for the foreign-born population - Albania (%)
Place of birth for the foreign-born population - Belarus (%)
Place of birth for the foreign-born population - Bosnia and Herzegovina (%)
Place of birth for the foreign-born population - Bulgaria (%)
Place of birth for the foreign-born population - Croatia (%)
Place of birth for the foreign-born population - Czechoslovakia (%)
Place of birth for the foreign-born population - Hungary (%)
Place of birth for the foreign-born population - Latvia (%)
Place of birth for the foreign-born population - Lithuania (%)
Place of birth for the foreign-born population - North Macedonia (Macedonia) (%)
Place of birth for the foreign-born population - Moldova (%)
Place of birth for the foreign-born population - Poland (%)
Place of birth for the foreign-born population - Romania (%)
Place of birth for the foreign-born population - Russia (%)
Place of birth for the foreign-born population - Serbia (%)
Place of birth for the foreign-born population - Ukraine (%)
Place of birth for the foreign-born population - Other Eastern Europe (%)
Place of birth for the foreign-born population - China (%)
Place of birth for the foreign-born population - Hong Kong (%)
Place of birth for the foreign-born population - Taiwan (%)
Place of birth for the foreign-born population - Japan (%)
Place of birth for the foreign-born population - Korea (%)
Place of birth for the foreign-born population - Other Eastern Asia (%)
Place of birth for the foreign-born population - Afghanistan (%)
Place of birth for the foreign-born population - Bangladesh (%)
Place of birth for the foreign-born population - India (%)
Place of birth for the foreign-born population - Iran (%)
Place of birth for the foreign-born population - Kazakhstan (%)
Place of birth for the foreign-born population - Nepal (%)
Place of birth for the foreign-born population - Pakistan (%)
Place of birth for the foreign-born population - Sri Lanka (%)
Place of birth for the foreign-born population - Uzbekistan (%)
Place of birth for the foreign-born population - Other South Central Asia (%)
Place of birth for the foreign-born population - Burma (%)
Place of birth for the foreign-born population - Cambodia (%)
Place of birth for the foreign-born population - Indonesia (%)
Place of birth for the foreign-born population - Laos (%)
Place of birth for the foreign-born population - Malaysia (%)
Place of birth for the foreign-born population - Philippines (%)
Place of birth for the foreign-born population - Singapore (%)
Place of birth for the foreign-born population - Thailand (%)
Place of birth for the foreign-born population - Vietnam (%)
Place of birth for the foreign-born population - Other South Eastern Asia (%)
Place of birth for the foreign-born population - Armenia (%)
Place of birth for the foreign-born population - Iraq (%)
Place of birth for the foreign-born population - Israel (%)
Place of birth for the foreign-born population - Jordan (%)
Place of birth for the foreign-born population - Kuwait (%)
Place of birth for the foreign-born population - Lebanon (%)
Place of birth for the foreign-born population - Saudi Arabia (%)
Place of birth for the foreign-born population - Syria (%)
Place of birth for the foreign-born population - Turkey (%)
Place of birth for the foreign-born population - Yemen (%)
Place of birth for the foreign-born population - Other Western Asia (%)
Place of birth for the foreign-born population - Eritrea (%)
Place of birth for the foreign-born population - Ethiopia (%)
Place of birth for the foreign-born population - Kenya (%)
Place of birth for the foreign-born population - Somalia (%)
Place of birth for the foreign-born population - Uganda (%)
Place of birth for the foreign-born population - Zimbabwe (%)
Place of birth for the foreign-born population - Other Eastern Africa (%)
Place of birth for the foreign-born population - Cameroon (%)
Place of birth for the foreign-born population - Congo (%)
Place of birth for the foreign-born population - Democratic Republic of Congo (Zaire) (%)
Place of birth for the foreign-born population - Other Middle Africa (%)
Place of birth for the foreign-born population - Egypt (%)
Place of birth for the foreign-born population - Morocco (%)
Place of birth for the foreign-born population - Sudan (%)
Place of birth for the foreign-born population - Other Northern Africa (%)
Place of birth for the foreign-born population - South Africa (%)
Place of birth for the foreign-born population - Other Southern Africa (%)
Place of birth for the foreign-born population - Cabo Verde (%)
Place of birth for the foreign-born population - Ghana (%)
Place of birth for the foreign-born population - Liberia (%)
Place of birth for the foreign-born population - Nigeria (%)
Place of birth for the foreign-born population - Senegal (%)
Place of birth for the foreign-born population - Sierra Leone (%)
Place of birth for the foreign-born population - Other Western Africa (%)
Place of birth for the foreign-born population - Australia (%)
Place of birth for the foreign-born population - New Zealand (%)
Place of birth for the foreign-born population - Fiji (%)
Place of birth for the foreign-born population - Micronesia (%)
Place of birth for the foreign-born population - Bahamas (%)
Place of birth for the foreign-born population - Barbados (%)
Place of birth for the foreign-born population - Cuba (%)
Place of birth for the foreign-born population - Dominica (%)
Place of birth for the foreign-born population - Dominican Republic (%)
Place of birth for the foreign-born population - Grenada (%)
Place of birth for the foreign-born population - Haiti (%)
Place of birth for the foreign-born population - Jamaica (%)
Place of birth for the foreign-born population - St. Vincent and the Grenadines (%)
Place of birth for the foreign-born population - Trinidad and Tobago (%)
Place of birth for the foreign-born population - West Indies (%)
Place of birth for the foreign-born population - Other Caribbean (%)
Place of birth for the foreign-born population - Belize (%)
Place of birth for the foreign-born population - Costa Rica (%)
Place of birth for the foreign-born population - El Salvador (%)
Place of birth for the foreign-born population - Guatemala (%)
Place of birth for the foreign-born population - Honduras (%)
Place of birth for the foreign-born population - Mexico (%)
Place of birth for the foreign-born population - Nicaragua (%)
Place of birth for the foreign-born population - Panama (%)
Place of birth for the foreign-born population - Other Central America (%)
Place of birth for the foreign-born population - Argentina (%)
Place of birth for the foreign-born population - Bolivia (%)
Place of birth for the foreign-born population - Brazil (%)
Place of birth for the foreign-born population - Chile (%)
Place of birth for the foreign-born population - Colombia (%)
Place of birth for the foreign-born population - Ecuador (%)
Place of birth for the foreign-born population - Guyana (%)
Place of birth for the foreign-born population - Peru (%)
Place of birth for the foreign-born population - Uruguay (%)
Place of birth for the foreign-born population - Venezuela (%)
Place of birth for the foreign-born population - Other South America (%)
Place of birth for the foreign-born population - Canada (%)
Place of birth for the foreign-born population - Other Northern America (%)
Place of birth for the foreign-born population - Other (%)
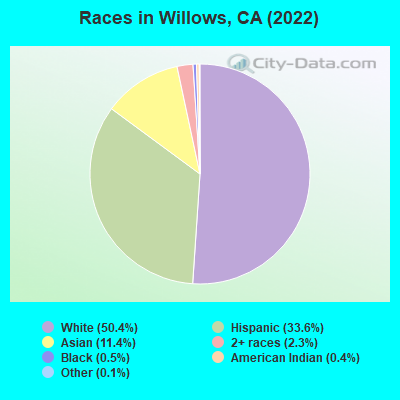
According to 2022 data, the most numerous races in Willows, CA are Hispanic (2,063 residents), White alone (2,759 residents), and Asian alone (644 residents). 63.7% of Willows residents speak English at home. 20.3% of Willows, CA residents are foreign-born (14.2% born in Latin America, 5.6% born in Asia), which is 28.2% less than the foreign-born rate of 26.0% across the entire state of California.
Race distribution in Willows
2000 2022
15,816,790 46.7% White alone 10,966,556 32.4% Hispanic 3,648,860 10.8% Asian alone 2,181,926 6.4% Black alone 903,115 2.7% Two or more races 178,984 0.5% American Indian alone 103,736 0.3% Native Hawaiian and Other 71,681 0.2% Other race alone
15,732,184 40.3% Hispanic 13,160,426 33.7% White alone 5,957,867 15.3% Asian alone 2,025,218 5.2% Black alone 1,663,222 4.3% Two or more races 251,618 0.6% Other race alone 135,777 0.3% Native Hawaiian and Other 103,030 0.3% American Indian alone
Income and house value in Willows Median household income in 2022 $53,477 White non-Hispanic householders$19,106 Black householders$62,498 American Indian and Alaska Native householders$128,306 Asian householdersover $200,000 Native Hawaiian and other Pacific Islander householders$105,184 Some other race householders$25,205 Two or more races householders$61,456 Hispanic or Latino race householdersMedian 2022 house value $333,654 White Non-Hispanic householders$323,936 American Indian or Alaska Native householders $303,060 Asian householders$494,903 Native Hawaiian and other Pacific Islander householders$299,461 Some other race householders$407,080 Two or more races householders$317,817 Hispanic or Latino householders
Median age by race in Willows
42.3 Median age for White residents39.0 50.6 36.6 Median age for Black or African American residents38.1 Median age for American Indian / Alaska Native residents51.4 Median age for Asian residents18.4 51.4 33.3 Median age for Other race residents34.3 20.1 14.5 Median age for Two or more races residents5.9 38.7 54.1 Median age for White alone residents50.2 55.2 28.2 Median age for Hispanic or Latino residents28.5 29.4
Owner/renter occupied households by race in Willows
House owners and renters - White residents 789 48.5% Owner occupied836 51.5% Renter occupiedHouse owners and renters - American Indian / Alaska Native residents 37 100.0% Renter occupiedHouse owners and renters - Asian residents 86 51.0% Owner occupied82 49.0% Renter occupiedHouse owners and renters - Other race residents 66 36.2% Owner occupied116 63.8% Renter occupiedHouse owners and renters - Two or more races residents 298 100.0% Renter occupiedHouse owners and renters - White alone residents 622 44.0% Owner occupied790 56.0% Renter occupiedHouse owners and renters - Hispanic or Latino residents 321 52.0% Owner occupied296 48.0% Renter occupied
Language usage in Willows
English speakers - Total 63.7% of residents of Willows speak English at home.
26.6% of residents speak Spanish at home 531 36.1% Speak English very well940 63.9% Speak English less than very well9.3% of residents speak other language at home 321 62.2% Speak English very well195 37.8% Speak English less than very well
English speakers - Born in the United States 97.5% of residents of Willows speak English at home.
2.0% of residents speak Spanish at home 12 100.0% Speak English very well
English speakers - Native, born elsewhere 89.4% of residents of Willows speak English at home.
10.6% of residents speak Spanish at home 11 100.0% Speak English very well
English speakers - Foreign-born 8.5% of residents of Willows speak English at home.
61.1% of residents speak Spanish at home 102 13.9% Speak English very well632 86.1% Speak English less than very well28.6% of residents speak other language at home 186 54.1% Speak English very well158 45.9% Speak English less than very well
White (Caucasian) - Speak another language Native:
13.4% (421)Foreign-born:
94.6% (224)
Black or African American - Speak only English Native:
99.4% (32)Foreign-born:
92.0% (79)
Asian - Speak only English Native:
29.9% (70)Foreign-born:
5.1% (18)
Asian - Speak another language Native:
67.0% (157)Foreign-born:
94.0% (327)
Other race - Speak another language Native:
88.8% (131)Foreign-born:
98.2% (442)
Two or more races - Speak another language Native:
13.0% (64)Foreign-born:
100.0% (94)
White alone - Speak another language Native:
1.8% (47)Foreign-born:
100.0% (21)
Hispanic or Latino - Speak another language Native:
64.1% (750)Foreign-born:
98.4% (730)
Foreign-born residents in Willows 1,229 residents are foreign born (14.2% Latin America , 5.6% Asia ).
This city:
20.3%California:
100.0%
Marital status for residents in Willows Marital status - White (Caucasian) population 15 years and over
Males 21.7% Never married54.3% Now married1.2% Separated2.7% Widowed20.1% DivorcedFemales 25.9% Never married41.9% Now married3.5% Separated13.3% Widowed15.4% DivorcedWomen who gave birth in the past 12 months Now married:
100.0% (95)Unmarried:
0.0% (0)
Women who did not give birth in the past 12 months Now married:
42.2% (222)Unmarried:
57.8% (303)
Marital status - Black or African American population 15 years and over
Males 6.5% Never married93.5% Now married0.0% Separated0.0% Widowed0.0% DivorcedFemales 100.0% Never married0.0% Now married0.0% Separated0.0% Widowed0.0% DivorcedWomen who did not give birth in the past 12 months Now married:
0.0% (0)Unmarried:
100.0% (17)
Marital status - American Indian / Alaska Native population 15 years and over
Males 33.3% Never married66.7% Now married0.0% Separated0.0% Widowed0.0% DivorcedFemales 0.0% Never married100.0% Now married0.0% Separated0.0% Widowed0.0% DivorcedWomen who gave birth in the past 12 months Now married:
100.0% (41)Unmarried:
0.0% (0)
Women who did not give birth in the past 12 months Now married:
100.0% (28)Unmarried:
0.0% (0)
Marital status - Asian population 15 years and over
Males 25.5% Never married45.8% Now married28.7% Separated0.0% Widowed0.0% DivorcedFemales 13.6% Never married52.5% Now married33.6% Separated0.4% Widowed0.0% DivorcedWomen who did not give birth in the past 12 months Now married:
77.5% (128)Unmarried:
22.5% (37)
Marital status - Other race population 15 years and over
Males 30.8% Never married69.2% Now married0.0% Separated0.0% Widowed0.0% DivorcedFemales 26.0% Never married69.4% Now married0.0% Separated0.0% Widowed4.6% DivorcedWomen who gave birth in the past 12 months Now married:
100.0% (60)Unmarried:
0.0% (0)
Women who did not give birth in the past 12 months Now married:
22.1% (17)Unmarried:
77.9% (60)
Marital status - Two or more races population 15 years and over
Males 36.4% Never married0.0% Now married0.0% Separated0.0% Widowed63.6% DivorcedFemales 31.2% Never married0.0% Now married0.0% Separated0.8% Widowed68.0% DivorcedWomen who did not give birth in the past 12 months Now married:
0.0% (0)Unmarried:
100.0% (115)
Marital status - White alone, not Hispanic / Latino population 15 years and over
Males 18.0% Never married50.6% Now married0.6% Separated3.9% Widowed26.9% DivorcedFemales 25.7% Never married40.0% Now married4.2% Separated15.7% Widowed14.4% DivorcedWomen who gave birth in the past 12 months Now married:
100.0% (111)Unmarried:
0.0% (0)
Women who did not give birth in the past 12 months Now married:
35.5% (145)Unmarried:
64.5% (264)
Marital status - Hispanic or Latino population 15 years and over
Males 29.7% Never married65.3% Now married1.6% Separated0.0% Widowed3.3% DivorcedFemales 27.1% Never married55.7% Now married0.0% Separated0.2% Widowed17.1% DivorcedWomen who gave birth in the past 12 months Now married:
100.0% (54)Unmarried:
0.0% (0)
Women who did not give birth in the past 12 months Now married:
46.7% (143)Unmarried:
53.3% (163)
Ancestries in Willows
258 7.8% American179 5.4% German150 4.5% English102 3.1% Italian93 2.8% Danish91 2.7% European43 1.3% Norwegian36 1.1% Scottish34 1.0% Irish22 0.7% Swedish15 0.5% Czech14 0.4% Northern European10 0.3% Polish10 0.3% Scotch-Irish10 0.3% Slovak6 0.2% Greek
Children Nativity (place of birth) in Willows
Children under 6 years - Living with two parents Both parents native 178 100.0% NativeBoth parents foreign-born 128 100.0% NativeOne native, one foreign-born parent 98 100.0% NativeChildren under 6 years - Living with one parent Native parent 29 100.0% NativeForeign-born parent 24 100.0% NativeChildren 6 to 17 years - Living with two parents Both parents native 357 100.0% Native0 0.0% Foreign-bornBoth parents foreign-born 371 93.4% Native26 6.6% Foreign-bornOne native, one foreign-born parent 31 100.0% NativeChildren 6 to 17 years - Living with one parent Native parent 141 100.0% NativeForeign-born parent 39 50.0% Native39 50.0% Foreign-born
Grandparents responsible for own grandchildren in Willows
Grandparents (30 to 59 years) White / Caucasian 21 100.0% Not responsible for grandchildrenWhite alone, not Hispanic / Latino 9 100.0% Not responsible for grandchildrenHispanic or Latino 22 100.0% Not responsible for grandchildren
Grandparents (60 years and over) Hispanic or Latino 109 100.0% Not responsible for grandchildren