Races in Winchester, Kentucky (KY) Detailed Stats
Data:
Races - White alone (%)
Races - White alone (% change since 2000)
Races - Black alone (%)
Races - Black alone (% change since 2000)
Races - American Indian alone (%)
Races - American Indian alone (% change since 2000)
Races - Asian alone (%)
Races - Asian alone (% change since 2000)
Races - Hispanic (%)
Races - Hispanic (% change since 2000)
Races - Native Hawaiian and Other Pacific Islander alone (%)
Races - Native Hawaiian and Other Pacific Islander alone (% change since 2000)
Races - Two or more races(%)
Races - Two or more races(% change since 2000)
Races - Other race alone (%)
Races - Other race alone (% change since 2000)
Racial diversity
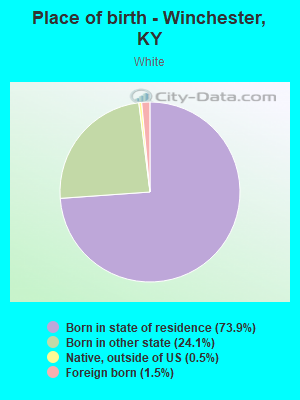
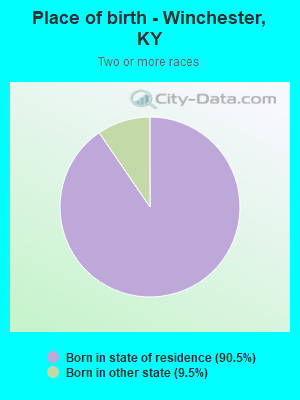
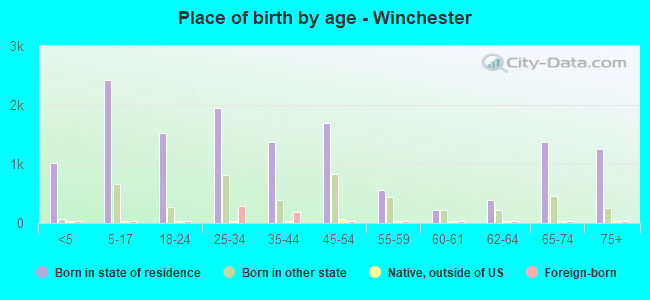
Place of birth - Born in state of residence (%)
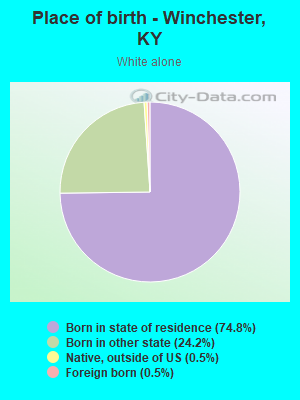
Place of birth - Born in state of residence (%) - White
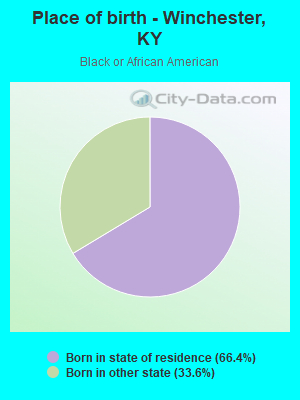
Place of birth - Born in state of residence (%) - Black or African American
Place of birth - Born in state of residence (%) - Asian
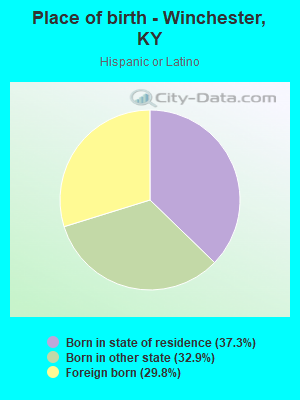
Place of birth - Born in state of residence (%) - Hispanic or Latino
Place of birth - Born in state of residence (%) - American Indian and Alaska Native
Place of birth - Born in state of residence (%) - Multirace
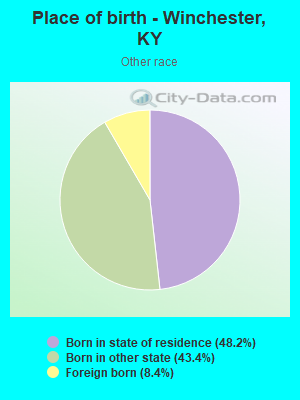
Place of birth - Born in state of residence (%) - Other Race
Place of birth - Born in other state (%)
Place of birth - Born in other state (%) - White
Place of birth - Born in other state (%) - Black or African American
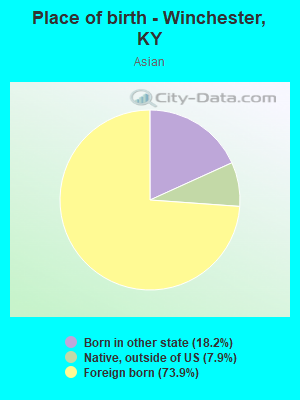
Place of birth - Born in other state (%) - Asian
Place of birth - Born in other state (%) - Hispanic or Latino
Place of birth - Born in other state (%) - American Indian and Alaska Native
Place of birth - Born in other state (%) - Multirace
Place of birth - Born in other state (%) - Other Race
Place of birth - Native, outside of US (%)
Place of birth - Native, outside of US (%) - White
Place of birth - Native, outside of US (%) - Black or African American
Place of birth - Native, outside of US (%) - Asian
Place of birth - Native, outside of US (%) - Hispanic or Latino
Place of birth - Native, outside of US (%) - American Indian and Alaska Native
Place of birth - Native, outside of US (%) - Multirace
Place of birth - Native, outside of US (%) - Other Race
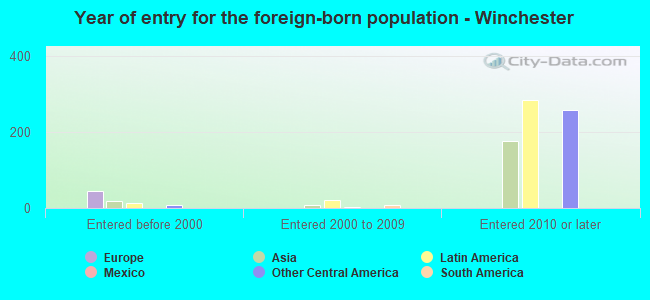
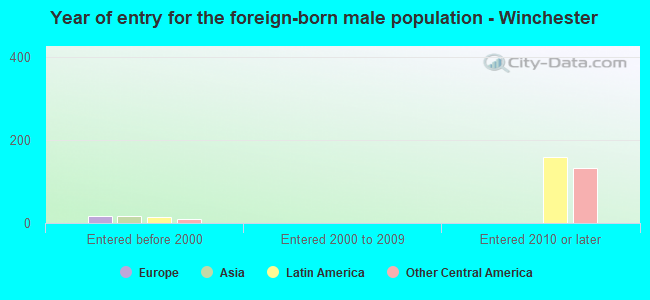
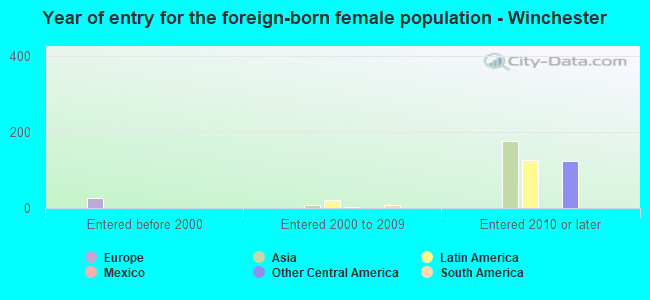
Place of birth - Foreign born (%)
Place of birth - Foreign born (%) - White
Place of birth - Foreign born (%) - Black or African American
Place of birth - Foreign born (%) - Asian
Place of birth - Foreign born (%) - Hispanic or Latino
Place of birth - Foreign born (%) - American Indian and Alaska Native
Place of birth - Foreign born (%) - Multirace
Place of birth - Foreign born (%) - Other Race
Residents speaking English at home (%)
Residents speaking English at home - Born in the United States (%)
Residents speaking English at home - Native, born elsewhere (%)
Residents speaking English at home - Foreign born (%)
Residents speaking Spanish at home (%)
Residents speaking Spanish at home - Born in the United States (%)
Residents speaking Spanish at home - Native, born elsewhere (%)
Residents speaking Spanish at home - Foreign born (%)
Residents speaking other language at home (%)
Residents speaking other language at home - Born in the United States (%)
Residents speaking other language at home - Native, born elsewhere (%)
Residents speaking other language at home - Foreign born (%)
Marital status - Never married (%)
Marital status - Now married (%)
Marital status - Separated (%)
Marital status - Widowed (%)
Marital status - Divorced (%)
Ancestries Reported - Arab (%)
Ancestries Reported - Czech (%)
Ancestries Reported - Danish (%)
Ancestries Reported - Dutch (%)
Ancestries Reported - English (%)
Ancestries Reported - French (%)
Ancestries Reported - French Canadian (%)
Ancestries Reported - German (%)
Ancestries Reported - Greek (%)
Ancestries Reported - Hungarian (%)
Ancestries Reported - Irish (%)
Ancestries Reported - Italian (%)
Ancestries Reported - Lithuanian (%)
Ancestries Reported - Norwegian (%)
Ancestries Reported - Polish (%)
Ancestries Reported - Portuguese (%)
Ancestries Reported - Russian (%)
Ancestries Reported - Scotch-Irish (%)
Ancestries Reported - Scottish (%)
Ancestries Reported - Slovak (%)
Ancestries Reported - Subsaharan African (%)
Ancestries Reported - Swedish (%)
Ancestries Reported - Swiss (%)
Ancestries Reported - Ukrainian (%)
Ancestries Reported - United States (%)
Ancestries Reported - Welsh (%)
Ancestries Reported - West Indian (%)
Ancestries Reported - Other (%)
Geographical mobility - Same house 1 year ago (%)
Geographical mobility - Same house 1 year ago (%) - White
Geographical mobility - Same house 1 year ago (%) - Black or African American
Geographical mobility - Same house 1 year ago (%) - Asian
Geographical mobility - Same house 1 year ago (%) - Hispanic or Latino
Geographical mobility - Same house 1 year ago (%) - American Indian and Alaska Native
Geographical mobility - Same house 1 year ago (%) - Multirace
Geographical mobility - Same house 1 year ago (%) - Other Race
Geographical mobility - Moved within same county (%)
Geographical mobility - Moved within same county (%) - White
Geographical mobility - Moved within same county (%) - Black or African American
Geographical mobility - Moved within same county (%) - Asian
Geographical mobility - Moved within same county (%) - Hispanic or Latino
Geographical mobility - Moved within same county (%) - American Indian and Alaska Native
Geographical mobility - Moved within same county (%) - Multirace
Geographical mobility - Moved within same county (%) - Other Race
Geographical mobility - Moved from different county within same state (%)
Geographical mobility - Moved from different county within same state (%) - White
Geographical mobility - Moved from different county within same state (%) - Black or African American
Geographical mobility - Moved from different county within same state (%) - Asian
Geographical mobility - Moved from different county within same state (%) - Hispanic or Latino
Geographical mobility - Moved from different county within same state (%) - American Indian and Alaska Native
Geographical mobility - Moved from different county within same state (%) - Multirace
Geographical mobility - Moved from different county within same state (%) - Other Race
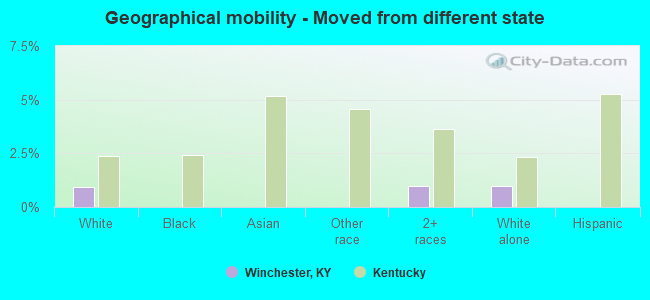
Geographical mobility - Moved from different state (%)
Geographical mobility - Moved from different state (%) - White
Geographical mobility - Moved from different state (%) - Black or African American
Geographical mobility - Moved from different state (%) - Asian
Geographical mobility - Moved from different state (%) - Hispanic or Latino
Geographical mobility - Moved from different state (%) - American Indian and Alaska Native
Geographical mobility - Moved from different state (%) - Multirace
Geographical mobility - Moved from different state (%) - Other Race
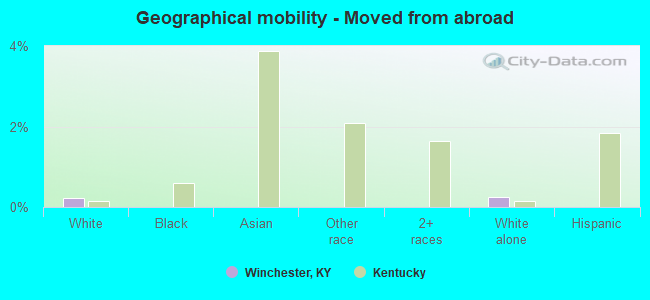
Geographical mobility - Moved from abroad (%)
Geographical mobility - Moved from abroad (%) - White
Geographical mobility - Moved from abroad (%) - Black or African American
Geographical mobility - Moved from abroad (%) - Asian
Geographical mobility - Moved from abroad (%) - Hispanic or Latino
Geographical mobility - Moved from abroad (%) - American Indian and Alaska Native
Geographical mobility - Moved from abroad (%) - Multirace
Geographical mobility - Moved from abroad (%) - Other Race
Place of birth for the foreign-born population - Ireland (%)
Place of birth for the foreign-born population - Denmark (%)
Place of birth for the foreign-born population - Norway (%)
Place of birth for the foreign-born population - Sweden (%)
Place of birth for the foreign-born population - United Kingdom (%)
Place of birth for the foreign-born population - England (%)
Place of birth for the foreign-born population - Scotland (%)
Place of birth for the foreign-born population - Other Northern Europe (%)
Place of birth for the foreign-born population - Austria (%)
Place of birth for the foreign-born population - Belgium (%)
Place of birth for the foreign-born population - France (%)
Place of birth for the foreign-born population - Germany (%)
Place of birth for the foreign-born population - Netherlands (%)
Place of birth for the foreign-born population - Switzerland (%)
Place of birth for the foreign-born population - Other Western Europe (%)
Place of birth for the foreign-born population - Greece (%)
Place of birth for the foreign-born population - Italy (%)
Place of birth for the foreign-born population - Portugal (%)
Place of birth for the foreign-born population - Spain (%)
Place of birth for the foreign-born population - Other Southern Europe (%)
Place of birth for the foreign-born population - Albania (%)
Place of birth for the foreign-born population - Belarus (%)
Place of birth for the foreign-born population - Bosnia and Herzegovina (%)
Place of birth for the foreign-born population - Bulgaria (%)
Place of birth for the foreign-born population - Croatia (%)
Place of birth for the foreign-born population - Czechoslovakia (%)
Place of birth for the foreign-born population - Hungary (%)
Place of birth for the foreign-born population - Latvia (%)
Place of birth for the foreign-born population - Lithuania (%)
Place of birth for the foreign-born population - North Macedonia (Macedonia) (%)
Place of birth for the foreign-born population - Moldova (%)
Place of birth for the foreign-born population - Poland (%)
Place of birth for the foreign-born population - Romania (%)
Place of birth for the foreign-born population - Russia (%)
Place of birth for the foreign-born population - Serbia (%)
Place of birth for the foreign-born population - Ukraine (%)
Place of birth for the foreign-born population - Other Eastern Europe (%)
Place of birth for the foreign-born population - China (%)
Place of birth for the foreign-born population - Hong Kong (%)
Place of birth for the foreign-born population - Taiwan (%)
Place of birth for the foreign-born population - Japan (%)
Place of birth for the foreign-born population - Korea (%)
Place of birth for the foreign-born population - Other Eastern Asia (%)
Place of birth for the foreign-born population - Afghanistan (%)
Place of birth for the foreign-born population - Bangladesh (%)
Place of birth for the foreign-born population - India (%)
Place of birth for the foreign-born population - Iran (%)
Place of birth for the foreign-born population - Kazakhstan (%)
Place of birth for the foreign-born population - Nepal (%)
Place of birth for the foreign-born population - Pakistan (%)
Place of birth for the foreign-born population - Sri Lanka (%)
Place of birth for the foreign-born population - Uzbekistan (%)
Place of birth for the foreign-born population - Other South Central Asia (%)
Place of birth for the foreign-born population - Burma (%)
Place of birth for the foreign-born population - Cambodia (%)
Place of birth for the foreign-born population - Indonesia (%)
Place of birth for the foreign-born population - Laos (%)
Place of birth for the foreign-born population - Malaysia (%)
Place of birth for the foreign-born population - Philippines (%)
Place of birth for the foreign-born population - Singapore (%)
Place of birth for the foreign-born population - Thailand (%)
Place of birth for the foreign-born population - Vietnam (%)
Place of birth for the foreign-born population - Other South Eastern Asia (%)
Place of birth for the foreign-born population - Armenia (%)
Place of birth for the foreign-born population - Iraq (%)
Place of birth for the foreign-born population - Israel (%)
Place of birth for the foreign-born population - Jordan (%)
Place of birth for the foreign-born population - Kuwait (%)
Place of birth for the foreign-born population - Lebanon (%)
Place of birth for the foreign-born population - Saudi Arabia (%)
Place of birth for the foreign-born population - Syria (%)
Place of birth for the foreign-born population - Turkey (%)
Place of birth for the foreign-born population - Yemen (%)
Place of birth for the foreign-born population - Other Western Asia (%)
Place of birth for the foreign-born population - Eritrea (%)
Place of birth for the foreign-born population - Ethiopia (%)
Place of birth for the foreign-born population - Kenya (%)
Place of birth for the foreign-born population - Somalia (%)
Place of birth for the foreign-born population - Uganda (%)
Place of birth for the foreign-born population - Zimbabwe (%)
Place of birth for the foreign-born population - Other Eastern Africa (%)
Place of birth for the foreign-born population - Cameroon (%)
Place of birth for the foreign-born population - Congo (%)
Place of birth for the foreign-born population - Democratic Republic of Congo (Zaire) (%)
Place of birth for the foreign-born population - Other Middle Africa (%)
Place of birth for the foreign-born population - Egypt (%)
Place of birth for the foreign-born population - Morocco (%)
Place of birth for the foreign-born population - Sudan (%)
Place of birth for the foreign-born population - Other Northern Africa (%)
Place of birth for the foreign-born population - South Africa (%)
Place of birth for the foreign-born population - Other Southern Africa (%)
Place of birth for the foreign-born population - Cabo Verde (%)
Place of birth for the foreign-born population - Ghana (%)
Place of birth for the foreign-born population - Liberia (%)
Place of birth for the foreign-born population - Nigeria (%)
Place of birth for the foreign-born population - Senegal (%)
Place of birth for the foreign-born population - Sierra Leone (%)
Place of birth for the foreign-born population - Other Western Africa (%)
Place of birth for the foreign-born population - Australia (%)
Place of birth for the foreign-born population - New Zealand (%)
Place of birth for the foreign-born population - Fiji (%)
Place of birth for the foreign-born population - Micronesia (%)
Place of birth for the foreign-born population - Bahamas (%)
Place of birth for the foreign-born population - Barbados (%)
Place of birth for the foreign-born population - Cuba (%)
Place of birth for the foreign-born population - Dominica (%)
Place of birth for the foreign-born population - Dominican Republic (%)
Place of birth for the foreign-born population - Grenada (%)
Place of birth for the foreign-born population - Haiti (%)
Place of birth for the foreign-born population - Jamaica (%)
Place of birth for the foreign-born population - St. Vincent and the Grenadines (%)
Place of birth for the foreign-born population - Trinidad and Tobago (%)
Place of birth for the foreign-born population - West Indies (%)
Place of birth for the foreign-born population - Other Caribbean (%)
Place of birth for the foreign-born population - Belize (%)
Place of birth for the foreign-born population - Costa Rica (%)
Place of birth for the foreign-born population - El Salvador (%)
Place of birth for the foreign-born population - Guatemala (%)
Place of birth for the foreign-born population - Honduras (%)
Place of birth for the foreign-born population - Mexico (%)
Place of birth for the foreign-born population - Nicaragua (%)
Place of birth for the foreign-born population - Panama (%)
Place of birth for the foreign-born population - Other Central America (%)
Place of birth for the foreign-born population - Argentina (%)
Place of birth for the foreign-born population - Bolivia (%)
Place of birth for the foreign-born population - Brazil (%)
Place of birth for the foreign-born population - Chile (%)
Place of birth for the foreign-born population - Colombia (%)
Place of birth for the foreign-born population - Ecuador (%)
Place of birth for the foreign-born population - Guyana (%)
Place of birth for the foreign-born population - Peru (%)
Place of birth for the foreign-born population - Uruguay (%)
Place of birth for the foreign-born population - Venezuela (%)
Place of birth for the foreign-born population - Other South America (%)
Place of birth for the foreign-born population - Canada (%)
Place of birth for the foreign-born population - Other Northern America (%)
Place of birth for the foreign-born population - Other (%)
Latest news about races in Winchester, KY collected exclusively by city-data.com from local newspapers, TV, and radio stations
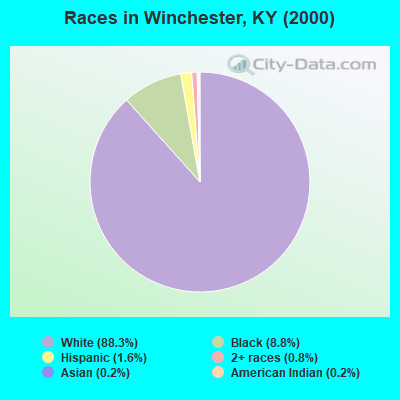
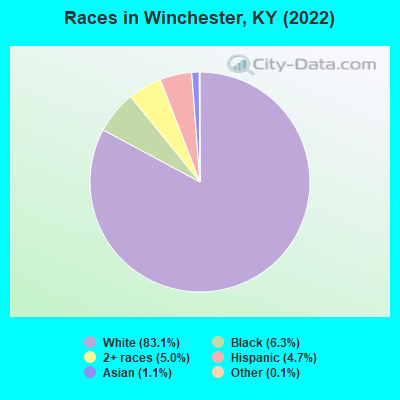
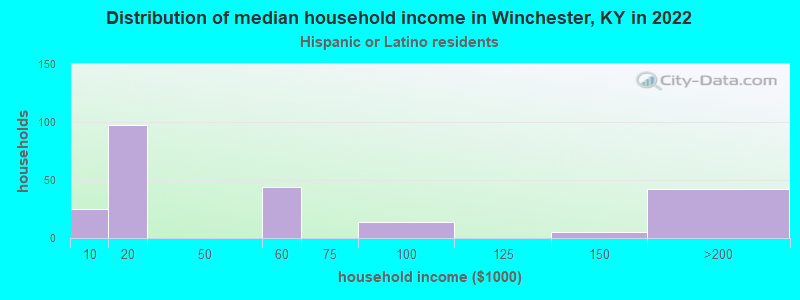
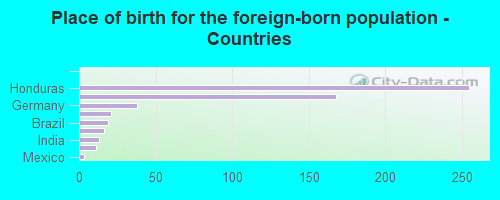
According to 2022 data, the most numerous races in Winchester, KY are White alone (15,881 residents), Black alone (1,200 residents), and Hispanic (906 residents). 95.9% of Winchester residents speak English at home. 2.9% of Winchester, KY residents are foreign-born (1.5% born in Latin America, 1.0% born in Asia), which is 39.8% less than the foreign-born rate of 4.0% across the entire state of Kentucky.
Race distribution in Winchester
2000 2022
3,608,013 89.3% White alone 293,639 7.3% Black alone 59,939 1.5% Hispanic 37,750 0.9% Two or more races 29,368 0.7% Asian alone 7,939 0.2% American Indian alone 3,846 0.10% Other race alone 1,275 0.03% Native Hawaiian and Other
3,710,998 82.2% White alone 343,194 7.6% Black alone 187,483 4.2% Hispanic 187,394 4.2% Two or more races 62,240 1.4% Asian alone 13,529 0.3% Other race alone 4,302 0.10% American Indian alone 3,170 0.07% Native Hawaiian and Other
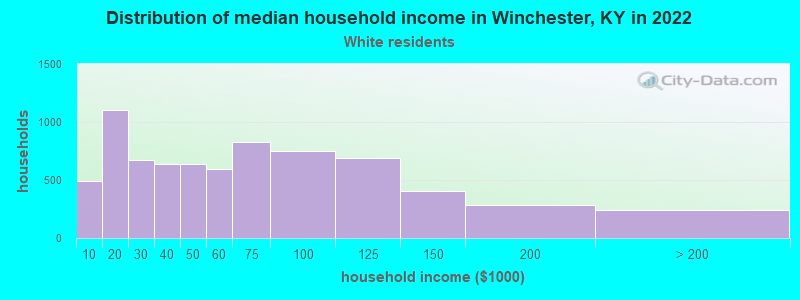
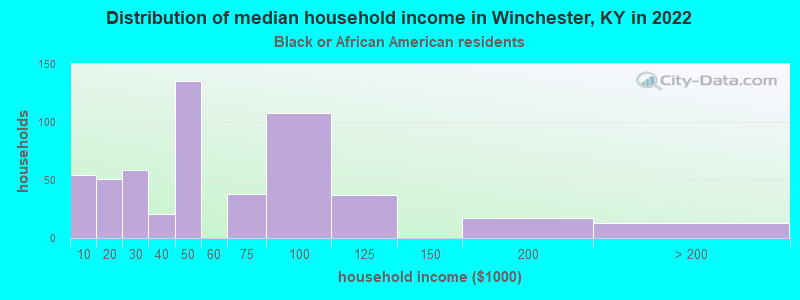
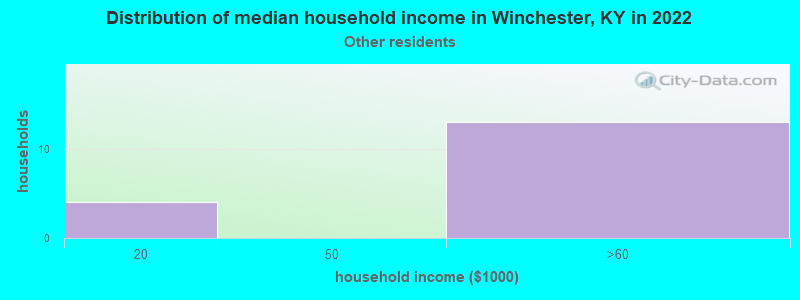
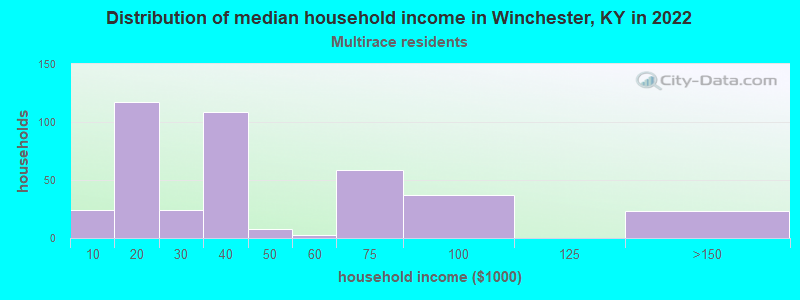
Income and house value in Winchester Median household income in 2022 $52,415 White non-Hispanic householders$48,285 Black householders$38,781 Two or more races householdersMedian 2022 house value $188,947 White Non-Hispanic householders$138,348 Black or African American householders$170,941 Two or more races householders
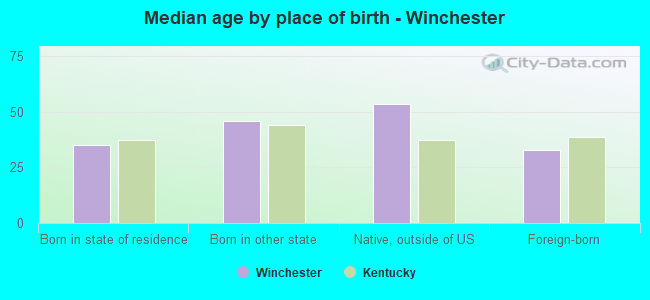
Median age by race in Winchester
38.4 Median age for White residents34.8 42.2 52.5 Median age for Black or African American residents53.5 49.5 -521,556,256.1 Median age for American Indian / Alaska Native residents-607,449,856.1 -630,065,358.8 43.2 Median age for Asian residents-688,492,062.8 44.1 -755,186,721.2 Median age for Native Hawaiian / Pacific Islander residents-724,043,715.1 -853,801,168.7 17.1 Median age for Other race residents16.6 14.2 26.4 Median age for Two or more races residents26.7 28.6 39.7 Median age for White alone residents36.6 43.1 27.5 Median age for Hispanic or Latino residents15.1 27.5
Owner/renter occupied households by race in Winchester
House owners and renters - White residents 4,391 60.0% Owner occupied2,922 40.0% Renter occupiedHouse owners and renters - Black or African American residents 372 69.3% Owner occupied165 30.7% Renter occupiedHouse owners and renters - Asian residents 18 100.0% Owner occupiedHouse owners and renters - Other race residents 24 100.0% Renter occupiedHouse owners and renters - Two or more races residents 258 62.1% Owner occupied158 37.9% Renter occupiedHouse owners and renters - White alone residents 4,319 60.7% Owner occupied2,800 39.3% Renter occupiedHouse owners and renters - Hispanic or Latino residents 116 43.2% Owner occupied153 56.8% Renter occupied
Language usage in Winchester
English speakers - Total 95.9% of residents of Winchester speak English at home.
2.4% of residents speak Spanish at home 168 38.1% Speak English very well273 61.9% Speak English less than very well1.6% of residents speak other language at home 81 28.6% Speak English very well202 71.4% Speak English less than very well
English speakers - Born in the United States 97.7% of residents of Winchester speak English at home.
0.9% of residents speak Spanish at home 29 69.0% Speak English very well13 31.0% Speak English less than very well1.3% of residents speak other language at home 60 100.0% Speak English very well
English speakers - Native, born elsewhere 81.8% of residents of Winchester speak English at home.
15.5% of residents speak other language at home 17 100.0% Speak English very well
English speakers - Foreign-born 11.4% of residents of Winchester speak English at home.
52.0% of residents speak Spanish at home 15 5.5% Speak English very well259 94.5% Speak English less than very well38.0% of residents speak other language at home 200 100.0% Speak English less than very well
White (Caucasian) - Speak only English Native:
99.6% (15,035)Foreign-born:
22.0% (53)
White (Caucasian) - Speak another language Native:
0.5% (70)Foreign-born:
74.2% (179)
Asian - Speak another language Native:
100.0% (51)Foreign-born:
100.0% (161)
Other race - Speak another language Native:
43.0% (113)Foreign-born:
98.6% (24)
White alone - Speak only English Native:
99.4% (14,874)Foreign-born:
71.8% (56)
White alone - Speak another language Native:
0.5% (79)Foreign-born:
31.9% (25)
Hispanic or Latino - Speak another language Native:
22.4% (109)Foreign-born:
100.0% (267)
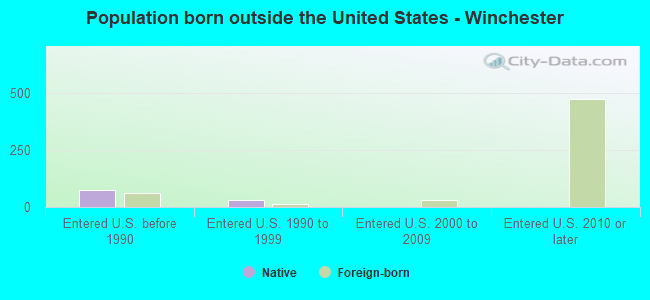
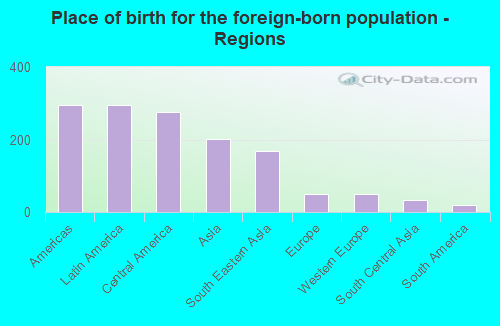
Foreign-born residents in Winchester 547 residents are foreign born (1.5% Latin America , 1.0% Asia ).
This city:
2.9%Kentucky:
4.1%
Marital status for residents in Winchester Marital status - White (Caucasian) population 15 years and over
Males 33.4% Never married47.6% Now married2.0% Separated2.6% Widowed14.4% DivorcedFemales 25.1% Never married39.6% Now married3.0% Separated10.6% Widowed21.7% DivorcedWomen who gave birth in the past 12 months Now married:
72.9% (141)Unmarried:
27.1% (53)
Women who did not give birth in the past 12 months Now married:
41.9% (1,533)Unmarried:
58.1% (2,127)
Marital status - Black or African American population 15 years and over
Males 32.0% Never married43.9% Now married12.0% Separated9.5% Widowed2.7% DivorcedFemales 35.7% Never married27.3% Now married9.0% Separated13.2% Widowed14.8% DivorcedWomen who did not give birth in the past 12 months Now married:
35.5% (82)Unmarried:
64.5% (148)
Marital status - Asian population 15 years and over
Males 0.0% Never married100.0% Now married0.0% Separated0.0% Widowed0.0% DivorcedFemales 0.0% Never married100.0% Now married0.0% Separated0.0% Widowed0.0% DivorcedWomen who did not give birth in the past 12 months Now married:
100.0% (159)Unmarried:
0.0% (0)
Marital status - Other race population 15 years and over
Males 77.1% Never married22.9% Now married0.0% Separated0.0% Widowed0.0% DivorcedFemales 94.9% Never married0.0% Now married5.1% Separated0.0% Widowed0.0% DivorcedWomen who did not give birth in the past 12 months Now married:
5.1% (4)Unmarried:
94.9% (74)
Marital status - Two or more races population 15 years and over
Males 83.4% Never married11.9% Now married0.0% Separated0.0% Widowed4.7% DivorcedFemales 65.5% Never married14.5% Now married0.0% Separated4.5% Widowed15.5% DivorcedWomen who did not give birth in the past 12 months Now married:
16.3% (40)Unmarried:
83.7% (207)
Marital status - White alone, not Hispanic / Latino population 15 years and over
Males 32.0% Never married48.5% Now married2.1% Separated2.7% Widowed14.7% DivorcedFemales 23.6% Never married40.6% Now married3.1% Separated10.4% Widowed22.2% DivorcedWomen who gave birth in the past 12 months Now married:
82.4% (143)Unmarried:
17.6% (31)
Women who did not give birth in the past 12 months Now married:
43.4% (1,529)Unmarried:
56.6% (1,993)
Marital status - Hispanic or Latino population 15 years and over
Males 86.2% Never married13.8% Now married0.0% Separated0.0% Widowed0.0% DivorcedFemales 68.0% Never married13.4% Now married0.9% Separated12.7% Widowed5.0% DivorcedWomen who gave birth in the past 12 months Now married:
0.0% (0)Unmarried:
100.0% (25)
Women who did not give birth in the past 12 months Now married:
16.5% (46)Unmarried:
83.5% (230)
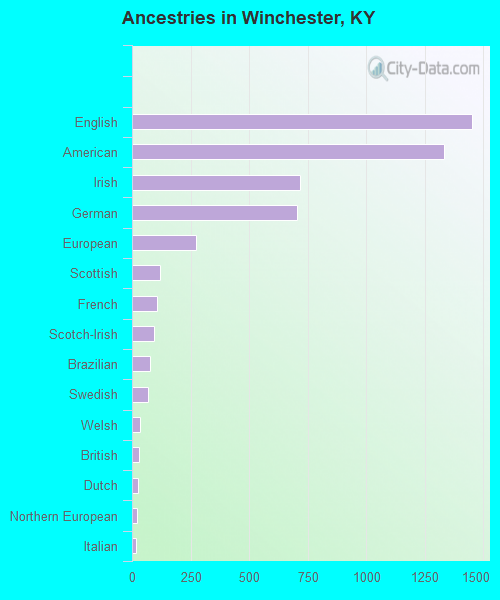
Ancestries in Winchester
1,451 19.5% English1,333 17.9% American718 9.6% Irish705 9.5% German272 3.7% European121 1.6% Scottish108 1.4% French92 1.2% Scotch-Irish78 1.0% Brazilian68 0.9% Swedish35 0.5% Welsh28 0.4% British25 0.3% Dutch21 0.3% Northern European15 0.2% Italian10 0.1% Greek9 0.1% Iranian
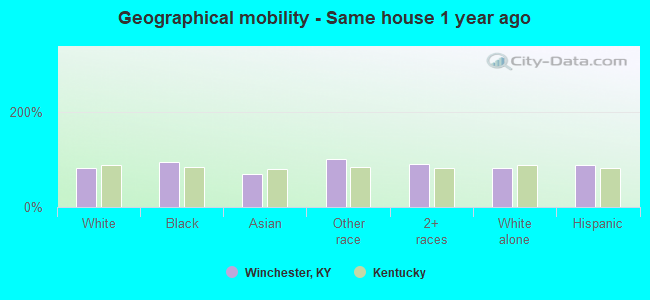
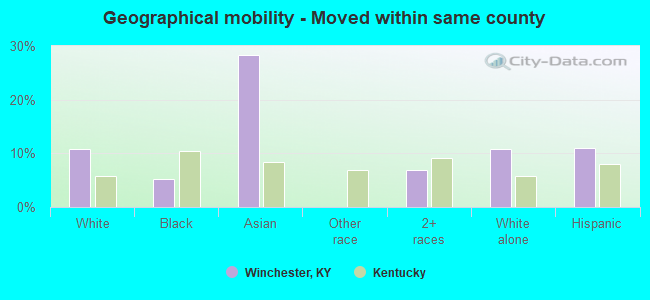
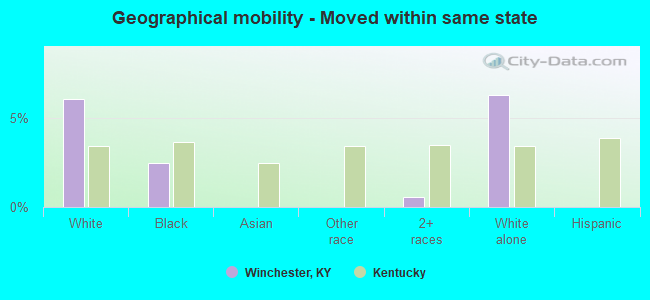
Geographical mobility in Winchester Same house 1 year ago 13,121 81.2% White (Caucasian)1,125 93.9% Black or African American148 69.7% Asian298 100.0% Other race951 91.3% Two or more races12,706 80.8% White alone, not Hispanic / Latino774 87.6% Hispanic or LatinoMoved within same county 1,739 10.8% White / Caucasian63 5.3% Black or African American60 28.3% Asian73 7.0% Two or more races1,699 10.8% White alone, not Hispanic / Latino97 11.0% Hispanic or LatinoMoved within same state 973 6.0% White / Caucasian30 2.5% Black or African American6 0.6% Two or more races982 6.2% White alone, not Hispanic / LatinoMoved from different state 152 0.9% White / Caucasian10 1.0% Two or more races155 1.0% White alone, not Hispanic / LatinoMoved from abroad 36 0.2% White38 0.2% White alone, not Hispanic / Latino
Children Nativity (place of birth) in Winchester
Children under 6 years - Living with two parents Both parents native 517 100.0% NativeChildren under 6 years - Living with one parent Native parent 542 100.0% NativeForeign-born parent 105 100.0% NativeChildren 6 to 17 years - Living with two parents Both parents native 1,164 100.0% NativeOne native, one foreign-born parent 40 100.0% NativeChildren 6 to 17 years - Living with one parent Native parent 1,098 100.0% NativeForeign-born parent 114 49.5% Native116 50.5% Foreign-born
Grandparents responsible for own grandchildren in Winchester
Grandparents (30 to 59 years) White / Caucasian 239 88.4% Responsible for grandchildren32 11.6% Not responsible for grandchildrenWhite alone, not Hispanic / Latino 240 88.2% Responsible for grandchildren32 11.8% Not responsible for grandchildrenGrandparents (60 years and over) White / Caucasian 82 41.7% Responsible for grandchildren114 58.3% Not responsible for grandchildrenWhite alone, not Hispanic / Latino 82 41.5% Responsible for grandchildren116 58.5% Not responsible for grandchildren