Races in Xenia, Ohio (OH) Detailed Stats
Data:
Races - White alone (%)
Races - White alone (% change since 2000)
Races - Black alone (%)
Races - Black alone (% change since 2000)
Races - American Indian alone (%)
Races - American Indian alone (% change since 2000)
Races - Asian alone (%)
Races - Asian alone (% change since 2000)
Races - Hispanic (%)
Races - Hispanic (% change since 2000)
Races - Native Hawaiian and Other Pacific Islander alone (%)
Races - Native Hawaiian and Other Pacific Islander alone (% change since 2000)
Races - Two or more races(%)
Races - Two or more races(% change since 2000)
Races - Other race alone (%)
Races - Other race alone (% change since 2000)
Racial diversity
Place of birth - Born in state of residence (%)
Place of birth - Born in state of residence (%) - White
Place of birth - Born in state of residence (%) - Black or African American
Place of birth - Born in state of residence (%) - Asian
Place of birth - Born in state of residence (%) - Hispanic or Latino
Place of birth - Born in state of residence (%) - American Indian and Alaska Native
Place of birth - Born in state of residence (%) - Multirace
Place of birth - Born in state of residence (%) - Other Race
Place of birth - Born in other state (%)
Place of birth - Born in other state (%) - White
Place of birth - Born in other state (%) - Black or African American
Place of birth - Born in other state (%) - Asian
Place of birth - Born in other state (%) - Hispanic or Latino
Place of birth - Born in other state (%) - American Indian and Alaska Native
Place of birth - Born in other state (%) - Multirace
Place of birth - Born in other state (%) - Other Race
Place of birth - Native, outside of US (%)
Place of birth - Native, outside of US (%) - White
Place of birth - Native, outside of US (%) - Black or African American
Place of birth - Native, outside of US (%) - Asian
Place of birth - Native, outside of US (%) - Hispanic or Latino
Place of birth - Native, outside of US (%) - American Indian and Alaska Native
Place of birth - Native, outside of US (%) - Multirace
Place of birth - Native, outside of US (%) - Other Race
Place of birth - Foreign born (%)
Place of birth - Foreign born (%) - White
Place of birth - Foreign born (%) - Black or African American
Place of birth - Foreign born (%) - Asian
Place of birth - Foreign born (%) - Hispanic or Latino
Place of birth - Foreign born (%) - American Indian and Alaska Native
Place of birth - Foreign born (%) - Multirace
Place of birth - Foreign born (%) - Other Race
Residents speaking English at home (%)
Residents speaking English at home - Born in the United States (%)
Residents speaking English at home - Native, born elsewhere (%)
Residents speaking English at home - Foreign born (%)
Residents speaking Spanish at home (%)
Residents speaking Spanish at home - Born in the United States (%)
Residents speaking Spanish at home - Native, born elsewhere (%)
Residents speaking Spanish at home - Foreign born (%)
Residents speaking other language at home (%)
Residents speaking other language at home - Born in the United States (%)
Residents speaking other language at home - Native, born elsewhere (%)
Residents speaking other language at home - Foreign born (%)
Marital status - Never married (%)
Marital status - Now married (%)
Marital status - Separated (%)
Marital status - Widowed (%)
Marital status - Divorced (%)
Ancestries Reported - Arab (%)
Ancestries Reported - Czech (%)
Ancestries Reported - Danish (%)
Ancestries Reported - Dutch (%)
Ancestries Reported - English (%)
Ancestries Reported - French (%)
Ancestries Reported - French Canadian (%)
Ancestries Reported - German (%)
Ancestries Reported - Greek (%)
Ancestries Reported - Hungarian (%)
Ancestries Reported - Irish (%)
Ancestries Reported - Italian (%)
Ancestries Reported - Lithuanian (%)
Ancestries Reported - Norwegian (%)
Ancestries Reported - Polish (%)
Ancestries Reported - Portuguese (%)
Ancestries Reported - Russian (%)
Ancestries Reported - Scotch-Irish (%)
Ancestries Reported - Scottish (%)
Ancestries Reported - Slovak (%)
Ancestries Reported - Subsaharan African (%)
Ancestries Reported - Swedish (%)
Ancestries Reported - Swiss (%)
Ancestries Reported - Ukrainian (%)
Ancestries Reported - United States (%)
Ancestries Reported - Welsh (%)
Ancestries Reported - West Indian (%)
Ancestries Reported - Other (%)
Geographical mobility - Same house 1 year ago (%)
Geographical mobility - Same house 1 year ago (%) - White
Geographical mobility - Same house 1 year ago (%) - Black or African American
Geographical mobility - Same house 1 year ago (%) - Asian
Geographical mobility - Same house 1 year ago (%) - Hispanic or Latino
Geographical mobility - Same house 1 year ago (%) - American Indian and Alaska Native
Geographical mobility - Same house 1 year ago (%) - Multirace
Geographical mobility - Same house 1 year ago (%) - Other Race
Geographical mobility - Moved within same county (%)
Geographical mobility - Moved within same county (%) - White
Geographical mobility - Moved within same county (%) - Black or African American
Geographical mobility - Moved within same county (%) - Asian
Geographical mobility - Moved within same county (%) - Hispanic or Latino
Geographical mobility - Moved within same county (%) - American Indian and Alaska Native
Geographical mobility - Moved within same county (%) - Multirace
Geographical mobility - Moved within same county (%) - Other Race
Geographical mobility - Moved from different county within same state (%)
Geographical mobility - Moved from different county within same state (%) - White
Geographical mobility - Moved from different county within same state (%) - Black or African American
Geographical mobility - Moved from different county within same state (%) - Asian
Geographical mobility - Moved from different county within same state (%) - Hispanic or Latino
Geographical mobility - Moved from different county within same state (%) - American Indian and Alaska Native
Geographical mobility - Moved from different county within same state (%) - Multirace
Geographical mobility - Moved from different county within same state (%) - Other Race
Geographical mobility - Moved from different state (%)
Geographical mobility - Moved from different state (%) - White
Geographical mobility - Moved from different state (%) - Black or African American
Geographical mobility - Moved from different state (%) - Asian
Geographical mobility - Moved from different state (%) - Hispanic or Latino
Geographical mobility - Moved from different state (%) - American Indian and Alaska Native
Geographical mobility - Moved from different state (%) - Multirace
Geographical mobility - Moved from different state (%) - Other Race
Geographical mobility - Moved from abroad (%)
Geographical mobility - Moved from abroad (%) - White
Geographical mobility - Moved from abroad (%) - Black or African American
Geographical mobility - Moved from abroad (%) - Asian
Geographical mobility - Moved from abroad (%) - Hispanic or Latino
Geographical mobility - Moved from abroad (%) - American Indian and Alaska Native
Geographical mobility - Moved from abroad (%) - Multirace
Geographical mobility - Moved from abroad (%) - Other Race
Place of birth for the foreign-born population - Ireland (%)
Place of birth for the foreign-born population - Denmark (%)
Place of birth for the foreign-born population - Norway (%)
Place of birth for the foreign-born population - Sweden (%)
Place of birth for the foreign-born population - United Kingdom (%)
Place of birth for the foreign-born population - England (%)
Place of birth for the foreign-born population - Scotland (%)
Place of birth for the foreign-born population - Other Northern Europe (%)
Place of birth for the foreign-born population - Austria (%)
Place of birth for the foreign-born population - Belgium (%)
Place of birth for the foreign-born population - France (%)
Place of birth for the foreign-born population - Germany (%)
Place of birth for the foreign-born population - Netherlands (%)
Place of birth for the foreign-born population - Switzerland (%)
Place of birth for the foreign-born population - Other Western Europe (%)
Place of birth for the foreign-born population - Greece (%)
Place of birth for the foreign-born population - Italy (%)
Place of birth for the foreign-born population - Portugal (%)
Place of birth for the foreign-born population - Spain (%)
Place of birth for the foreign-born population - Other Southern Europe (%)
Place of birth for the foreign-born population - Albania (%)
Place of birth for the foreign-born population - Belarus (%)
Place of birth for the foreign-born population - Bosnia and Herzegovina (%)
Place of birth for the foreign-born population - Bulgaria (%)
Place of birth for the foreign-born population - Croatia (%)
Place of birth for the foreign-born population - Czechoslovakia (%)
Place of birth for the foreign-born population - Hungary (%)
Place of birth for the foreign-born population - Latvia (%)
Place of birth for the foreign-born population - Lithuania (%)
Place of birth for the foreign-born population - North Macedonia (Macedonia) (%)
Place of birth for the foreign-born population - Moldova (%)
Place of birth for the foreign-born population - Poland (%)
Place of birth for the foreign-born population - Romania (%)
Place of birth for the foreign-born population - Russia (%)
Place of birth for the foreign-born population - Serbia (%)
Place of birth for the foreign-born population - Ukraine (%)
Place of birth for the foreign-born population - Other Eastern Europe (%)
Place of birth for the foreign-born population - China (%)
Place of birth for the foreign-born population - Hong Kong (%)
Place of birth for the foreign-born population - Taiwan (%)
Place of birth for the foreign-born population - Japan (%)
Place of birth for the foreign-born population - Korea (%)
Place of birth for the foreign-born population - Other Eastern Asia (%)
Place of birth for the foreign-born population - Afghanistan (%)
Place of birth for the foreign-born population - Bangladesh (%)
Place of birth for the foreign-born population - India (%)
Place of birth for the foreign-born population - Iran (%)
Place of birth for the foreign-born population - Kazakhstan (%)
Place of birth for the foreign-born population - Nepal (%)
Place of birth for the foreign-born population - Pakistan (%)
Place of birth for the foreign-born population - Sri Lanka (%)
Place of birth for the foreign-born population - Uzbekistan (%)
Place of birth for the foreign-born population - Other South Central Asia (%)
Place of birth for the foreign-born population - Burma (%)
Place of birth for the foreign-born population - Cambodia (%)
Place of birth for the foreign-born population - Indonesia (%)
Place of birth for the foreign-born population - Laos (%)
Place of birth for the foreign-born population - Malaysia (%)
Place of birth for the foreign-born population - Philippines (%)
Place of birth for the foreign-born population - Singapore (%)
Place of birth for the foreign-born population - Thailand (%)
Place of birth for the foreign-born population - Vietnam (%)
Place of birth for the foreign-born population - Other South Eastern Asia (%)
Place of birth for the foreign-born population - Armenia (%)
Place of birth for the foreign-born population - Iraq (%)
Place of birth for the foreign-born population - Israel (%)
Place of birth for the foreign-born population - Jordan (%)
Place of birth for the foreign-born population - Kuwait (%)
Place of birth for the foreign-born population - Lebanon (%)
Place of birth for the foreign-born population - Saudi Arabia (%)
Place of birth for the foreign-born population - Syria (%)
Place of birth for the foreign-born population - Turkey (%)
Place of birth for the foreign-born population - Yemen (%)
Place of birth for the foreign-born population - Other Western Asia (%)
Place of birth for the foreign-born population - Eritrea (%)
Place of birth for the foreign-born population - Ethiopia (%)
Place of birth for the foreign-born population - Kenya (%)
Place of birth for the foreign-born population - Somalia (%)
Place of birth for the foreign-born population - Uganda (%)
Place of birth for the foreign-born population - Zimbabwe (%)
Place of birth for the foreign-born population - Other Eastern Africa (%)
Place of birth for the foreign-born population - Cameroon (%)
Place of birth for the foreign-born population - Congo (%)
Place of birth for the foreign-born population - Democratic Republic of Congo (Zaire) (%)
Place of birth for the foreign-born population - Other Middle Africa (%)
Place of birth for the foreign-born population - Egypt (%)
Place of birth for the foreign-born population - Morocco (%)
Place of birth for the foreign-born population - Sudan (%)
Place of birth for the foreign-born population - Other Northern Africa (%)
Place of birth for the foreign-born population - South Africa (%)
Place of birth for the foreign-born population - Other Southern Africa (%)
Place of birth for the foreign-born population - Cabo Verde (%)
Place of birth for the foreign-born population - Ghana (%)
Place of birth for the foreign-born population - Liberia (%)
Place of birth for the foreign-born population - Nigeria (%)
Place of birth for the foreign-born population - Senegal (%)
Place of birth for the foreign-born population - Sierra Leone (%)
Place of birth for the foreign-born population - Other Western Africa (%)
Place of birth for the foreign-born population - Australia (%)
Place of birth for the foreign-born population - New Zealand (%)
Place of birth for the foreign-born population - Fiji (%)
Place of birth for the foreign-born population - Micronesia (%)
Place of birth for the foreign-born population - Bahamas (%)
Place of birth for the foreign-born population - Barbados (%)
Place of birth for the foreign-born population - Cuba (%)
Place of birth for the foreign-born population - Dominica (%)
Place of birth for the foreign-born population - Dominican Republic (%)
Place of birth for the foreign-born population - Grenada (%)
Place of birth for the foreign-born population - Haiti (%)
Place of birth for the foreign-born population - Jamaica (%)
Place of birth for the foreign-born population - St. Vincent and the Grenadines (%)
Place of birth for the foreign-born population - Trinidad and Tobago (%)
Place of birth for the foreign-born population - West Indies (%)
Place of birth for the foreign-born population - Other Caribbean (%)
Place of birth for the foreign-born population - Belize (%)
Place of birth for the foreign-born population - Costa Rica (%)
Place of birth for the foreign-born population - El Salvador (%)
Place of birth for the foreign-born population - Guatemala (%)
Place of birth for the foreign-born population - Honduras (%)
Place of birth for the foreign-born population - Mexico (%)
Place of birth for the foreign-born population - Nicaragua (%)
Place of birth for the foreign-born population - Panama (%)
Place of birth for the foreign-born population - Other Central America (%)
Place of birth for the foreign-born population - Argentina (%)
Place of birth for the foreign-born population - Bolivia (%)
Place of birth for the foreign-born population - Brazil (%)
Place of birth for the foreign-born population - Chile (%)
Place of birth for the foreign-born population - Colombia (%)
Place of birth for the foreign-born population - Ecuador (%)
Place of birth for the foreign-born population - Guyana (%)
Place of birth for the foreign-born population - Peru (%)
Place of birth for the foreign-born population - Uruguay (%)
Place of birth for the foreign-born population - Venezuela (%)
Place of birth for the foreign-born population - Other South America (%)
Place of birth for the foreign-born population - Canada (%)
Place of birth for the foreign-born population - Other Northern America (%)
Place of birth for the foreign-born population - Other (%)
Latest news about races in Xenia, OH collected exclusively by city-data.com from local newspapers, TV, and radio stations
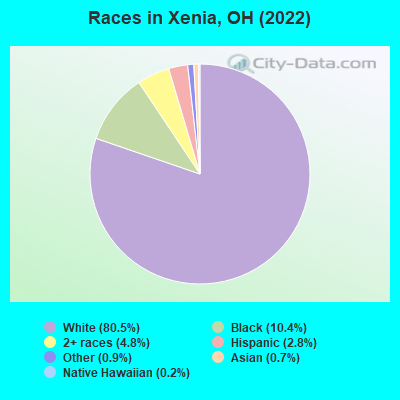
According to 2022 data, the most numerous races in Xenia, OH are White alone (20,633 residents), Black alone (2,667 residents), and Two or more races (1,220 residents). 97.0% of Xenia residents speak English at home. 2.9% of Xenia, OH residents are foreign-born (0.8% born in Africa, 0.6% born in Europe, 0.6% born in Latin America, 0.5% born in Asia, 0.3% born in North America), which is 36.9% less than the foreign-born rate of 4.0% across the entire state of Ohio.
Race distribution in Xenia
2000 2022
9,538,111 84.0% White alone 1,290,662 11.4% Black alone 217,123 1.9% Hispanic 137,770 1.2% Two or more races 131,670 1.2% Asian alone 21,985 0.2% American Indian alone 13,483 0.1% Other race alone 2,336 0.02% Native Hawaiian and Other
8,948,793 76.1% White alone 1,401,403 11.9% Black alone 529,291 4.5% Two or more races 517,232 4.4% Hispanic 293,387 2.5% Asian alone 52,805 0.4% Other race alone 9,785 0.08% American Indian alone 3,362 0.03% Native Hawaiian and Other
Income and house value in Xenia Median household income in 2022 $60,070 White non-Hispanic householders$35,147 Black householders$24,407 Some other race householders$50,101 Two or more races householders$24,609 Hispanic or Latino race householdersMedian 2022 house value $154,526 White Non-Hispanic householders$139,167 Black or African American householders$140,478 American Indian or Alaska Native householders $160,894 Asian householders$257,544 Native Hawaiian and other Pacific Islander householders$147,783 Some other race householders$126,805 Two or more races householders$139,167 Hispanic or Latino householders
Median age by race in Xenia
40.0 Median age for White residents38.6 43.0 40.8 Median age for Black or African American residents27.6 54.5 62.5 Median age for American Indian / Alaska Native residents-665,067,945.0 51.5 48.8 Median age for Asian residents14.3 82.1 10.4 Median age for Native Hawaiian / Pacific Islander residents-666,666,666.0 10.5 34.4 Median age for Other race residents40.2 28.9 19.4 Median age for Two or more races residents21.3 21.5 40.8 Median age for White alone residents38.8 43.9 25.1 Median age for Hispanic or Latino residents20.5 21.4
Owner/renter occupied households by race in Xenia
House owners and renters - White residents 5,482 61.9% Owner occupied3,377 38.1% Renter occupiedHouse owners and renters - Black or African American residents 308 38.8% Owner occupied486 61.2% Renter occupiedHouse owners and renters - American Indian / Alaska Native residents 11 33.1% Owner occupied22 66.9% Renter occupiedHouse owners and renters - Asian residents 2 5.1% Owner occupied41 94.9% Renter occupiedHouse owners and renters - Other race residents 48 27.1% Owner occupied129 72.9% Renter occupiedHouse owners and renters - Two or more races residents 241 45.7% Owner occupied286 54.3% Renter occupiedHouse owners and renters - White alone residents 5,477 62.4% Owner occupied3,301 37.6% Renter occupiedHouse owners and renters - Hispanic or Latino residents 47 37.2% Owner occupied79 62.8% Renter occupied
Language usage in Xenia
English speakers - Total 97.0% of residents of Xenia speak English at home.
1.4% of residents speak Spanish at home 222 65.3% Speak English very well118 34.7% Speak English less than very well2.0% of residents speak other language at home 302 63.7% Speak English very well172 36.3% Speak English less than very well
English speakers - Born in the United States 93.2% of residents of Xenia speak English at home.
4.9% of residents speak Spanish at home 171 74.3% Speak English very well59 25.7% Speak English less than very well1.3% of residents speak other language at home 62 100.0% Speak English very well
English speakers - Native, born elsewhere 85.4% of residents of Xenia speak English at home.
3.3% of residents speak Spanish at home 8 100.0% Speak English very well8.3% of residents speak other language at home 20 100.0% Speak English very well
English speakers - Foreign-born 51.0% of residents of Xenia speak English at home.
7.6% of residents speak Spanish at home 22 43.1% Speak English very well29 56.9% Speak English less than very well45.8% of residents speak other language at home 126 41.2% Speak English very well180 58.8% Speak English less than very well
White (Caucasian) - Speak only English Native:
98.9% (19,410)Foreign-born:
94.9% (132)
White (Caucasian) - Speak another language Native:
1.1% (224)Foreign-born:
20.6% (29)
Black or African American - Speak only English Native:
98.6% (1,975)Foreign-born:
46.3% (151)
Black or African American - Speak another language Native:
1.3% (27)Foreign-born:
55.6% (181)
Asian - Speak only English Native:
100.0% (39)Foreign-born:
19.3% (25)
Asian - Speak another language Native:
3.0% (1)Foreign-born:
79.2% (102)
Other race - Speak only English Native:
50.6% (175)Foreign-born:
33.5% (47)
Other race - Speak another language Native:
49.9% (173)Foreign-born:
58.9% (82)
Two or more races - Speak another language Native:
10.0% (170)Foreign-born:
100.0% (9)
White alone - Speak only English Native:
99.0% (19,229)Foreign-born:
100.0% (129)
White alone - Speak another language Native:
1.0% (190)Foreign-born:
13.9% (18)
Hispanic or Latino - Speak only English Native:
57.3% (370)Foreign-born:
59.4% (50)
Hispanic or Latino - Speak another language Native:
34.6% (223)Foreign-born:
65.0% (54)
Foreign-born residents in Xenia 749 residents are foreign born (0.8% Africa , 0.6% Europe , 0.6% Latin America , 0.5% Asia , 0.3% North America ).
Marital status for residents in Xenia Marital status - White (Caucasian) population 15 years and over
Males 32.1% Never married49.5% Now married1.4% Separated3.7% Widowed13.3% DivorcedFemales 28.7% Never married41.9% Now married2.1% Separated9.9% Widowed17.4% DivorcedWomen who gave birth in the past 12 months Now married:
60.2% (231)Unmarried:
39.8% (153)
Women who did not give birth in the past 12 months Now married:
39.4% (1,699)Unmarried:
60.6% (2,612)
Marital status - Black or African American population 15 years and over
Males 66.4% Never married24.4% Now married0.1% Separated1.6% Widowed7.5% DivorcedFemales 40.5% Never married22.3% Now married14.8% Separated5.4% Widowed17.0% DivorcedWomen who gave birth in the past 12 months Now married:
0.0% (0)Unmarried:
100.0% (17)
Women who did not give birth in the past 12 months Now married:
43.5% (199)Unmarried:
56.5% (259)
Marital status - American Indian / Alaska Native population 15 years and over
Males 0.0% Never married100.0% Now married0.0% Separated0.0% Widowed0.0% DivorcedFemales 0.0% Never married40.7% Now married0.0% Separated59.3% Widowed0.0% DivorcedWomen who did not give birth in the past 12 months Now married:
100.0% (10)Unmarried:
0.0% (0)
Marital status - Asian population 15 years and over
Males 34.0% Never married0.0% Now married0.0% Separated0.0% Widowed66.0% DivorcedFemales 10.5% Never married9.2% Now married0.0% Separated80.3% Widowed0.0% DivorcedWomen who did not give birth in the past 12 months Now married:
0.0% (0)Unmarried:
100.0% (8)
Marital status - Other race population 15 years and over
Males 58.2% Never married41.8% Now married0.0% Separated0.0% Widowed0.0% DivorcedFemales 17.1% Never married72.1% Now married5.4% Separated0.0% Widowed5.4% DivorcedWomen who did not give birth in the past 12 months Now married:
71.8% (98)Unmarried:
28.2% (38)
Marital status - Two or more races population 15 years and over
Males 47.6% Never married48.2% Now married2.4% Separated0.0% Widowed1.8% DivorcedFemales 60.4% Never married15.0% Now married4.3% Separated9.5% Widowed10.7% DivorcedWomen who gave birth in the past 12 months Now married:
0.0% (0)Unmarried:
100.0% (15)
Women who did not give birth in the past 12 months Now married:
20.7% (84)Unmarried:
79.3% (323)
Marital status - White alone, not Hispanic / Latino population 15 years and over
Males 32.0% Never married49.5% Now married1.4% Separated3.7% Widowed13.3% DivorcedFemales 28.5% Never married41.7% Now married2.1% Separated10.1% Widowed17.6% DivorcedWomen who gave birth in the past 12 months Now married:
60.2% (227)Unmarried:
39.8% (151)
Women who did not give birth in the past 12 months Now married:
39.0% (1,605)Unmarried:
61.0% (2,516)
Marital status - Hispanic or Latino population 15 years and over
Males 52.4% Never married47.6% Now married0.0% Separated0.0% Widowed0.0% DivorcedFemales 31.1% Never married63.1% Now married2.9% Separated0.0% Widowed2.9% DivorcedWomen who did not give birth in the past 12 months Now married:
65.0% (163)Unmarried:
35.0% (88)
Ancestries in Xenia
1,795 16.8% American1,616 15.1% English1,504 14.1% German998 9.3% Irish291 2.7% Italian278 2.6% Scottish222 2.1% European131 1.2% Kenyan91 0.9% Polish90 0.8% Nigerian86 0.8% Dutch81 0.8% African56 0.5% Scotch-Irish52 0.5% Swedish51 0.5% Brazilian51 0.5% Norwegian50 0.5% British50 0.5% Haitian46 0.4% French33 0.3% Hungarian29 0.3% Swiss22 0.2% Greek15 0.1% Pennsylvania German14 0.1% Israeli12 0.1% Jamaican8 0.07% Czech8 0.07% Northern European7 0.07% Russian7 0.07% Scandinavian4 0.04% Romanian
Geographical mobility in Xenia Same house 1 year ago 17,970 87.5% White (Caucasian)2,099 80.0% Black or African American45 100.0% American Indian / Alaska Native179 100.0% Asian54 100.0% Native Hawaiian / Pacific Islander462 90.7% Other race1,219 81.0% Two or more races17,843 87.8% White alone, not Hispanic / Latino632 87.9% Hispanic or LatinoMoved within same county 1,365 6.7% White / Caucasian458 17.5% Black or African American8 1.5% Other race210 13.9% Two or more races1,369 6.7% White alone, not Hispanic / Latino5 0.7% Hispanic or LatinoMoved within same state 1,131 5.5% White / Caucasian87 3.3% Black or African American3 1.9% Asian137 9.1% Two or more races1,082 5.3% White alone, not Hispanic / Latino43 5.9% Hispanic or LatinoMoved from different state 54 0.3% White / Caucasian11 0.4% Black or African American12 2.3% Other race52 0.3% White alone, not Hispanic / LatinoMoved from abroad 99 0.5% White33 1.2% Black or African American37 7.3% Other race73 0.4% White alone, not Hispanic / Latino73 10.2% Hispanic or Latino
Children Nativity (place of birth) in Xenia
Children under 6 years - Living with two parents Both parents native 893 98.6% Native12 1.4% Foreign-bornBoth parents foreign-born 16 100.0% NativeOne native, one foreign-born parent 37 100.0% NativeChildren under 6 years - Living with one parent Native parent 883 100.0% NativeForeign-born parent 18 100.0% NativeChildren 6 to 17 years - Living with two parents Both parents native 1,590 100.0% NativeBoth parents foreign-born 20 100.0% NativeOne native, one foreign-born parent 84 100.0% NativeChildren 6 to 17 years - Living with one parent Native parent 1,388 100.0% NativeForeign-born parent 81 60.2% Native53 39.8% Foreign-born
Grandparents responsible for own grandchildren in Xenia
Grandparents (30 to 59 years) White / Caucasian 110 65.9% Responsible for grandchildren57 34.1% Not responsible for grandchildrenOther race 8 100.0% Responsible for grandchildrenTwo or more races 65 100.0% Responsible for grandchildrenWhite alone, not Hispanic / Latino 110 65.9% Responsible for grandchildren57 34.1% Not responsible for grandchildrenHispanic or Latino 10 100.0% Responsible for grandchildrenGrandparents (60 years and over) White / Caucasian 148 56.6% Responsible for grandchildren113 43.4% Not responsible for grandchildrenWhite alone, not Hispanic / Latino 148 56.6% Responsible for grandchildren113 43.4% Not responsible for grandchildren