Races in Zanesville, Ohio (OH) Detailed Stats
Data:
Races - White alone (%)
Races - White alone (% change since 2000)
Races - Black alone (%)
Races - Black alone (% change since 2000)
Races - American Indian alone (%)
Races - American Indian alone (% change since 2000)
Races - Asian alone (%)
Races - Asian alone (% change since 2000)
Races - Hispanic (%)
Races - Hispanic (% change since 2000)
Races - Native Hawaiian and Other Pacific Islander alone (%)
Races - Native Hawaiian and Other Pacific Islander alone (% change since 2000)
Races - Two or more races(%)
Races - Two or more races(% change since 2000)
Races - Other race alone (%)
Races - Other race alone (% change since 2000)
Racial diversity
Place of birth - Born in state of residence (%)
Place of birth - Born in state of residence (%) - White
Place of birth - Born in state of residence (%) - Black or African American
Place of birth - Born in state of residence (%) - Asian
Place of birth - Born in state of residence (%) - Hispanic or Latino
Place of birth - Born in state of residence (%) - American Indian and Alaska Native
Place of birth - Born in state of residence (%) - Multirace
Place of birth - Born in state of residence (%) - Other Race
Place of birth - Born in other state (%)
Place of birth - Born in other state (%) - White
Place of birth - Born in other state (%) - Black or African American
Place of birth - Born in other state (%) - Asian
Place of birth - Born in other state (%) - Hispanic or Latino
Place of birth - Born in other state (%) - American Indian and Alaska Native
Place of birth - Born in other state (%) - Multirace
Place of birth - Born in other state (%) - Other Race
Place of birth - Native, outside of US (%)
Place of birth - Native, outside of US (%) - White
Place of birth - Native, outside of US (%) - Black or African American
Place of birth - Native, outside of US (%) - Asian
Place of birth - Native, outside of US (%) - Hispanic or Latino
Place of birth - Native, outside of US (%) - American Indian and Alaska Native
Place of birth - Native, outside of US (%) - Multirace
Place of birth - Native, outside of US (%) - Other Race
Place of birth - Foreign born (%)
Place of birth - Foreign born (%) - White
Place of birth - Foreign born (%) - Black or African American
Place of birth - Foreign born (%) - Asian
Place of birth - Foreign born (%) - Hispanic or Latino
Place of birth - Foreign born (%) - American Indian and Alaska Native
Place of birth - Foreign born (%) - Multirace
Place of birth - Foreign born (%) - Other Race
Residents speaking English at home (%)
Residents speaking English at home - Born in the United States (%)
Residents speaking English at home - Native, born elsewhere (%)
Residents speaking English at home - Foreign born (%)
Residents speaking Spanish at home (%)
Residents speaking Spanish at home - Born in the United States (%)
Residents speaking Spanish at home - Native, born elsewhere (%)
Residents speaking Spanish at home - Foreign born (%)
Residents speaking other language at home (%)
Residents speaking other language at home - Born in the United States (%)
Residents speaking other language at home - Native, born elsewhere (%)
Residents speaking other language at home - Foreign born (%)
Marital status - Never married (%)
Marital status - Now married (%)
Marital status - Separated (%)
Marital status - Widowed (%)
Marital status - Divorced (%)
Ancestries Reported - Arab (%)
Ancestries Reported - Czech (%)
Ancestries Reported - Danish (%)
Ancestries Reported - Dutch (%)
Ancestries Reported - English (%)
Ancestries Reported - French (%)
Ancestries Reported - French Canadian (%)
Ancestries Reported - German (%)
Ancestries Reported - Greek (%)
Ancestries Reported - Hungarian (%)
Ancestries Reported - Irish (%)
Ancestries Reported - Italian (%)
Ancestries Reported - Lithuanian (%)
Ancestries Reported - Norwegian (%)
Ancestries Reported - Polish (%)
Ancestries Reported - Portuguese (%)
Ancestries Reported - Russian (%)
Ancestries Reported - Scotch-Irish (%)
Ancestries Reported - Scottish (%)
Ancestries Reported - Slovak (%)
Ancestries Reported - Subsaharan African (%)
Ancestries Reported - Swedish (%)
Ancestries Reported - Swiss (%)
Ancestries Reported - Ukrainian (%)
Ancestries Reported - United States (%)
Ancestries Reported - Welsh (%)
Ancestries Reported - West Indian (%)
Ancestries Reported - Other (%)
Geographical mobility - Same house 1 year ago (%)
Geographical mobility - Same house 1 year ago (%) - White
Geographical mobility - Same house 1 year ago (%) - Black or African American
Geographical mobility - Same house 1 year ago (%) - Asian
Geographical mobility - Same house 1 year ago (%) - Hispanic or Latino
Geographical mobility - Same house 1 year ago (%) - American Indian and Alaska Native
Geographical mobility - Same house 1 year ago (%) - Multirace
Geographical mobility - Same house 1 year ago (%) - Other Race
Geographical mobility - Moved within same county (%)
Geographical mobility - Moved within same county (%) - White
Geographical mobility - Moved within same county (%) - Black or African American
Geographical mobility - Moved within same county (%) - Asian
Geographical mobility - Moved within same county (%) - Hispanic or Latino
Geographical mobility - Moved within same county (%) - American Indian and Alaska Native
Geographical mobility - Moved within same county (%) - Multirace
Geographical mobility - Moved within same county (%) - Other Race
Geographical mobility - Moved from different county within same state (%)
Geographical mobility - Moved from different county within same state (%) - White
Geographical mobility - Moved from different county within same state (%) - Black or African American
Geographical mobility - Moved from different county within same state (%) - Asian
Geographical mobility - Moved from different county within same state (%) - Hispanic or Latino
Geographical mobility - Moved from different county within same state (%) - American Indian and Alaska Native
Geographical mobility - Moved from different county within same state (%) - Multirace
Geographical mobility - Moved from different county within same state (%) - Other Race
Geographical mobility - Moved from different state (%)
Geographical mobility - Moved from different state (%) - White
Geographical mobility - Moved from different state (%) - Black or African American
Geographical mobility - Moved from different state (%) - Asian
Geographical mobility - Moved from different state (%) - Hispanic or Latino
Geographical mobility - Moved from different state (%) - American Indian and Alaska Native
Geographical mobility - Moved from different state (%) - Multirace
Geographical mobility - Moved from different state (%) - Other Race
Geographical mobility - Moved from abroad (%)
Geographical mobility - Moved from abroad (%) - White
Geographical mobility - Moved from abroad (%) - Black or African American
Geographical mobility - Moved from abroad (%) - Asian
Geographical mobility - Moved from abroad (%) - Hispanic or Latino
Geographical mobility - Moved from abroad (%) - American Indian and Alaska Native
Geographical mobility - Moved from abroad (%) - Multirace
Geographical mobility - Moved from abroad (%) - Other Race
Place of birth for the foreign-born population - Ireland (%)
Place of birth for the foreign-born population - Denmark (%)
Place of birth for the foreign-born population - Norway (%)
Place of birth for the foreign-born population - Sweden (%)
Place of birth for the foreign-born population - United Kingdom (%)
Place of birth for the foreign-born population - England (%)
Place of birth for the foreign-born population - Scotland (%)
Place of birth for the foreign-born population - Other Northern Europe (%)
Place of birth for the foreign-born population - Austria (%)
Place of birth for the foreign-born population - Belgium (%)
Place of birth for the foreign-born population - France (%)
Place of birth for the foreign-born population - Germany (%)
Place of birth for the foreign-born population - Netherlands (%)
Place of birth for the foreign-born population - Switzerland (%)
Place of birth for the foreign-born population - Other Western Europe (%)
Place of birth for the foreign-born population - Greece (%)
Place of birth for the foreign-born population - Italy (%)
Place of birth for the foreign-born population - Portugal (%)
Place of birth for the foreign-born population - Spain (%)
Place of birth for the foreign-born population - Other Southern Europe (%)
Place of birth for the foreign-born population - Albania (%)
Place of birth for the foreign-born population - Belarus (%)
Place of birth for the foreign-born population - Bosnia and Herzegovina (%)
Place of birth for the foreign-born population - Bulgaria (%)
Place of birth for the foreign-born population - Croatia (%)
Place of birth for the foreign-born population - Czechoslovakia (%)
Place of birth for the foreign-born population - Hungary (%)
Place of birth for the foreign-born population - Latvia (%)
Place of birth for the foreign-born population - Lithuania (%)
Place of birth for the foreign-born population - North Macedonia (Macedonia) (%)
Place of birth for the foreign-born population - Moldova (%)
Place of birth for the foreign-born population - Poland (%)
Place of birth for the foreign-born population - Romania (%)
Place of birth for the foreign-born population - Russia (%)
Place of birth for the foreign-born population - Serbia (%)
Place of birth for the foreign-born population - Ukraine (%)
Place of birth for the foreign-born population - Other Eastern Europe (%)
Place of birth for the foreign-born population - China (%)
Place of birth for the foreign-born population - Hong Kong (%)
Place of birth for the foreign-born population - Taiwan (%)
Place of birth for the foreign-born population - Japan (%)
Place of birth for the foreign-born population - Korea (%)
Place of birth for the foreign-born population - Other Eastern Asia (%)
Place of birth for the foreign-born population - Afghanistan (%)
Place of birth for the foreign-born population - Bangladesh (%)
Place of birth for the foreign-born population - India (%)
Place of birth for the foreign-born population - Iran (%)
Place of birth for the foreign-born population - Kazakhstan (%)
Place of birth for the foreign-born population - Nepal (%)
Place of birth for the foreign-born population - Pakistan (%)
Place of birth for the foreign-born population - Sri Lanka (%)
Place of birth for the foreign-born population - Uzbekistan (%)
Place of birth for the foreign-born population - Other South Central Asia (%)
Place of birth for the foreign-born population - Burma (%)
Place of birth for the foreign-born population - Cambodia (%)
Place of birth for the foreign-born population - Indonesia (%)
Place of birth for the foreign-born population - Laos (%)
Place of birth for the foreign-born population - Malaysia (%)
Place of birth for the foreign-born population - Philippines (%)
Place of birth for the foreign-born population - Singapore (%)
Place of birth for the foreign-born population - Thailand (%)
Place of birth for the foreign-born population - Vietnam (%)
Place of birth for the foreign-born population - Other South Eastern Asia (%)
Place of birth for the foreign-born population - Armenia (%)
Place of birth for the foreign-born population - Iraq (%)
Place of birth for the foreign-born population - Israel (%)
Place of birth for the foreign-born population - Jordan (%)
Place of birth for the foreign-born population - Kuwait (%)
Place of birth for the foreign-born population - Lebanon (%)
Place of birth for the foreign-born population - Saudi Arabia (%)
Place of birth for the foreign-born population - Syria (%)
Place of birth for the foreign-born population - Turkey (%)
Place of birth for the foreign-born population - Yemen (%)
Place of birth for the foreign-born population - Other Western Asia (%)
Place of birth for the foreign-born population - Eritrea (%)
Place of birth for the foreign-born population - Ethiopia (%)
Place of birth for the foreign-born population - Kenya (%)
Place of birth for the foreign-born population - Somalia (%)
Place of birth for the foreign-born population - Uganda (%)
Place of birth for the foreign-born population - Zimbabwe (%)
Place of birth for the foreign-born population - Other Eastern Africa (%)
Place of birth for the foreign-born population - Cameroon (%)
Place of birth for the foreign-born population - Congo (%)
Place of birth for the foreign-born population - Democratic Republic of Congo (Zaire) (%)
Place of birth for the foreign-born population - Other Middle Africa (%)
Place of birth for the foreign-born population - Egypt (%)
Place of birth for the foreign-born population - Morocco (%)
Place of birth for the foreign-born population - Sudan (%)
Place of birth for the foreign-born population - Other Northern Africa (%)
Place of birth for the foreign-born population - South Africa (%)
Place of birth for the foreign-born population - Other Southern Africa (%)
Place of birth for the foreign-born population - Cabo Verde (%)
Place of birth for the foreign-born population - Ghana (%)
Place of birth for the foreign-born population - Liberia (%)
Place of birth for the foreign-born population - Nigeria (%)
Place of birth for the foreign-born population - Senegal (%)
Place of birth for the foreign-born population - Sierra Leone (%)
Place of birth for the foreign-born population - Other Western Africa (%)
Place of birth for the foreign-born population - Australia (%)
Place of birth for the foreign-born population - New Zealand (%)
Place of birth for the foreign-born population - Fiji (%)
Place of birth for the foreign-born population - Micronesia (%)
Place of birth for the foreign-born population - Bahamas (%)
Place of birth for the foreign-born population - Barbados (%)
Place of birth for the foreign-born population - Cuba (%)
Place of birth for the foreign-born population - Dominica (%)
Place of birth for the foreign-born population - Dominican Republic (%)
Place of birth for the foreign-born population - Grenada (%)
Place of birth for the foreign-born population - Haiti (%)
Place of birth for the foreign-born population - Jamaica (%)
Place of birth for the foreign-born population - St. Vincent and the Grenadines (%)
Place of birth for the foreign-born population - Trinidad and Tobago (%)
Place of birth for the foreign-born population - West Indies (%)
Place of birth for the foreign-born population - Other Caribbean (%)
Place of birth for the foreign-born population - Belize (%)
Place of birth for the foreign-born population - Costa Rica (%)
Place of birth for the foreign-born population - El Salvador (%)
Place of birth for the foreign-born population - Guatemala (%)
Place of birth for the foreign-born population - Honduras (%)
Place of birth for the foreign-born population - Mexico (%)
Place of birth for the foreign-born population - Nicaragua (%)
Place of birth for the foreign-born population - Panama (%)
Place of birth for the foreign-born population - Other Central America (%)
Place of birth for the foreign-born population - Argentina (%)
Place of birth for the foreign-born population - Bolivia (%)
Place of birth for the foreign-born population - Brazil (%)
Place of birth for the foreign-born population - Chile (%)
Place of birth for the foreign-born population - Colombia (%)
Place of birth for the foreign-born population - Ecuador (%)
Place of birth for the foreign-born population - Guyana (%)
Place of birth for the foreign-born population - Peru (%)
Place of birth for the foreign-born population - Uruguay (%)
Place of birth for the foreign-born population - Venezuela (%)
Place of birth for the foreign-born population - Other South America (%)
Place of birth for the foreign-born population - Canada (%)
Place of birth for the foreign-born population - Other Northern America (%)
Place of birth for the foreign-born population - Other (%)
Latest news about races in Zanesville, OH collected exclusively by city-data.com from local newspapers, TV, and radio stations
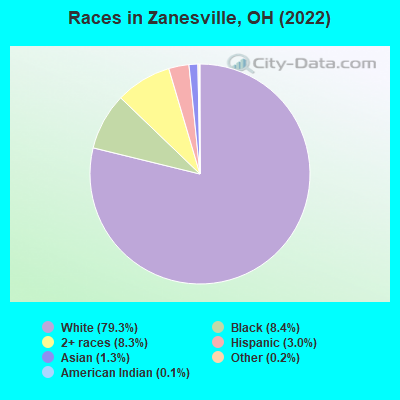
According to 2022 data, the most numerous races in Zanesville, OH are White alone (19,609 residents), Black alone (2,084 residents), and Two or more races (2,043 residents). 96.7% of Zanesville residents speak English at home. 1.3% of Zanesville, OH residents are foreign-born , which is 214.5% less than the foreign-born rate of 4.0% across the entire state of Ohio.
Race distribution in Zanesville
2000 2022
9,538,111 84.0% White alone 1,290,662 11.4% Black alone 217,123 1.9% Hispanic 137,770 1.2% Two or more races 131,670 1.2% Asian alone 21,985 0.2% American Indian alone 13,483 0.1% Other race alone 2,336 0.02% Native Hawaiian and Other
8,948,793 76.1% White alone 1,401,403 11.9% Black alone 529,291 4.5% Two or more races 517,232 4.4% Hispanic 293,387 2.5% Asian alone 52,805 0.4% Other race alone 9,785 0.08% American Indian alone 3,362 0.03% Native Hawaiian and Other
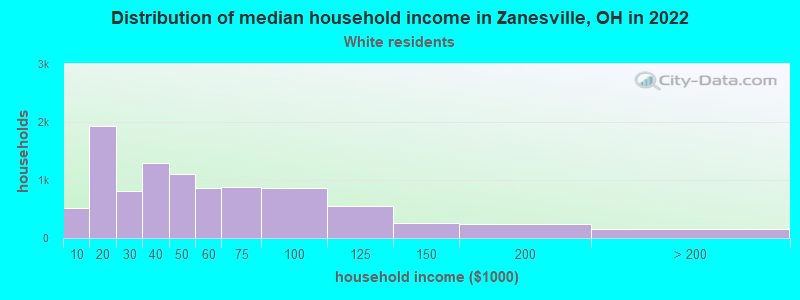
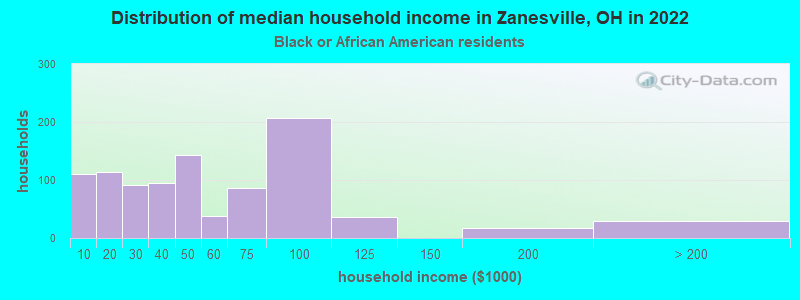
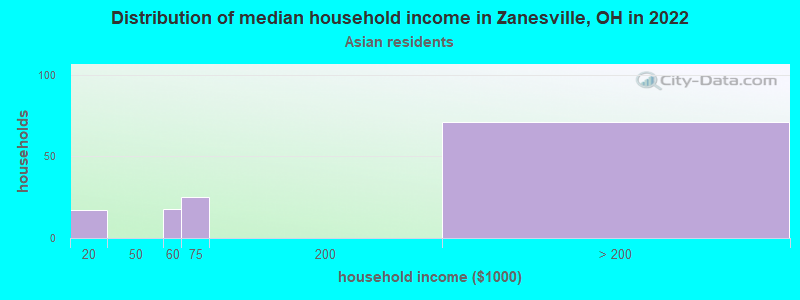
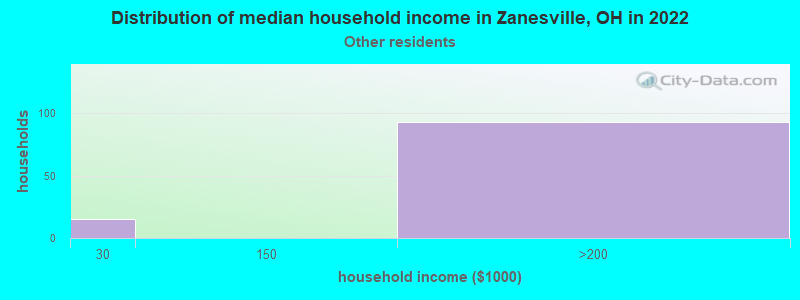
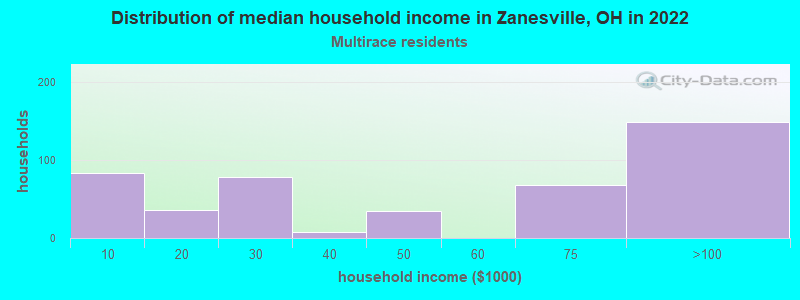
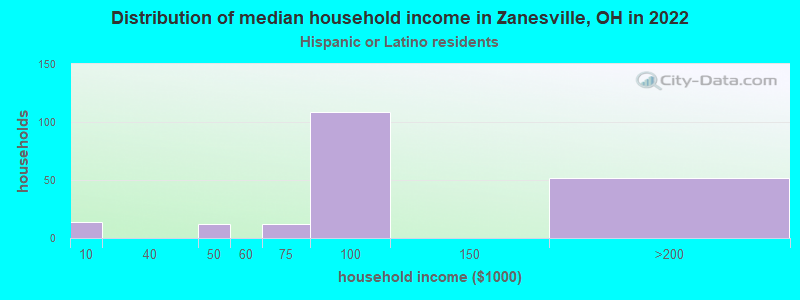
Income and house value in Zanesville Median household income in 2022 $41,049 White non-Hispanic householders$45,646 Black householdersover $200,000 Asian householders$80,033 Hispanic or Latino race householdersMedian 2022 house value $113,598 White Non-Hispanic householders$94,082 Black or African American householders$111,757 American Indian or Alaska Native householders $179,511 Asian householders$69,042 Some other race householders$48,790 Two or more races householders$140,479 Hispanic or Latino householders
Median age by race in Zanesville
39.8 Median age for White residents36.3 42.2 29.8 Median age for Black or African American residents49.8 24.3 45.6 Median age for American Indian / Alaska Native residents-685,185,184.5 -666,666,666.0 46.0 Median age for Asian residents47.5 37.2 -666,666,666.0 Median age for Native Hawaiian / Pacific Islander residents-666,666,666.0 -666,666,666.0 57.6 Median age for Other race residents26.3 25.2 16.7 Median age for Two or more races residents23.7 15.1 40.0 Median age for White alone residents36.4 42.4 17.7 Median age for Hispanic or Latino residents27.9 16.4
Owner/renter occupied households by race in Zanesville
House owners and renters - White residents 3,876 39.5% Owner occupied5,938 60.5% Renter occupiedHouse owners and renters - Black or African American residents 434 27.1% Owner occupied1,166 72.9% Renter occupiedHouse owners and renters - American Indian / Alaska Native residents 11 100.0% Renter occupiedHouse owners and renters - Asian residents 19 15.4% Owner occupied102 84.6% Renter occupiedHouse owners and renters - Other race residents 25 30.9% Owner occupied56 69.1% Renter occupiedHouse owners and renters - Two or more races residents 180 74.0% Owner occupied63 26.0% Renter occupiedHouse owners and renters - White alone residents 3,876 39.5% Owner occupied5,938 60.5% Renter occupiedHouse owners and renters - Hispanic or Latino residents 128 63.4% Owner occupied74 36.6% Renter occupied
Language usage in Zanesville
English speakers - Total 96.7% of residents of Zanesville speak English at home.
1.5% of residents speak Spanish at home 122 34.9% Speak English very well228 65.1% Speak English less than very well1.6% of residents speak other language at home 227 61.2% Speak English very well144 38.8% Speak English less than very well
English speakers - Born in the United States 93.5% of residents of Zanesville speak English at home.
7.2% of residents speak Spanish at home 233 100.0% Speak English less than very well
English speakers - Native, born elsewhere 85.4% of residents of Zanesville speak English at home.
14.6% of residents speak Spanish at home 18 100.0% Speak English very well
English speakers - Foreign-born 26.1% of residents of Zanesville speak English at home.
72.3% of residents speak other language at home 95 41.9% Speak English very well132 58.1% Speak English less than very well
White (Caucasian) - Speak only English Native:
99.1% (18,335)Foreign-born:
15.4% (8)
White (Caucasian) - Speak another language Native:
1.0% (194)Foreign-born:
82.1% (45)
Black or African American - Speak only English Native:
99.8% (2,008)Foreign-born:
100.0% (11)
Asian - Speak only English Native:
100.0% (82)Foreign-born:
24.9% (60)
White alone - Speak only English Native:
98.8% (18,288)Foreign-born:
14.3% (9)
White alone - Speak another language Native:
1.2% (216)Foreign-born:
85.2% (51)
Foreign-born residents in Zanesville 314 residents are foreign born
Marital status for residents in Zanesville Marital status - White (Caucasian) population 15 years and over
Males 39.8% Never married38.2% Now married3.2% Separated3.2% Widowed15.5% DivorcedFemales 34.2% Never married29.3% Now married4.3% Separated13.0% Widowed19.2% DivorcedWomen who gave birth in the past 12 months Now married:
44.4% (118)Unmarried:
55.6% (148)
Women who did not give birth in the past 12 months Now married:
31.6% (1,428)Unmarried:
68.4% (3,095)
Marital status - Black or African American population 15 years and over
Males 44.3% Never married20.4% Now married11.4% Separated1.8% Widowed22.0% DivorcedFemales 44.0% Never married11.6% Now married9.1% Separated8.4% Widowed26.9% DivorcedWomen who did not give birth in the past 12 months Now married:
14.7% (50)Unmarried:
85.3% (288)
Marital status - American Indian / Alaska Native population 15 years and over
Males 0.0% Never married100.0% Now married0.0% Separated0.0% Widowed0.0% DivorcedFemales 52.9% Never married0.0% Now married0.0% Separated0.0% Widowed47.1% DivorcedWomen who did not give birth in the past 12 months Now married:
0.0% (0)Unmarried:
100.0% (11)
Marital status - Asian population 15 years and over
Males 0.0% Never married100.0% Now married0.0% Separated0.0% Widowed0.0% DivorcedFemales 41.7% Never married58.3% Now married0.0% Separated0.0% Widowed0.0% DivorcedWomen who did not give birth in the past 12 months Now married:
58.6% (95)Unmarried:
41.4% (67)
Marital status - Other race population 15 years and over
Males 100.0% Never married0.0% Now married0.0% Separated0.0% Widowed0.0% DivorcedFemales 75.6% Never married0.0% Now married0.0% Separated0.0% Widowed24.4% DivorcedWomen who did not give birth in the past 12 months Now married:
0.0% (0)Unmarried:
100.0% (78)
Marital status - Two or more races population 15 years and over
Males 85.8% Never married10.1% Now married1.8% Separated2.0% Widowed0.4% DivorcedFemales 59.4% Never married27.1% Now married0.0% Separated1.1% Widowed12.5% DivorcedWomen who gave birth in the past 12 months Now married:
0.0% (0)Unmarried:
100.0% (29)
Women who did not give birth in the past 12 months Now married:
19.7% (108)Unmarried:
80.3% (442)
Marital status - White alone, not Hispanic / Latino population 15 years and over
Males 39.8% Never married38.2% Now married3.2% Separated3.2% Widowed15.5% DivorcedFemales 34.2% Never married29.3% Now married4.3% Separated13.0% Widowed19.2% DivorcedWomen who gave birth in the past 12 months Now married:
44.4% (118)Unmarried:
55.6% (148)
Women who did not give birth in the past 12 months Now married:
31.6% (1,428)Unmarried:
68.4% (3,095)
Marital status - Hispanic or Latino population 15 years and over
Males 92.7% Never married6.6% Now married0.0% Separated0.0% Widowed0.7% DivorcedFemales 59.9% Never married40.1% Now married0.0% Separated0.0% Widowed0.0% DivorcedWomen who did not give birth in the past 12 months Now married:
26.7% (34)Unmarried:
73.3% (93)
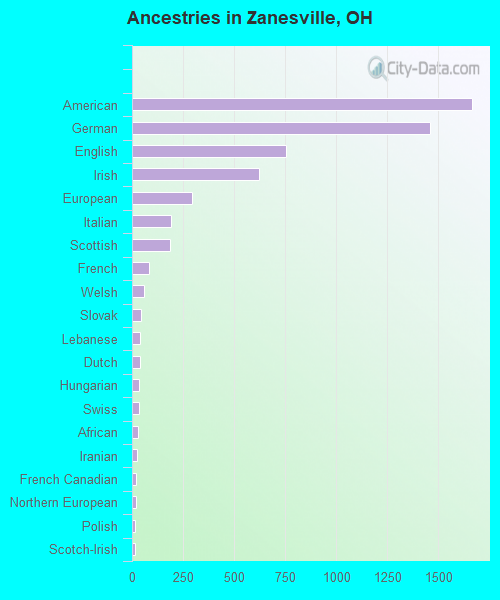
Ancestries in Zanesville
1,666 17.3% American1,461 15.2% German753 7.8% English623 6.5% Irish292 3.0% European192 2.0% Italian184 1.9% Scottish84 0.9% French60 0.6% Welsh43 0.4% Slovak40 0.4% Lebanese37 0.4% Dutch33 0.3% Hungarian32 0.3% Swiss28 0.3% African24 0.2% Iranian21 0.2% French Canadian19 0.2% Northern European16 0.2% Polish16 0.2% Scotch-Irish15 0.2% Croatian13 0.1% Danish9 0.09% Norwegian8 0.08% Czechoslovakian7 0.07% Scandinavian5 0.05% Moroccan
Geographical mobility in Zanesville Same house 1 year ago 15,655 79.5% White (Caucasian)2,722 91.6% Black or African American17 51.2% American Indian / Alaska Native257 79.4% Asian126 40.6% Other race1,957 78.5% Two or more races15,645 79.8% White alone, not Hispanic / Latino457 61.2% Hispanic or LatinoMoved within same county 2,846 14.4% White / Caucasian275 9.3% Black or African American10 29.9% American Indian / Alaska Native175 7.0% Two or more races2,784 14.2% White alone, not Hispanic / Latino94 12.5% Hispanic or LatinoMoved within same state 1,152 5.8% White / Caucasian91 3.1% Black or African American295 11.8% Two or more races1,152 5.9% White alone, not Hispanic / Latino24 3.2% Hispanic or LatinoMoved from different state 169 0.9% White / Caucasian43 13.2% Asian188 60.7% Other race9 0.4% Two or more races169 0.9% White alone, not Hispanic / Latino155 20.7% Hispanic or LatinoMoved from abroad 11 0.1% White13 0.1% White alone, not Hispanic / Latino
Children Nativity (place of birth) in Zanesville
Children under 6 years - Living with two parents Both parents native 435 100.0% NativeChildren under 6 years - Living with one parent Native parent 1,265 100.0% NativeChildren 6 to 17 years - Living with two parents Both parents native 930 100.0% NativeBoth parents foreign-born 52 100.0% NativeOne native, one foreign-born parent 17 100.0% NativeChildren 6 to 17 years - Living with one parent Native parent 2,150 100.0% NativeForeign-born parent 21 50.4% Native21 49.6% Foreign-born
Grandparents responsible for own grandchildren in Zanesville
Grandparents (30 to 59 years) White / Caucasian 51 37.8% Responsible for grandchildren85 62.2% Not responsible for grandchildrenBlack or African American 22 75.2% Responsible for grandchildren7 24.8% Not responsible for grandchildrenTwo or more races 13 100.0% Responsible for grandchildrenWhite alone, not Hispanic / Latino 51 37.3% Responsible for grandchildren86 62.7% Not responsible for grandchildrenGrandparents (60 years and over) White / Caucasian 24 13.5% Responsible for grandchildren157 86.5% Not responsible for grandchildrenBlack or African American 14 33.6% Responsible for grandchildren28 66.4% Not responsible for grandchildrenWhite alone, not Hispanic / Latino 24 13.4% Responsible for grandchildren158 86.6% Not responsible for grandchildren