Estimated zip code population in 2022: 1,412 Zip code population in 2010: 1,478 Zip code population in 2000: 1,458
Houses and condos: 731 Renter-occupied apartments: 68
% of renters here:
11%
State:
38%
March 2022 cost of living index in zip code 01072: 88.3 (less than average, U.S. average is 100)
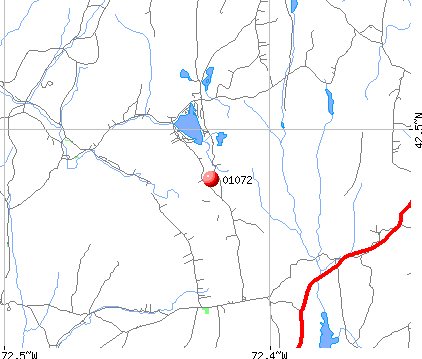
Land area: 20.1 sq. mi. Water area: 0.5 sq. mi.
Population density: 70 people per square mile
(very low).
OSM Map
Google Map
MSN Map
OSM Map
General Map
Google Map
MSN Map
OSM Map
Google Map
MSN Map
OSM Map
Google Map
MSN Map
Please wait while loading the map...
Real estate property taxes paid for housing units in 2022:
This zip code:
1.7% ($5,922)
Massachusetts:
1.0% ($5,536)
Median real estate property taxes paid for housing units with mortgages in 2022: $5,960 (1.7%) Median real estate property taxes paid for housing units with no mortgage in 2022: $5,845 (1.8%)
Business Search- 14 Million verified businesses
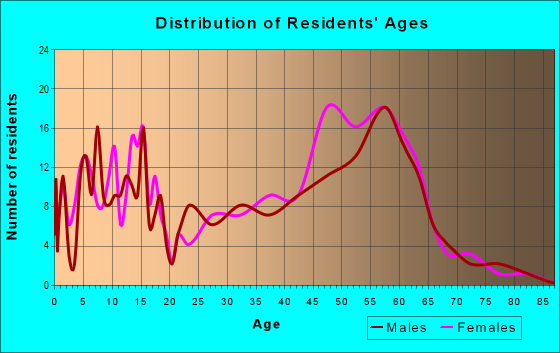
Males: 637
(45.1%)
Females: 775
(54.9%)
For population 25 years and over in 01072:
High school or higher: 100.0%
Bachelor's degree or higher: 69.1%
Graduate or professional degree: 37.2%
Unemployed: 6.3%
Mean travel time to work (commute): 31.8 minutes
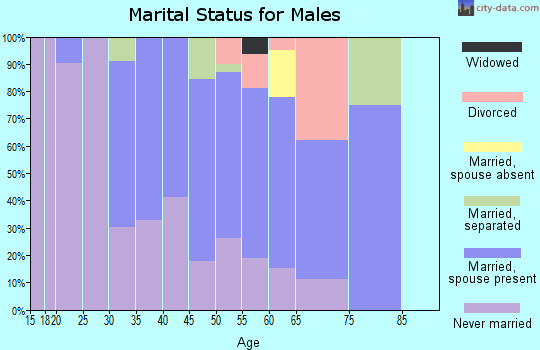
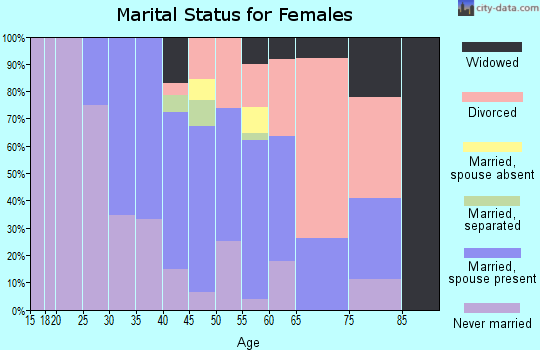
For population 15 years and over in 01072:
Never married: 31.2%
Now married: 47.7%
Separated: 1.0%
Widowed: 6.3%
Divorced: 13.8%
Zip code 01072 compared to state average:
Median house value below state average.
Black race population percentage significantly below state average.
Median age significantly above state average.
Foreign-born population percentage significantly below state average.
Renting percentage significantly below state average.
Length of stay since moving in significantly above state average.
House age below state average.
Percentage of population with a bachelor's degree or higher above state average.
Estimated median house/condo value in 2022: $345,638
01072:
$345,638
Massachusetts:
$534,700
Median resident age:
This zip code:
54.2 years
Massachusetts median age:
40.3 years
Average household size:
This zip code:
2.3 people
Massachusetts:
2.4 people
Averages for the 2020 tax year for zip code 01072, filed in 2021:
Average Adjusted Gross Income (AGI) in 2020: $80,099 (Individual Income Tax Returns)
Here:
$80,099
State:
$105,130
Salary/wage: $60,105 (reported on 78.8% of returns)
Here:
$60,105
State:
$82,951
(% of AGI for various income ranges: 1132.5% for AGIs below $25k, 3526.0% for AGIs $25k-50k, 7231.2% for AGIs $50k-75k, 9391.7% for AGIs $75k-100k, 16412.2% for AGIs $100k-200k)
Taxable interest for individuals: $1,457 (reported on 46.2% of returns)
This zip code:
$1,457
Massachusetts:
$2,361
(% of AGI for various income ranges: 20.0% for AGIs below $25k, 18.0% for AGIs $25k-50k, 41.2% for AGIs $50k-75k, 86.7% for AGIs $75k-100k, 330.0% for AGIs $100k-200k)
Ordinary dividends: $8,220 (reported on 31.2% of returns)
Here:
$8,220
State:
$10,365
(% of AGI for various income ranges: 55.8% for AGIs below $25k, 161.0% for AGIs $25k-50k, 218.8% for AGIs $50k-75k, 346.7% for AGIs $75k-100k, 496.7% for AGIs $100k-200k)
Net capital gain/loss in AGI: +$21,904 (reported on 31.2% of returns)
Here:
+$21,904
State:
+$48,178
(% of AGI for various income ranges: 57.5% for AGIs below $25k, 49.0% for AGIs $25k-50k, 182.5% for AGIs $50k-75k, 133.3% for AGIs $75k-100k, 1306.7% for AGIs $100k-200k)
Profit/loss from business: +$11,757 (reported on 28.7% of returns)
Here:
+$11,757
State:
+$20,792
(% of AGI for various income ranges: 195.8% for AGIs below $25k, 328.0% for AGIs $25k-50k, 552.5% for AGIs $50k-75k, 1056.7% for AGIs $75k-100k, 1183.3% for AGIs $100k-200k)
Taxable individual retirement arrangement distribution: $13,960 (reported on 12.5% of returns)
01072:
$13,960
Massachusetts:
$22,790
(% of AGI for various income ranges: 190.0% for AGIs below $25k, 346.2% for AGIs $50k-75k, 990.0% for AGIs $100k-200k)
Total itemized deductions: $25,000 (reported on 8.8% of returns)
Here:
$25,000
State:
$36,722
(% of AGI for various income ranges: 916.2% for AGIs $50k-75k, 1130.0% for AGIs $100k-200k)
Charity contributions: $5,760 (reported on 6.2% of returns)
Here:
$5,760
State:
$12,529
(% of AGI for various income ranges: 28.3% for AGIs below $25k, 282.2% for AGIs $100k-200k)
Taxes paid: $8,557 (reported on 8.8% of returns)
01072:
$8,557
State:
$8,782
(% of AGI for various income ranges: 350.0% for AGIs $50k-75k, 354.4% for AGIs $100k-200k)
Earned income credit: $1,543 (reported on 8.8% of returns)
Here:
$1,543
State:
$1,909
(% of AGI for various income ranges: 59.2% for AGIs below $25k, 37.0% for AGIs $25k-50k)
Percentage of individuals using paid preparers for their 2020 taxes: 91.2%
Here:
91%
State:
92%
(% for various income ranges: 90.0% for AGIs below $25k, 93.3% for AGIs $25k-50k, 92.3% for AGIs $50k-75k, 81.8% for AGIs $75k-100k, 93.8% for AGIs $100k-200k, 100.0% for AGIs over 200k)
Averages for the 2012 tax year for zip code 01072, filed in 2013:
Average Adjusted Gross Income (AGI) in 2012: $55,361 (Individual Income Tax Returns)
Here:
$55,361
State:
$81,425
Salary/wage: $49,159 (reported on 83.1% of returns)
Here:
$49,159
State:
$64,752
(% of AGI for various income ranges: 62.4% for AGIs below $25k, 76.2% for AGIs $25k-50k, 69.0% for AGIs $50k-75k, 76.0% for AGIs $75k-100k, 76.2% for AGIs $100k-200k)
Taxable interest for individuals: $671 (reported on 49.4% of returns)
This zip code:
$671
Massachusetts:
$2,136
(% of AGI for various income ranges: 0.4% for AGIs below $25k, 0.9% for AGIs $25k-50k, 1.0% for AGIs $50k-75k, 0.3% for AGIs $75k-100k, 0.5% for AGIs $100k-200k)
Ordinary dividends: $4,905 (reported on 27.3% of returns)
Here:
$4,905
State:
$9,473
(% of AGI for various income ranges: 2.2% for AGIs below $25k, 2.0% for AGIs $25k-50k, 1.6% for AGIs $50k-75k, 2.2% for AGIs $75k-100k, 3.0% for AGIs $100k-200k)
Net capital gain/loss in AGI: +$2,465 (reported on 22.1% of returns)
Here:
+$2,465
State:
+$31,437
(% of AGI for various income ranges: 2.4% for AGIs $100k-200k)
Profit/loss from business: +$13,136 (reported on 28.6% of returns)
Here:
+$13,136
State:
+$20,662
(% of AGI for various income ranges: 18.4% for AGIs below $25k, 7.6% for AGIs $25k-50k, 7.7% for AGIs $50k-75k, 6.0% for AGIs $75k-100k, 4.5% for AGIs $100k-200k)
Taxable individual retirement arrangement distribution: $9,529 (reported on 9.1% of returns)
01072:
$9,529
Massachusetts:
$18,892
Total itemized deductions: $18,983 (21% of AGI, reported on 45.5% of returns)
Here:
$18,983
State:
$28,907
Here:
21.2% of AGI
State:
18.2% of AGI
(% of AGI for various income ranges: 12.3% for AGIs below $25k, 14.3% for AGIs $25k-50k, 15.7% for AGIs $50k-75k, 17.9% for AGIs $75k-100k, 15.6% for AGIs $100k-200k)
Charity contributions: $1,728 (reported on 37.7% of returns)
Here:
$1,728
State:
$4,208
(% of AGI for various income ranges: 1.0% for AGIs $25k-50k, 0.9% for AGIs $50k-75k, 1.0% for AGIs $75k-100k, 1.6% for AGIs $100k-200k)
Taxes paid: $9,611 (reported on 45.5% of returns)
01072:
$9,611
State:
$13,303
(% of AGI for various income ranges: 4.8% for AGIs below $25k, 6.3% for AGIs $25k-50k, 7.2% for AGIs $50k-75k, 8.9% for AGIs $75k-100k, 8.8% for AGIs $100k-200k)
Earned income credit: $1,770 (reported on 13.0% of returns)
Here:
$1,770
State:
$1,971
(% of AGI for various income ranges: 4.2% for AGIs below $25k, 0.7% for AGIs $25k-50k)
Percentage of individuals using paid preparers for their 2012 taxes: 49.4%
Here:
49%
State:
56%
(% for various income ranges: 42.3% for AGIs below $25k, 50.0% for AGIs $25k-50k, 61.5% for AGIs $50k-75k, 44.4% for AGIs $75k-100k, 53.8% for AGIs $100k-200k)
Averages for the 2004 tax year for zip code 01072, filed in 2005:
Average Adjusted Gross Income (AGI) in 2004: $49,040 (Individual Income Tax Returns)
Here:
$49,040
State:
$62,877
Salary/wage: $43,252 (reported on 84.3% of returns)
Here:
$43,252
State:
$52,969
(% of AGI for various income ranges: 97.4% for AGIs below $10k, 71.1% for AGIs $10k-25k, 79.0% for AGIs $25k-50k, 69.2% for AGIs $50k-75k, 87.2% for AGIs $75k-100k, 65.9% for AGIs over 100k)
Taxable interest for individuals: $645 (reported on 59.4% of returns)
This zip code:
$645
Massachusetts:
$1,945
(% of AGI for various income ranges: 2.8% for AGIs below $10k, 1.0% for AGIs $10k-25k, 1.1% for AGIs $25k-50k, 0.8% for AGIs $50k-75k, 0.4% for AGIs $75k-100k, 0.7% for AGIs over 100k)
Taxable dividends: $2,712 (reported on 29.6% of returns)
Here:
$2,712
State:
$5,323
(% of AGI for various income ranges: 11.3% for AGIs below $10k, 1.8% for AGIs $10k-25k, 1.5% for AGIs $25k-50k, 1.4% for AGIs $50k-75k, 0.5% for AGIs $75k-100k, 2.1% for AGIs over 100k)
Net capital gain/loss: +$8,327 (reported on 23.6% of returns)
Here:
+$8,327
State:
+$20,377
(% of AGI for various income ranges: 4.2% for AGIs below $10k, 0.6% for AGIs $10k-25k, 0.1% for AGIs $25k-50k, 1.2% for AGIs $50k-75k, 0.1% for AGIs $75k-100k, 10.7% for AGIs over 100k)
Profit/loss from business: +$12,966 (reported on 28.4% of returns)
Here:
+$12,966
State:
+$17,837
(% of AGI for various income ranges: 7.1% for AGIs below $10k, 14.6% for AGIs $10k-25k, 11.6% for AGIs $25k-50k, 11.9% for AGIs $50k-75k, 7.1% for AGIs $75k-100k, 2.0% for AGIs over 100k)
IRA payment deduction: $2,897 (reported on 5.4% of returns)
01072:
$2,897
Massachusetts:
$3,100
Self-employed pension: $4,133 (reported on 2.1% of returns)
Here:
$4,133
Massachusetts:
$14,516
Total itemized deductions: $16,571 (21% of AGI, reported on 45.6% of returns)
Here:
$16,571
State:
$22,573
Here:
20.9% of AGI
State:
19.5% of AGI
(% of AGI for various income ranges: 9.8% for AGIs $10k-25k, 18.1% for AGIs $25k-50k, 18.4% for AGIs $50k-75k, 17.3% for AGIs $75k-100k, 12.9% for AGIs over 100k)
Charity contributions deductions: $1,809 (2% of AGI, reported on 41.2% of returns)
Here:
$1,809
State:
$3,295
Here:
2.3% of AGI
State:
2.7% of AGI
(% of AGI for various income ranges: 1.2% for AGIs $10k-25k, 1.6% for AGIs $25k-50k, 1.9% for AGIs $50k-75k, 1.5% for AGIs $75k-100k, 1.4% for AGIs over 100k)
Total tax: $6,714 (reported on 82.4% of returns)
01072:
$6,714
State:
$11,494
(% of AGI for various income ranges: 4.4% for AGIs below $10k, 6.6% for AGIs $10k-25k, 7.6% for AGIs $25k-50k, 9.7% for AGIs $50k-75k, 10.3% for AGIs $75k-100k, 15.8% for AGIs over 100k)
Earned income credit: $1,121 (reported on 9.1% of returns)
Here:
$1,121
State:
$1,518
Percentage of individuals using paid preparers for their 2004 taxes: 46.4%
Here:
46%
State:
58%
(% for various income ranges: 34.5% for AGIs below $10k, 42.2% for AGIs $10k-25k, 51.6% for AGIs $25k-50k, 54.0% for AGIs $50k-75k, 47.2% for AGIs $75k-100k, 53.2% for AGIs over 100k)
Likely homosexual households (counted as self-reported same-sex unmarried-partner households)
Lesbian couples: 0.6% of all households
Gay men: 0.7% of all households
Household received Food Stamps/SNAP in the past 12 months: 62 Household did not receive Food Stamps/SNAP in the past 12 months: 558
Women who had a birth in the past 12 months: 3 (4 now married, 0 unmarried) Women who did not have a birth in the past 12 months: 275 (90 now married, 184 unmarried)
Housing units in zip code 01072 with a mortgage: 355 (72 second mortgage, 4 home equity loan, 59 both second mortgage and home equity loan) Houses without a mortgage: 7
Median monthly owner costs for units with a mortgage: $1,891 Median monthly owner costs for units without a mortgage: $775
Residents with income below the poverty level in 2022:
This zip code:
4.5%
Whole state:
10.4%
Residents with income below 50% of the poverty level in 2022:
This zip code:
1.9%
Whole state:
5.1%
Median number of rooms in houses and condos:
Here:
6.0
State:
6.5
Median number of rooms in apartments:
Here:
5.6
State:
4.0
Notable locations in this zip code not listed on our city pages
84 married couples with children.
66 single-parent households (19 men, 47 women).
91.4% of residents of 01072 zip code speak English at home.
7.5% of residents speak Spanish at home (98% very well, 2% well).
0.7% of residents speak other Indo-European language at home (90% very well, 10% not well).
0.2% of residents speak other language at home (100% very well).
Foreign born population: 80 (5.7%) (82.3% of them are naturalized citizens)
This zip code:
5.7%
Whole state:
18.0%
14%Italy
12%United Kingdom, excluding England and Scotland
12%Brazil
11%Sweden
9%Barbados
8%Democratic Republic of Congo (Zaire)
5%Guyana
13%English
12%Irish
9%Italian
8%European
7%Eastern European
7%Polish
4%Finnish
Year of entry for the foreign-born population
32010 or later
82000 to 2009
91990 to 1999
90Before 1990
42.5%Fuel oil, kerosene, etc.
23.6%Bottled, tank, or LP gas
20.8%Wood
10.5%Electricity
2.1%Utility gas
1.0%Other fuel
Population in 1990: 1,533.
Place of birth for U.S.-born residents:
This state: 772
Northeast: 329
Midwest: 89
South: 78
West: 25
61% of the 01072 zip code residents lived in the same house 5 years ago. Out of people who lived in different houses, 37% lived in this county. Out of people who lived in different counties, 50% lived in Massachusetts.
93% of the 01072 zip code residents lived in the same house 1 year ago. Out of people who lived in different houses, 45% moved from different county within same state. Out of people who lived in different houses, 65% moved from different state.
Private vs. public school enrollment:
Students in private schools in grades 1 to 8 (elementary and middle school): 19
Here:
21.5%
Massachusetts:
10.3%
Students in private schools in grades 9 to 12 (high school): 5
Here:
11.1%
Massachusetts:
12.3%
Students in private undergraduate colleges: 10
Here:
17.1%
Massachusetts:
51.2%
Occupation by median earnings in the past 12 months ($)
89,423Legal occupations
80,089Management occupations
79,737Healthcare support occupations
78,748Construction and extraction occupations
69,690Community and social service occupations
67,847Sales and related occupations
Top industries in this zip code by the number of employees in 2005:
Construction: New Single-Family Housing Construction (except Operative Builders) (10-19 employees: 1 establishment)
Arts, Entertainment, and Recreation: Fitness and Recreational Sports Centers (5-9: 1)
Educational Services: Educational Support Services (5-9: 1)
Construction: Site Preparation Contractors (1-4: 2)
Professional, Scientific, and Technical Services: Research and Development in the Physical, Engineering, and Life Sciences (1-4: 1)
Professional, Scientific, and Technical Services: Engineering Services (1-4: 1)
Construction: All Other Specialty Trade Contractors (1-4: 1)
Other Services (except Public Administration): Religious Organizations (1-4: 1)
Accommodation and Food Services: Recreational and Vacation Camps (except Campgrounds) (1-4: 1)
Professional, Scientific, and Technical Services: Research and Development in the Social Sciences and Humanities (1-4: 1)
Home Mortgage Disclosure Act Aggregated Statistics For Year 2009 (Based on 2 partial tracts)
A) FHA, FSA/RHS & VA Home Purchase Loans
B) Conventional Home Purchase Loans
C) Refinancings
D) Home Improvement Loans
F) Non-occupant Loans on < 5 Family Dwellings (A B C & D)
Number
Average Value
Number
Average Value
Number
Average Value
Number
Average Value
Number
Average Value
LOANS ORIGINATED
3
$203,860
8
$198,871
59
$186,545
10
$87,247
4
$168,448
APPLICATIONS APPROVED, NOT ACCEPTED
0
$0
1
$146,190
2
$188,760
0
$0
0
$0
APPLICATIONS DENIED
0
$0
2
$328,730
14
$220,283
2
$52,490
3
$238,593
APPLICATIONS WITHDRAWN
1
$142,300
2
$189,150
9
$225,807
1
$52,490
0
$0
FILES CLOSED FOR INCOMPLETENESS
0
$0
1
$153,580
5
$243,466
0
$0
0
$0
Aggregated Statistics For Year 2008 (Based on 2 partial tracts)
A) FHA, FSA/RHS & VA Home Purchase Loans
B) Conventional Home Purchase Loans
C) Refinancings
D) Home Improvement Loans
F) Non-occupant Loans on < 5 Family Dwellings (A B C & D)
Number
Average Value
Number
Average Value
Number
Average Value
Number
Average Value
Number
Average Value
LOANS ORIGINATED
1
$182,740
11
$227,907
20
$182,542
8
$62,791
2
$267,885
APPLICATIONS APPROVED, NOT ACCEPTED
0
$0
1
$294,710
1
$144,630
1
$56,760
0
$0
APPLICATIONS DENIED
0
$0
1
$232,110
9
$207,187
2
$110,030
0
$0
APPLICATIONS WITHDRAWN
1
$69,600
2
$113,140
5
$186,624
0
$0
0
$0
FILES CLOSED FOR INCOMPLETENESS
0
$0
0
$0
1
$191,290
0
$0
0
$0
Aggregated Statistics For Year 2007 (Based on 2 partial tracts)
A) FHA, FSA/RHS & VA Home Purchase Loans
B) Conventional Home Purchase Loans
C) Refinancings
D) Home Improvement Loans
F) Non-occupant Loans on < 5 Family Dwellings (A B C & D)
Number
Average Value
Number
Average Value
Number
Average Value
Number
Average Value
Number
Average Value
LOANS ORIGINATED
1
$160,570
22
$204,933
30
$164,372
14
$61,181
4
$156,298
APPLICATIONS APPROVED, NOT ACCEPTED
0
$0
2
$220,840
7
$173,849
2
$59,290
1
$227,840
APPLICATIONS DENIED
0
$0
6
$212,673
14
$205,286
2
$122,085
1
$110,810
APPLICATIONS WITHDRAWN
0
$0
4
$193,232
7
$207,730
1
$83,590
2
$202,565
FILES CLOSED FOR INCOMPLETENESS
0
$0
0
$0
2
$65,515
0
$0
0
$0
Aggregated Statistics For Year 2006 (Based on 2 partial tracts)
B) Conventional Home Purchase Loans
C) Refinancings
D) Home Improvement Loans
F) Non-occupant Loans on < 5 Family Dwellings (A B C & D)
Number
Average Value
Number
Average Value
Number
Average Value
Number
Average Value
LOANS ORIGINATED
26
$192,531
31
$157,652
14
$92,174
5
$187,712
APPLICATIONS APPROVED, NOT ACCEPTED
3
$321,407
4
$172,432
1
$59,490
0
$0
APPLICATIONS DENIED
2
$181,960
18
$178,740
5
$90,590
2
$178,460
APPLICATIONS WITHDRAWN
2
$165,045
14
$170,878
1
$116,640
2
$138,605
FILES CLOSED FOR INCOMPLETENESS
0
$0
2
$317,065
1
$38,880
0
$0
Aggregated Statistics For Year 2005 (Based on 2 partial tracts)
B) Conventional Home Purchase Loans
C) Refinancings
D) Home Improvement Loans
F) Non-occupant Loans on < 5 Family Dwellings (A B C & D)
G) Loans On Manufactured Home Dwelling (A B C & D)
Number
Average Value
Number
Average Value
Number
Average Value
Number
Average Value
Number
Average Value
LOANS ORIGINATED
28
$177,640
45
$161,032
10
$93,234
5
$158,864
1
$35,380
APPLICATIONS APPROVED, NOT ACCEPTED
3
$181,050
3
$191,680
0
$0
1
$131,410
0
$0
APPLICATIONS DENIED
2
$181,765
19
$163,132
4
$120,820
2
$96,035
0
$0
APPLICATIONS WITHDRAWN
2
$159,600
12
$171,785
1
$151,630
0
$0
0
$0
FILES CLOSED FOR INCOMPLETENESS
1
$218,890
5
$215,628
0
$0
0
$0
0
$0
Aggregated Statistics For Year 2004 (Based on 2 partial tracts)
A) FHA, FSA/RHS & VA Home Purchase Loans
B) Conventional Home Purchase Loans
C) Refinancings
D) Home Improvement Loans
F) Non-occupant Loans on < 5 Family Dwellings (A B C & D)
Detailed PMIC statistics for the following Tracts:0406.00
2002 - 2018 National Fire Incident Reporting System (NFIRS) incidents
Based on the data from the years 2002 - 2018 the average number of fire incidents per year is 7. The highest number of fire incidents - 20 took place in 2018, and the least - 2 in 2007. The data has a growing trend.
When looking into fire subcategories, the most reports belonged to: Structure Fires (71.6%), and Outside Fires (14.7%).
Fire incident types reported to NFIRS in Zip Code 01072


 Nearest zip codes: 01054, 01355, 01379, 01002, 01349, 01003.


 Based on the data from the years 2002 - 2018 the average number of fire incidents per year is 7. The highest number of fire incidents - 20 took place in 2018, and the least - 2 in 2007. The data has a growing trend.
 When looking into fire subcategories, the most reports belonged to: Structure Fires (71.6%), and Outside Fires (14.7%).