Estimated zip code population in 2022: 9,210 Zip code population in 2010: 8,500 Zip code population in 2000: 7,070
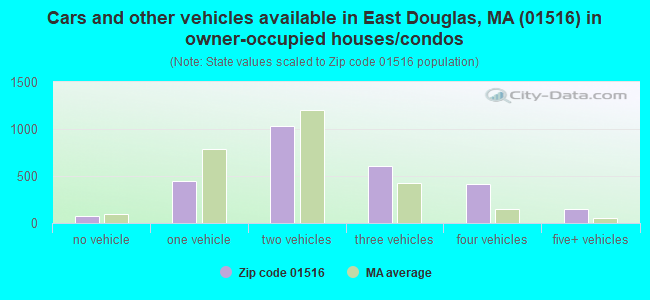
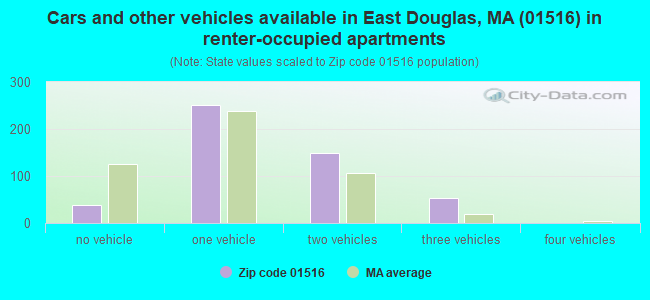
Houses and condos: 3,426 Renter-occupied apartments: 492
% of renters here:
15%
State:
38%
March 2022 cost of living index in zip code 01516: 111.0 (more than average, U.S. average is 100)
Land area: 36.8 sq. mi. Water area: 1.6 sq. mi.
Population density: 251 people per square mile
(very low).
OSM Map
Google Map
MSN Map
OSM Map
General Map
Google Map
MSN Map
OSM Map
Google Map
MSN Map
OSM Map
Google Map
MSN Map
Please wait while loading the map...
Real estate property taxes paid for housing units in 2022:
This zip code:
1.3% ($5,750)
Massachusetts:
1.0% ($5,536)
Median real estate property taxes paid for housing units with mortgages in 2022: $5,823 (1.3%) Median real estate property taxes paid for housing units with no mortgage in 2022: $5,522 (1.3%)
Business Search- 14 Million verified businesses
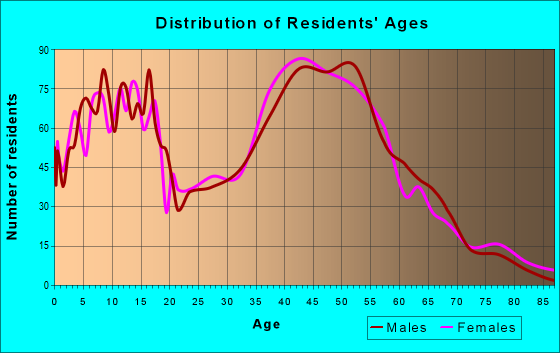
Males: 4,300
(46.7%)
Females: 4,909
(53.3%)
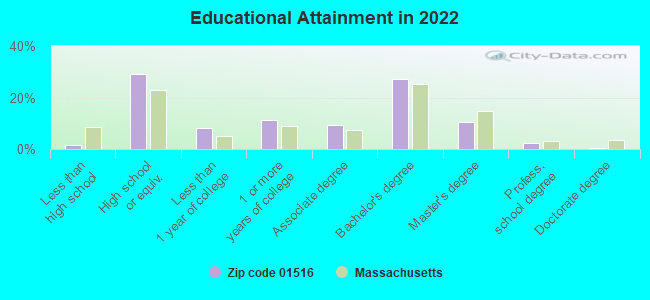
For population 25 years and over in 01516:
High school or higher: 98.0%
Bachelor's degree or higher: 40.7%
Graduate or professional degree: 13.4%
Unemployed: 4.6%
Mean travel time to work (commute): 32.7 minutes
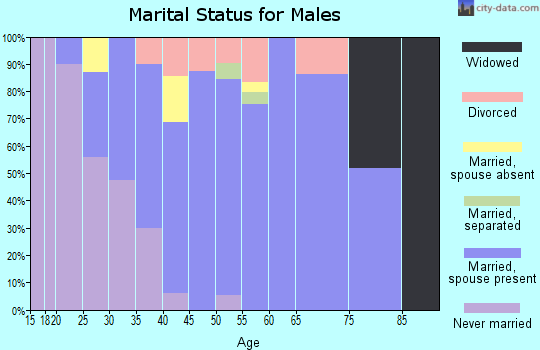
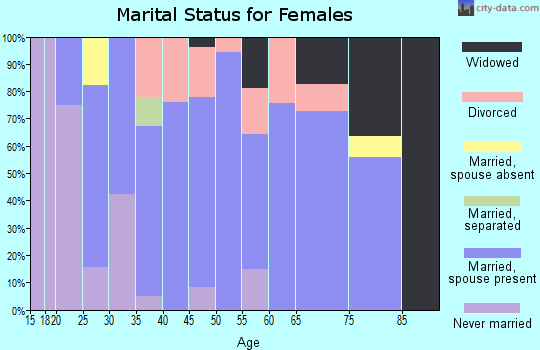
For population 15 years and over in 01516:
Never married: 29.1%
Now married: 59.9%
Separated: 0.2%
Widowed: 4.5%
Divorced: 6.4%
Zip code 01516 compared to state average:
Black race population percentage significantly below state average.
Hispanic race population percentage significantly below state average.
Foreign-born population percentage significantly below state average.
Renting percentage significantly below state average.
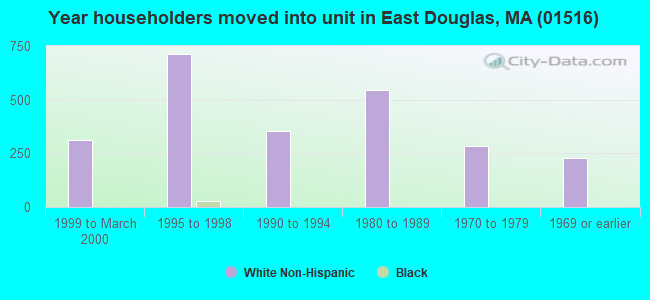
Length of stay since moving in significantly above state average.
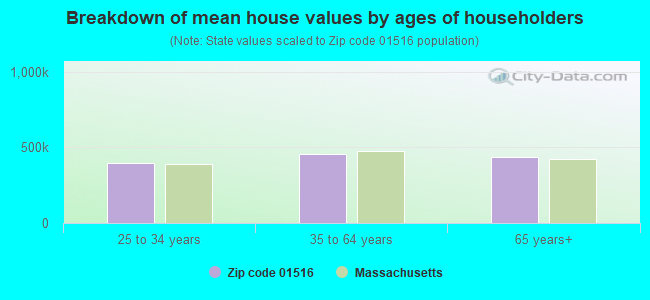
Estimated median house/condo value in 2022: $447,628
01516:
$447,628
Massachusetts:
$534,700
According to our research of Massachusetts and other state lists, there were 2 registered sex offenders living in 01516 zip code as of April 25, 2024. The ratio of all residents to sex offenders in zip code 01516 is 4,407 to 1. The ratio of registered sex offenders to all residents in this zip code is much lower than the state average.
Median resident age:
This zip code:
43.8 years
Massachusetts median age:
40.3 years
Average household size:
This zip code:
2.9 people
Massachusetts:
2.4 people
Averages for the 2020 tax year for zip code 01516, filed in 2021:
Average Adjusted Gross Income (AGI) in 2020: $84,787 (Individual Income Tax Returns)
Here:
$84,787
State:
$105,130
Salary/wage: $77,471 (reported on 86.4% of returns)
Here:
$77,471
State:
$82,951
(% of AGI for various income ranges: 1271.5% for AGIs below $25k, 3642.8% for AGIs $25k-50k, 6532.6% for AGIs $50k-75k, 9641.1% for AGIs $75k-100k, 20679.9% for AGIs $100k-200k, 71370.0% for AGIs over 200k)
Taxable interest for individuals: $639 (reported on 38.9% of returns)
This zip code:
$639
Massachusetts:
$2,361
(% of AGI for various income ranges: 16.6% for AGIs below $25k, 11.9% for AGIs $25k-50k, 23.2% for AGIs $50k-75k, 39.1% for AGIs $75k-100k, 72.8% for AGIs $100k-200k, 216.4% for AGIs over 200k)
Ordinary dividends: $2,419 (reported on 20.1% of returns)
Here:
$2,419
State:
$10,365
(% of AGI for various income ranges: 17.1% for AGIs below $25k, 24.5% for AGIs $25k-50k, 43.0% for AGIs $50k-75k, 66.9% for AGIs $75k-100k, 81.6% for AGIs $100k-200k, 930.9% for AGIs over 200k)
Net capital gain/loss in AGI: +$8,575 (reported on 17.4% of returns)
Here:
+$8,575
State:
+$48,178
(% of AGI for various income ranges: 20.5% for AGIs below $25k, 17.2% for AGIs $25k-50k, 57.0% for AGIs $50k-75k, 90.6% for AGIs $75k-100k, 253.1% for AGIs $100k-200k, 4113.6% for AGIs over 200k)
Profit/loss from business: +$18,969 (reported on 14.0% of returns)
Here:
+$18,969
State:
+$20,792
(% of AGI for various income ranges: 99.5% for AGIs below $25k, 143.8% for AGIs $25k-50k, 260.2% for AGIs $50k-75k, 422.3% for AGIs $75k-100k, 638.8% for AGIs $100k-200k, 3516.4% for AGIs over 200k)
Taxable individual retirement arrangement distribution: $19,892 (reported on 8.4% of returns)
01516:
$19,892
Massachusetts:
$22,790
(% of AGI for various income ranges: 61.2% for AGIs below $25k, 103.3% for AGIs $25k-50k, 178.2% for AGIs $50k-75k, 346.3% for AGIs $75k-100k, 398.2% for AGIs $100k-200k, 1805.5% for AGIs over 200k)
Self-employed (Keogh) retirement plans: $8,975 (reported on 0.8% of returns)
01516:
$8,975
Massachusetts:
$26,868
(% of AGI for various income ranges: 52.8% for AGIs $100k-200k)
Total itemized deductions: $25,014 (reported on 12.1% of returns)
Here:
$25,014
State:
$36,722
(% of AGI for various income ranges: 70.4% for AGIs below $25k, 149.7% for AGIs $25k-50k, 298.0% for AGIs $50k-75k, 687.1% for AGIs $75k-100k, 897.8% for AGIs $100k-200k, 2691.8% for AGIs over 200k)
Charity contributions: $3,998 (reported on 8.8% of returns)
Here:
$3,998
State:
$12,529
(% of AGI for various income ranges: 10.4% for AGIs $25k-50k, 24.4% for AGIs $50k-75k, 53.4% for AGIs $75k-100k, 106.9% for AGIs $100k-200k, 519.1% for AGIs over 200k)
Taxes paid: $8,862 (reported on 12.1% of returns)
01516:
$8,862
State:
$8,782
(% of AGI for various income ranges: 21.0% for AGIs below $25k, 43.2% for AGIs $25k-50k, 123.8% for AGIs $50k-75k, 262.0% for AGIs $75k-100k, 329.4% for AGIs $100k-200k, 830.0% for AGIs over 200k)
Earned income credit: $1,634 (reported on 6.1% of returns)
Here:
$1,634
State:
$1,909
(% of AGI for various income ranges: 33.6% for AGIs below $25k, 33.2% for AGIs $25k-50k)
Percentage of individuals using paid preparers for their 2020 taxes: 92.9%
Here:
93%
State:
92%
(% for various income ranges: 89.7% for AGIs below $25k, 94.4% for AGIs $25k-50k, 92.8% for AGIs $50k-75k, 96.1% for AGIs $75k-100k, 93.2% for AGIs $100k-200k, 94.1% for AGIs over 200k)
Averages for the 2012 tax year for zip code 01516, filed in 2013:
Average Adjusted Gross Income (AGI) in 2012: $67,943 (Individual Income Tax Returns)
Here:
$67,943
State:
$81,425
Salary/wage: $64,224 (reported on 89.9% of returns)
Here:
$64,224
State:
$64,752
(% of AGI for various income ranges: 75.6% for AGIs below $25k, 80.0% for AGIs $25k-50k, 81.7% for AGIs $50k-75k, 84.4% for AGIs $75k-100k, 89.0% for AGIs $100k-200k, 83.2% for AGIs over 200k)
Taxable interest for individuals: $455 (reported on 51.0% of returns)
This zip code:
$455
Massachusetts:
$2,136
(% of AGI for various income ranges: 0.9% for AGIs below $25k, 0.5% for AGIs $25k-50k, 0.4% for AGIs $50k-75k, 0.2% for AGIs $75k-100k, 0.3% for AGIs $100k-200k, 0.2% for AGIs over 200k)
Ordinary dividends: $1,512 (reported on 20.3% of returns)
Here:
$1,512
State:
$9,473
(% of AGI for various income ranges: 0.8% for AGIs below $25k, 0.4% for AGIs $25k-50k, 0.5% for AGIs $50k-75k, 0.4% for AGIs $75k-100k, 0.4% for AGIs $100k-200k, 0.7% for AGIs over 200k)
Net capital gain/loss in AGI: +$3,785 (reported on 13.0% of returns)
Here:
+$3,785
State:
+$31,437
(% of AGI for various income ranges: 0.6% for AGIs $75k-100k, 0.9% for AGIs $100k-200k, 2.2% for AGIs over 200k)
Profit/loss from business: +$15,370 (reported on 13.8% of returns)
Here:
+$15,370
State:
+$20,662
(% of AGI for various income ranges: 6.9% for AGIs below $25k, 5.7% for AGIs $25k-50k, 4.3% for AGIs $50k-75k, 3.8% for AGIs $75k-100k, 1.8% for AGIs $100k-200k, 1.7% for AGIs over 200k)
Taxable individual retirement arrangement distribution: $14,406 (reported on 8.0% of returns)
01516:
$14,406
Massachusetts:
$18,892
(% of AGI for various income ranges: 3.4% for AGIs below $25k, 2.0% for AGIs $25k-50k, 1.9% for AGIs $50k-75k, 2.0% for AGIs $75k-100k, 1.4% for AGIs $100k-200k, 1.3% for AGIs over 200k)
Self-employment retirement plans: $13,500 (reported on 0.7% of returns)
01516:
$13,500
Massachusetts:
$20,669
Total itemized deductions: $21,238 (20% of AGI, reported on 50.5% of returns)
Here:
$21,238
State:
$28,907
Here:
20.4% of AGI
State:
18.2% of AGI
(% of AGI for various income ranges: 11.7% for AGIs below $25k, 14.2% for AGIs $25k-50k, 16.2% for AGIs $50k-75k, 17.5% for AGIs $75k-100k, 16.8% for AGIs $100k-200k, 12.7% for AGIs over 200k)
Charity contributions: $1,763 (reported on 39.4% of returns)
Here:
$1,763
State:
$4,208
(% of AGI for various income ranges: 0.5% for AGIs below $25k, 0.8% for AGIs $25k-50k, 1.0% for AGIs $50k-75k, 0.9% for AGIs $75k-100k, 1.1% for AGIs $100k-200k, 1.3% for AGIs over 200k)
Taxes paid: $9,325 (reported on 50.2% of returns)
01516:
$9,325
State:
$13,303
(% of AGI for various income ranges: 3.2% for AGIs below $25k, 4.4% for AGIs $25k-50k, 6.2% for AGIs $50k-75k, 7.2% for AGIs $75k-100k, 7.9% for AGIs $100k-200k, 7.3% for AGIs over 200k)
Earned income credit: $1,873 (reported on 8.9% of returns)
Here:
$1,873
State:
$1,971
(% of AGI for various income ranges: 4.0% for AGIs below $25k, 0.6% for AGIs $25k-50k)
Percentage of individuals using paid preparers for their 2012 taxes: 56.0%
Here:
56%
State:
56%
(% for various income ranges: 46.6% for AGIs below $25k, 58.5% for AGIs $25k-50k, 60.0% for AGIs $50k-75k, 61.5% for AGIs $75k-100k, 59.1% for AGIs $100k-200k, 64.3% for AGIs over 200k)
Averages for the 2004 tax year for zip code 01516, filed in 2005:
Average Adjusted Gross Income (AGI) in 2004: $56,511 (Individual Income Tax Returns)
Here:
$56,511
State:
$62,877
Salary/wage: $53,147 (reported on 91.2% of returns)
Here:
$53,147
State:
$52,969
(% of AGI for various income ranges: 91.3% for AGIs below $10k, 74.9% for AGIs $10k-25k, 85.3% for AGIs $25k-50k, 88.5% for AGIs $50k-75k, 91.7% for AGIs $75k-100k, 81.8% for AGIs over 100k)
Taxable interest for individuals: $563 (reported on 63.4% of returns)
This zip code:
$563
Massachusetts:
$1,945
(% of AGI for various income ranges: 2.4% for AGIs below $10k, 1.9% for AGIs $10k-25k, 0.7% for AGIs $25k-50k, 0.4% for AGIs $50k-75k, 0.4% for AGIs $75k-100k, 0.7% for AGIs over 100k)
Taxable dividends: $1,195 (reported on 23.2% of returns)
Here:
$1,195
State:
$5,323
(% of AGI for various income ranges: 1.1% for AGIs below $10k, 0.5% for AGIs $10k-25k, 0.2% for AGIs $25k-50k, 0.3% for AGIs $50k-75k, 0.3% for AGIs $75k-100k, 0.8% for AGIs over 100k)
Net capital gain/loss: +$7,972 (reported on 17.9% of returns)
Here:
+$7,972
State:
+$20,377
(% of AGI for various income ranges: -0.9% for AGIs below $10k, 0.3% for AGIs $10k-25k, 0.2% for AGIs $25k-50k, 0.5% for AGIs $50k-75k, 1.0% for AGIs $75k-100k, 5.9% for AGIs over 100k)
Profit/loss from business: +$14,963 (reported on 15.2% of returns)
Here:
+$14,963
State:
+$17,837
(% of AGI for various income ranges: 5.2% for AGIs below $10k, 7.4% for AGIs $10k-25k, 6.3% for AGIs $25k-50k, 4.4% for AGIs $50k-75k, 2.2% for AGIs $75k-100k, 3.6% for AGIs over 100k)
IRA payment deduction: $2,726 (reported on 2.8% of returns)
01516:
$2,726
Massachusetts:
$3,100
(% of AGI for various income ranges: 0.3% for AGIs $10k-25k, 0.3% for AGIs $25k-50k, 0.2% for AGIs $50k-75k, 0.1% for AGIs $75k-100k, 0.1% for AGIs over 100k)
Self-employed pension: $14,577 (reported on 0.7% of returns)
Here:
$14,577
Massachusetts:
$14,516
Total itemized deductions: $18,798 (22% of AGI, reported on 53.0% of returns)
Here:
$18,798
State:
$22,573
Here:
22.3% of AGI
State:
19.5% of AGI
(% of AGI for various income ranges: 13.4% for AGIs below $10k, 11.4% for AGIs $10k-25k, 15.1% for AGIs $25k-50k, 19.5% for AGIs $50k-75k, 20.7% for AGIs $75k-100k, 16.5% for AGIs over 100k)
Charity contributions deductions: $1,556 (2% of AGI, reported on 48.2% of returns)
Here:
$1,556
State:
$3,295
Here:
1.8% of AGI
State:
2.7% of AGI
(% of AGI for various income ranges: 0.3% for AGIs below $10k, 0.7% for AGIs $10k-25k, 1.1% for AGIs $25k-50k, 1.3% for AGIs $50k-75k, 1.5% for AGIs $75k-100k, 1.5% for AGIs over 100k)
Total tax: $7,137 (reported on 85.0% of returns)
01516:
$7,137
State:
$11,494
(% of AGI for various income ranges: 3.2% for AGIs below $10k, 5.5% for AGIs $10k-25k, 7.6% for AGIs $25k-50k, 8.3% for AGIs $50k-75k, 9.3% for AGIs $75k-100k, 15.1% for AGIs over 100k)
Earned income credit: $1,384 (reported on 6.7% of returns)
Here:
$1,384
State:
$1,518
Percentage of individuals using paid preparers for their 2004 taxes: 55.6%
Here:
56%
State:
58%
(% for various income ranges: 42.8% for AGIs below $10k, 53.9% for AGIs $10k-25k, 56.9% for AGIs $25k-50k, 61.6% for AGIs $50k-75k, 56.2% for AGIs $75k-100k, 60.9% for AGIs over 100k)
Household received Food Stamps/SNAP in the past 12 months: 252 Household did not receive Food Stamps/SNAP in the past 12 months: 2,927
Women who had a birth in the past 12 months: 15 (16 now married, 0 unmarried) Women who did not have a birth in the past 12 months: 2,282 (889 now married, 1,389 unmarried)
Housing units in zip code 01516 with a mortgage: 2,015 (378 second mortgage, 276 both second mortgage and home equity loan) Median monthly owner costs for units with a mortgage: $2,360 Median monthly owner costs for units without a mortgage: $903
Residents with income below the poverty level in 2022:
This zip code:
3.2%
Whole state:
10.4%
Residents with income below 50% of the poverty level in 2022:
This zip code:
1.2%
Whole state:
5.1%
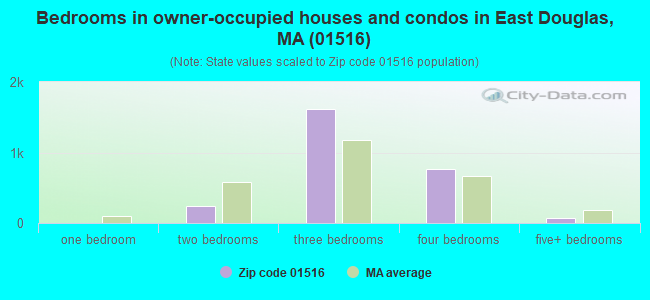
Median number of rooms in houses and condos:
Here:
6.9
State:
6.5
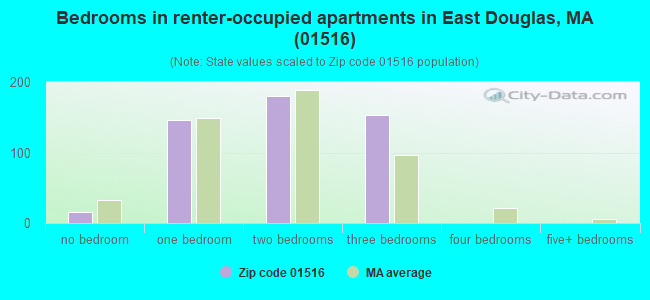
Median number of rooms in apartments:
Here:
4.2
State:
4.0
Notable locations in this zip code not listed on our city pages
Cemeteries: Evergreen Cemetery (1), South Douglas Cemetery (2), Douglas Center Cemetery (3), Saint Denis Cemetery (4). Display/hide their locations on the map
Lakes, reservoirs, and swamps: Grassy Pond (A), Badluck Lake (B), Chamberlain Pond (C), Wallis Pond (D), Bating Pond (E), Chase Pond (F), Hunt Pond (G), Morse Pond (H). Display/hide their locations on the map
Streams, rivers, and creeks: Bating Brook (A), Caswell Brook (B), Cedar Swamp Brook (C), Centerville Brook (D), Dudley Brook (E), Gilboa Brook (F), Greene Brook (G), Riddle Brook (H), Wellman Brook (I). Display/hide their locations on the map
Size of family households: 752 2-persons, 727 3-persons, 597 4-persons, 268 5-persons, 84 6-persons, 9 7-or-more-persons
Size of nonfamily households: 613 1-person, 143 2-persons
1,591 married couples with children.
346 single-parent households (259 men, 87 women).
95.7% of residents of 01516 zip code speak English at home.
0.8% of residents speak Spanish at home (100% very well).
2.7% of residents speak other Indo-European language at home (87% very well, 13% well).
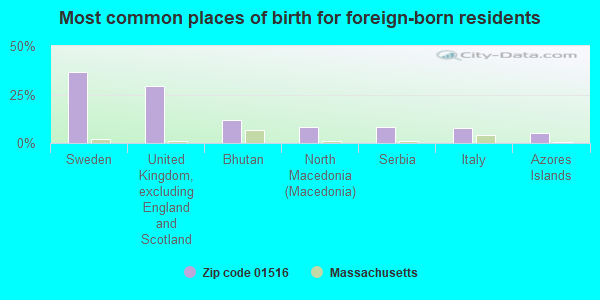
Foreign born population: 238 (2.6%) (71.5% of them are naturalized citizens)
This zip code:
2.6%
Whole state:
18.0%
37%Sweden
29%United Kingdom, excluding England and Scotland
12%Bhutan
8%North Macedonia (Macedonia)
8%Serbia
8%Italy
5%Azores Islands
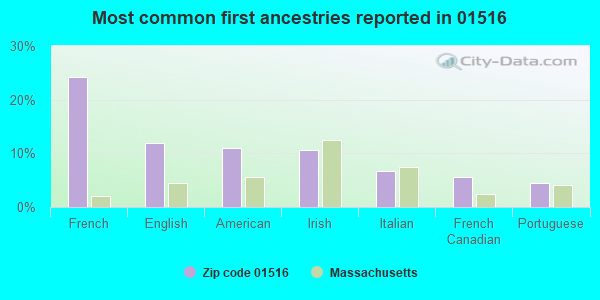
24%French
12%English
11%American
11%Irish
7%Italian
6%French Canadian
5%Portuguese
Year of entry for the foreign-born population
112010 or later
242000 to 2009
621990 to 1999
177Before 1990
Facilities with environmental interests located in this zip code:
DOUGLAS W W T P (CHARLES STREET in EAST DOUGLAS, MA)
(Integrated Compliance Information System) - ICIS-01-1997-0163, FORMAL ENFORCEMENT ACTION National Pollutant Discharge Elimination System NON-MAJOR (Tracking pollutant discharge elimination systems) - permit - ICIS-, ENFORCEMENT/COMPLIANCE ACTIVITY Business SIC classification: SEWERAGE SYSTEMS Organizations: DOUGLAS W W T F (CONTACT/OPERATOR)
Alternative names: DOUGLAS TOWN OF WTP
DOUGLAS EARLY CHILDHOOD (29 DEPOT ST. in DOUGLAS, MA)
COMPLIANCE ACTIVITY (Tracking inspections of insecticide, fungicide, and rodenticide, and toxic substances) (National Center for Education Statistics) - STATE ID-077003
DOUGLAS ELEMENTARY (17 GLEASON COURT in EAST DOUGLAS, MA)
(National Center for Education Statistics) - STATE ID-077010
DOUGLAS MIDDLE HIGH (33 DAVIS STREET in DOUGLAS, MA)
(National Center for Education Statistics) - STATE ID-077505
ON SITE OIL (MULTIPLE SITES in DOUGLAS, MA)
(Resource Conservation and Recovery Act (tracking hazardous waste)) Business NAICS classification: ALL OTHER AUTOMOTIVE REPAIR AND MAINTENANCE. Organizations: JASON JOHNSON (CONTACT/OWNER)
BOBS AUTO BODY (DAVIS ST RTE 16 in DOUGLAS, MA)
(Resource Conservation and Recovery Act (tracking hazardous waste)) Organizations: ROBERT PRUNIER (CONTACT/OWNER)
COLONAIR TOM AUTO BODY (96 SOUTH ST in DOUGLAS, MA)
Conditionally Exempt Small Quantity Generators, less than 100 kg/month of hazardous waste (Resource Conservation and Recovery Act (tracking hazardous waste)) - notification Organizations: THOMAS F COLONAIR SR (CONTACT/OWNER)
MR CHRISTMAS INCORPORATED (NORTH STREET in DOUGLAS, MA)
AIR MINOR (AIRS/AFS) Business SIC classification: OPERATORS OF NONRESIDENTIAL BUILDINGS
DOUGLAS (DOUGLAS in DOUGLAS, MA)
AIR MINOR (AIRS/AFS) Business SIC classification: GENERAL GOVERNMENT
DOUGLAS LANDFILL (RIEDELL RD in DOUGLAS, MA)
CRITERIA AND HAZARDOUS AIR POLLUTANT INVENTORY (Inventory of air pollution sources) Business SIC classification: REFUSE SYSTEMS Business NAICS classification: SOLID WASTE LANDFILL.
Housing units lacking complete plumbing facilities: 1.4%
67.5%Fuel oil, kerosene, etc.
10.9%Bottled, tank, or LP gas
6.6%Electricity
6.1%Other fuel
5.6%Wood
2.5%Utility gas
0.6%Solar energy
Population in 1990: 5,594. Population change in the 1990s: +1,476 (+26.4%).
Place of birth for U.S.-born residents:
This state: 6,491
Northeast: 1,868
Midwest: 114
South: 227
West: 162
63% of the 01516 zip code residents lived in the same house 5 years ago. Out of people who lived in different houses, 64% lived in this county. Out of people who lived in different counties, 50% lived in Massachusetts.
94% of the 01516 zip code residents lived in the same house 1 year ago. Out of people who lived in different houses, 73% moved from this county. Out of people who lived in different houses, 10% moved from different county within same state. Out of people who lived in different houses, 10% moved from different state. Out of people who lived in different houses, 4% moved from abroad.
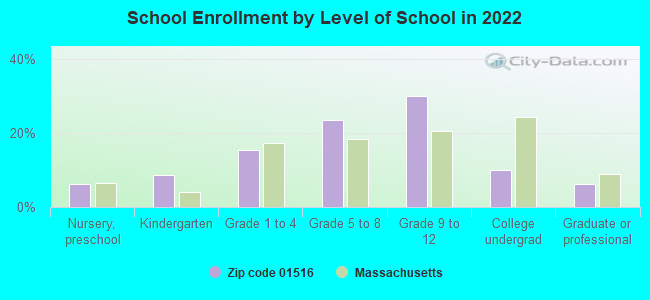
Private vs. public school enrollment:
Students in private schools in grades 1 to 8 (elementary and middle school): 63
Here:
7.3%
Massachusetts:
10.3%
Students in private schools in grades 9 to 12 (high school): 14
Here:
2.1%
Massachusetts:
12.3%
Students in private undergraduate colleges: 16
Here:
7.8%
Massachusetts:
51.2%
Occupation by median earnings in the past 12 months ($)
99,646Computer and mathematical occupations
89,602Community and social service occupations
88,584Management occupations
83,799Business and financial operations occupations
82,262Sales and related occupations
81,562Architecture and engineering occupations
Top industries in this zip code by the number of employees in 2005:
Accommodation and Food Services: Snack and Nonalcoholic Beverage Bars (50-99 employees: 1 establishment, 1-4 employees: 1 establishment)
Construction: New Single-Family Housing Construction (except Operative Builders) (20-49: 1, 5-9: 1, 1-4: 8)
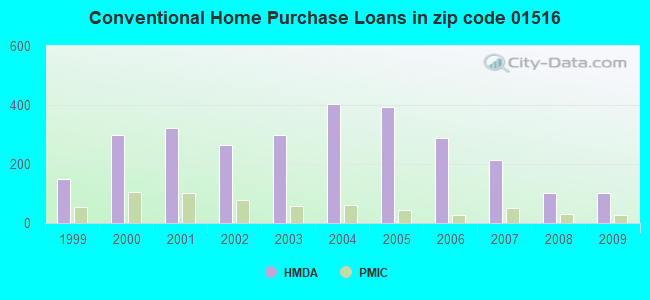
Detailed PMIC statistics for the following Tracts:7521.00
2002 - 2018 National Fire Incident Reporting System (NFIRS) incidents
Based on the data from the years 2002 - 2018 the average number of fires per year is 39. The highest number of reported fires - 59 took place in 2011, and the least - 16 in 2018. The data has a declining trend.
When looking into fire subcategories, the most reports belonged to: Structure Fires (51.6%), and Outside Fires (37.0%).
Fire incident types reported to NFIRS in Zip Code 01516


 Nearest zip codes: 01590, 02859, 01570, 01588, 01569, 02826.
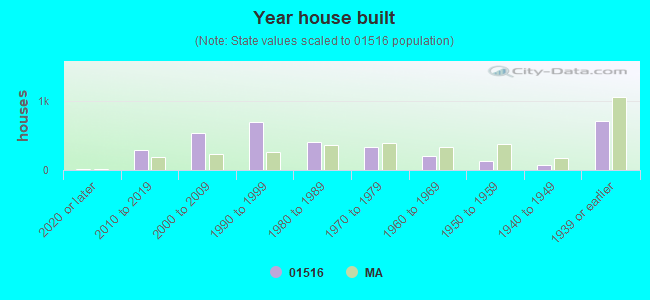


 Based on the data from the years 2002 - 2018 the average number of fires per year is 39. The highest number of reported fires - 59 took place in 2011, and the least - 16 in 2018. The data has a declining trend.
 When looking into fire subcategories, the most reports belonged to: Structure Fires (51.6%), and Outside Fires (37.0%).