Estimated zip code population in 2022: 4,791 Zip code population in 2010: 4,263 Zip code population in 2000: 3,522
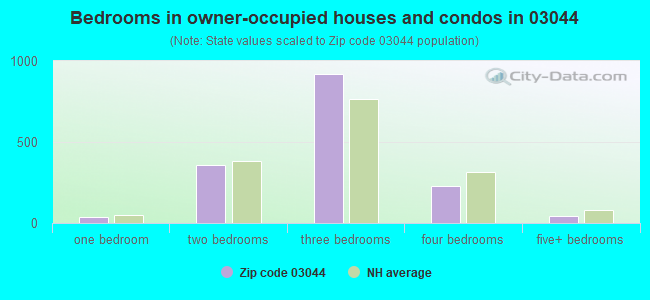
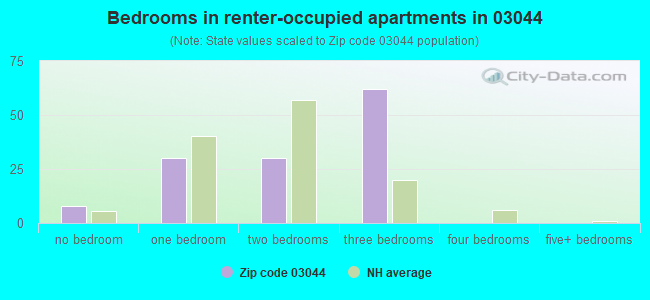
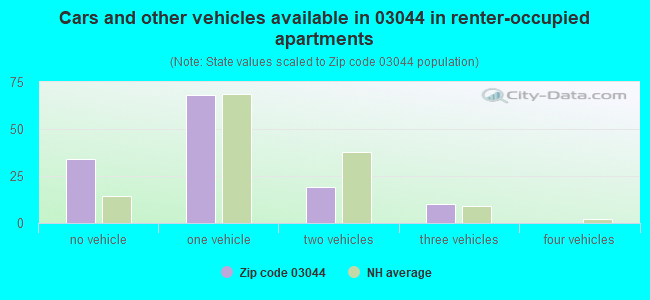
Houses and condos: 1,750 Renter-occupied apartments: 131
% of renters here:
8%
State:
28%
March 2022 cost of living index in zip code 03044: 114.6 (more than average, U.S. average is 100)
Land area: 16.9 sq. mi. Water area: 0.3 sq. mi.
Population density: 283 people per square mile
(very low).
OSM Map
Google Map
MSN Map
OSM Map
General Map
Google Map
MSN Map
OSM Map
Google Map
MSN Map
OSM Map
Google Map
MSN Map
Please wait while loading the map...
Real estate property taxes paid for housing units in 2022:
This zip code:
1.6% ($6,554)
New Hampshire:
1.6% ($6,209)
Median real estate property taxes paid for housing units with mortgages in 2022: $6,542 (1.7%) Median real estate property taxes paid for housing units with no mortgage in 2022: $6,596 (1.5%)
Business Search- 14 Million verified businesses
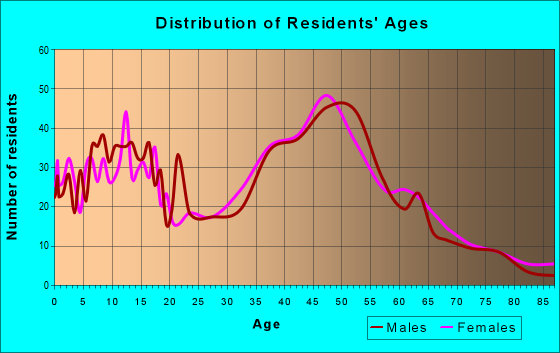
Males: 2,374
(49.5%)
Females: 2,417
(50.5%)
For population 25 years and over in 03044:
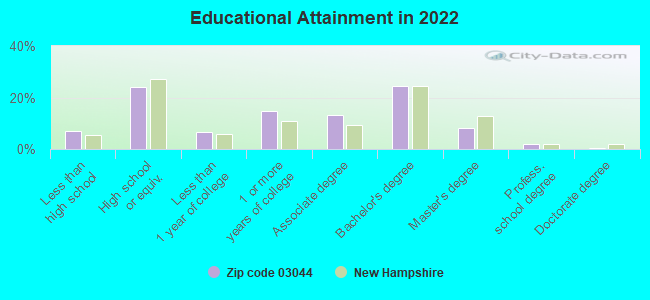
High school or higher: 91.7%
Bachelor's degree or higher: 34.2%
Graduate or professional degree: 10.3%
Unemployed: 1.8%
Mean travel time to work (commute): 35.4 minutes
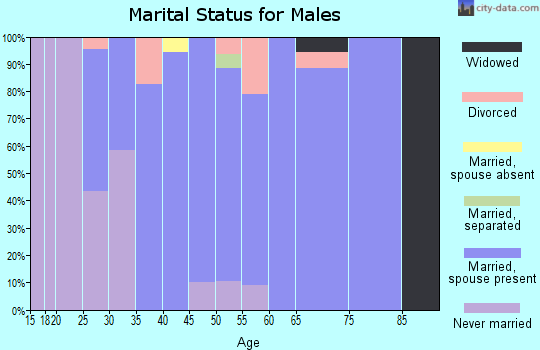
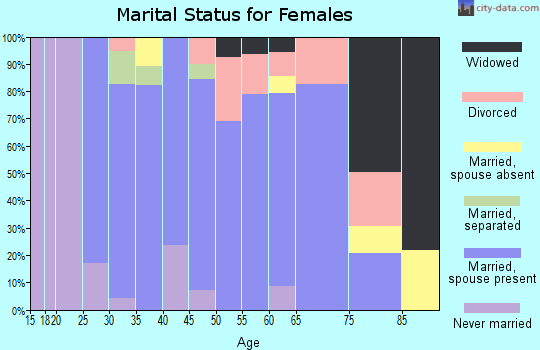
For population 15 years and over in 03044:
Never married: 26.4%
Now married: 60.1%
Separated: 1.7%
Widowed: 4.8%
Divorced: 7.1%
Zip code 03044 compared to state average:
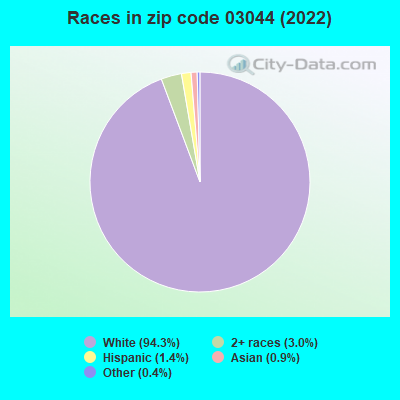
Black race population percentage significantly below state average.
Hispanic race population percentage significantly below state average.
Foreign-born population percentage below state average.
Renting percentage significantly below state average.
Estimated median house/condo value in 2022: $403,302
03044:
$403,302
New Hampshire:
$384,700
According to our research of New Hampshire and other state lists, there was 1 registered sex offender living in 03044 zip code as of April 23, 2024. The ratio of all residents to sex offenders in zip code 03044 is 4,465 to 1. The ratio of registered sex offenders to all residents in this zip code is much lower than the state average.
Median resident age:
This zip code:
43.5 years
New Hampshire median age:
43.3 years
Average household size:
This zip code:
2.8 people
New Hampshire:
2.4 people
Averages for the 2020 tax year for zip code 03044, filed in 2021:
Average Adjusted Gross Income (AGI) in 2020: $79,915 (Individual Income Tax Returns)
Here:
$79,915
State:
$88,845
Salary/wage: $73,005 (reported on 83.6% of returns)
Here:
$73,005
State:
$71,693
(% of AGI for various income ranges: 1266.1% for AGIs below $25k, 3587.7% for AGIs $25k-50k, 6590.4% for AGIs $50k-75k, 9815.9% for AGIs $75k-100k, 19272.9% for AGIs $100k-200k, 64208.0% for AGIs over 200k)
Taxable interest for individuals: $543 (reported on 38.7% of returns)
This zip code:
$543
New Hampshire:
$1,640
(% of AGI for various income ranges: 13.1% for AGIs below $25k, 21.0% for AGIs $25k-50k, 27.9% for AGIs $50k-75k, 29.5% for AGIs $75k-100k, 45.9% for AGIs $100k-200k, 220.0% for AGIs over 200k)
Ordinary dividends: $2,295 (reported on 22.3% of returns)
Here:
$2,295
State:
$8,258
(% of AGI for various income ranges: 30.3% for AGIs below $25k, 26.4% for AGIs $25k-50k, 30.7% for AGIs $50k-75k, 49.1% for AGIs $75k-100k, 130.0% for AGIs $100k-200k, 920.0% for AGIs over 200k)
Net capital gain/loss in AGI: +$10,863 (reported on 18.0% of returns)
Here:
+$10,863
State:
+$28,952
(% of AGI for various income ranges: 12.2% for AGIs below $25k, 54.9% for AGIs $25k-50k, 35.7% for AGIs $50k-75k, 120.0% for AGIs $75k-100k, 381.5% for AGIs $100k-200k, 6156.0% for AGIs over 200k)
Profit/loss from business: +$18,269 (reported on 14.1% of returns)
Here:
+$18,269
State:
+$24,424
(% of AGI for various income ranges: 55.8% for AGIs below $25k, 221.8% for AGIs $25k-50k, 443.2% for AGIs $50k-75k, 409.1% for AGIs $75k-100k, 564.1% for AGIs $100k-200k, 2904.0% for AGIs over 200k)
Taxable individual retirement arrangement distribution: $20,433 (reported on 10.5% of returns)
03044:
$20,433
New Hampshire:
$21,952
(% of AGI for various income ranges: 88.9% for AGIs below $25k, 157.4% for AGIs $25k-50k, 202.5% for AGIs $50k-75k, 271.4% for AGIs $75k-100k, 1005.6% for AGIs $100k-200k)
Total itemized deductions: $24,304 (reported on 9.8% of returns)
Here:
$24,304
State:
$32,702
(% of AGI for various income ranges: 253.1% for AGIs $25k-50k, 290.0% for AGIs $50k-75k, 485.0% for AGIs $75k-100k, 555.0% for AGIs $100k-200k, 2646.0% for AGIs over 200k)
Charity contributions: $4,513 (reported on 5.9% of returns)
Here:
$4,513
State:
$9,866
(% of AGI for various income ranges: 5.8% for AGIs below $25k, 8.2% for AGIs $50k-75k, 17.3% for AGIs $75k-100k, 67.1% for AGIs $100k-200k, 734.0% for AGIs over 200k)
Taxes paid: $8,233 (reported on 9.4% of returns)
03044:
$8,233
State:
$8,247
(% of AGI for various income ranges: 80.0% for AGIs $25k-50k, 107.1% for AGIs $50k-75k, 194.1% for AGIs $75k-100k, 177.6% for AGIs $100k-200k, 666.0% for AGIs over 200k)
Earned income credit: $1,480 (reported on 5.9% of returns)
Here:
$1,480
State:
$1,831
(% of AGI for various income ranges: 34.4% for AGIs below $25k, 25.1% for AGIs $25k-50k)
Percentage of individuals using paid preparers for their 2020 taxes: 92.2%
Here:
92%
State:
92%
(% for various income ranges: 87.7% for AGIs below $25k, 94.2% for AGIs $25k-50k, 92.5% for AGIs $50k-75k, 93.8% for AGIs $75k-100k, 93.3% for AGIs $100k-200k, 93.3% for AGIs over 200k)
Averages for the 2012 tax year for zip code 03044, filed in 2013:
Average Adjusted Gross Income (AGI) in 2012: $62,311 (Individual Income Tax Returns)
Here:
$62,311
State:
$66,185
Salary/wage: $58,504 (reported on 87.3% of returns)
Here:
$58,504
State:
$55,674
(% of AGI for various income ranges: 72.6% for AGIs below $25k, 79.3% for AGIs $25k-50k, 79.0% for AGIs $50k-75k, 85.8% for AGIs $75k-100k, 87.0% for AGIs $100k-200k, 69.2% for AGIs over 200k)
Taxable interest for individuals: $383 (reported on 37.6% of returns)
This zip code:
$383
New Hampshire:
$1,674
(% of AGI for various income ranges: 1.0% for AGIs below $25k, 0.3% for AGIs $25k-50k, 0.3% for AGIs $50k-75k, 0.2% for AGIs $75k-100k, 0.1% for AGIs $100k-200k, 0.1% for AGIs over 200k)
Ordinary dividends: $2,262 (reported on 21.3% of returns)
Here:
$2,262
State:
$6,774
(% of AGI for various income ranges: 3.9% for AGIs below $25k, 1.2% for AGIs $25k-50k, 0.6% for AGIs $50k-75k, 0.3% for AGIs $75k-100k, 0.5% for AGIs $100k-200k, 0.8% for AGIs over 200k)
Net capital gain/loss in AGI: +$2,703 (reported on 14.0% of returns)
Here:
+$2,703
State:
+$13,759
(% of AGI for various income ranges: 0.3% for AGIs $50k-75k, 0.7% for AGIs $100k-200k, 3.4% for AGIs over 200k)
Profit/loss from business: +$12,786 (reported on 15.8% of returns)
Here:
+$12,786
State:
+$19,298
(% of AGI for various income ranges: 8.1% for AGIs below $25k, 5.9% for AGIs $25k-50k, 4.1% for AGIs $50k-75k, 2.4% for AGIs $75k-100k, 2.6% for AGIs $100k-200k)
Taxable individual retirement arrangement distribution: $15,043 (reported on 9.5% of returns)
03044:
$15,043
New Hampshire:
$16,908
(% of AGI for various income ranges: 2.6% for AGIs below $25k, 2.2% for AGIs $25k-50k, 3.1% for AGIs $50k-75k, 2.2% for AGIs $75k-100k, 2.5% for AGIs $100k-200k)
Total itemized deductions: $20,111 (21% of AGI, reported on 46.6% of returns)
Here:
$20,111
State:
$22,617
Here:
21.4% of AGI
State:
18.1% of AGI
(% of AGI for various income ranges: 19.5% for AGIs below $25k, 12.9% for AGIs $25k-50k, 17.6% for AGIs $50k-75k, 15.7% for AGIs $75k-100k, 14.8% for AGIs $100k-200k, 10.1% for AGIs over 200k)
Charity contributions: $1,571 (reported on 34.4% of returns)
Here:
$1,571
State:
$2,860
(% of AGI for various income ranges: 0.8% for AGIs below $25k, 0.6% for AGIs $25k-50k, 0.6% for AGIs $50k-75k, 0.8% for AGIs $75k-100k, 0.9% for AGIs $100k-200k, 1.4% for AGIs over 200k)
Taxes paid: $8,704 (reported on 45.7% of returns)
03044:
$8,704
State:
$8,830
(% of AGI for various income ranges: 6.1% for AGIs below $25k, 5.2% for AGIs $25k-50k, 6.8% for AGIs $50k-75k, 6.8% for AGIs $75k-100k, 6.7% for AGIs $100k-200k, 4.9% for AGIs over 200k)
Earned income credit: $1,511 (reported on 8.6% of returns)
Here:
$1,511
State:
$1,863
(% of AGI for various income ranges: 2.5% for AGIs below $25k, 0.6% for AGIs $25k-50k)
Percentage of individuals using paid preparers for their 2012 taxes: 48.0%
Here:
48%
State:
45%
(% for various income ranges: 39.7% for AGIs below $25k, 47.6% for AGIs $25k-50k, 52.6% for AGIs $50k-75k, 53.6% for AGIs $75k-100k, 52.5% for AGIs $100k-200k, 60.0% for AGIs over 200k)
Averages for the 2004 tax year for zip code 03044, filed in 2005:
Average Adjusted Gross Income (AGI) in 2004: $54,619 (Individual Income Tax Returns)
Here:
$54,619
State:
$54,348
Salary/wage: $50,016 (reported on 90.3% of returns)
Here:
$50,016
State:
$46,966
(% of AGI for various income ranges: 118.6% for AGIs below $10k, 72.3% for AGIs $10k-25k, 81.1% for AGIs $25k-50k, 85.9% for AGIs $50k-75k, 88.9% for AGIs $75k-100k, 78.0% for AGIs over 100k)
Taxable interest for individuals: $704 (reported on 52.5% of returns)
This zip code:
$704
New Hampshire:
$1,634
(% of AGI for various income ranges: 4.7% for AGIs below $10k, 2.1% for AGIs $10k-25k, 0.7% for AGIs $25k-50k, 0.5% for AGIs $50k-75k, 0.4% for AGIs $75k-100k, 0.6% for AGIs over 100k)
Taxable dividends: $1,046 (reported on 25.0% of returns)
Here:
$1,046
State:
$3,855
(% of AGI for various income ranges: 3.9% for AGIs below $10k, 1.2% for AGIs $10k-25k, 0.6% for AGIs $25k-50k, 0.3% for AGIs $50k-75k, 0.3% for AGIs $75k-100k, 0.4% for AGIs over 100k)
Net capital gain/loss: +$3,739 (reported on 19.4% of returns)
Here:
+$3,739
State:
+$13,739
(% of AGI for various income ranges: -2.4% for AGIs below $10k, -0.4% for AGIs $10k-25k, 0.6% for AGIs $25k-50k, 0.1% for AGIs $50k-75k, 0.1% for AGIs $75k-100k, 3.7% for AGIs over 100k)
Profit/loss from business: +$16,549 (reported on 18.3% of returns)
Here:
+$16,549
State:
+$16,641
(% of AGI for various income ranges: 5.4% for AGIs below $10k, 7.0% for AGIs $10k-25k, 7.8% for AGIs $25k-50k, 5.0% for AGIs $50k-75k, 4.5% for AGIs $75k-100k, 5.2% for AGIs over 100k)
IRA payment deduction: $2,614 (reported on 3.1% of returns)
03044:
$2,614
New Hampshire:
$3,013
Self-employed pension: $9,261 (reported on 1.3% of returns)
Here:
$9,261
New Hampshire:
$13,003
Total itemized deductions: $18,348 (24% of AGI, reported on 52.8% of returns)
Here:
$18,348
State:
$18,832
Here:
24.2% of AGI
State:
19.6% of AGI
(% of AGI for various income ranges: 22.0% for AGIs below $10k, 15.6% for AGIs $10k-25k, 19.9% for AGIs $25k-50k, 21.0% for AGIs $50k-75k, 19.1% for AGIs $75k-100k, 14.0% for AGIs over 100k)
Charity contributions deductions: $1,324 (2% of AGI, reported on 45.1% of returns)
Here:
$1,324
State:
$2,473
Here:
1.7% of AGI
State:
2.4% of AGI
(% of AGI for various income ranges: 0.9% for AGIs $10k-25k, 0.9% for AGIs $25k-50k, 1.1% for AGIs $50k-75k, 1.2% for AGIs $75k-100k, 1.2% for AGIs over 100k)
Total tax: $7,321 (reported on 82.5% of returns)
03044:
$7,321
State:
$8,835
(% of AGI for various income ranges: 2.3% for AGIs below $10k, 4.9% for AGIs $10k-25k, 7.3% for AGIs $25k-50k, 7.9% for AGIs $50k-75k, 10.1% for AGIs $75k-100k, 16.7% for AGIs over 100k)
Earned income credit: $1,613 (reported on 6.5% of returns)
Here:
$1,613
State:
$1,447
Percentage of individuals using paid preparers for their 2004 taxes: 57.5%
Here:
57%
State:
51%
(% for various income ranges: 41.1% for AGIs below $10k, 56.2% for AGIs $10k-25k, 60.7% for AGIs $25k-50k, 63.8% for AGIs $50k-75k, 61.1% for AGIs $75k-100k, 57.2% for AGIs over 100k)
Household received Food Stamps/SNAP in the past 12 months: 68 Household did not receive Food Stamps/SNAP in the past 12 months: 1,655
Women who had a birth in the past 12 months: 62 (56 now married, 0 unmarried) Women who did not have a birth in the past 12 months: 1,042 (541 now married, 503 unmarried)
Housing units in zip code 03044 with a mortgage: 1,052 (92 second mortgage, 79 both second mortgage and home equity loan) Houses without a mortgage: 42
Median monthly owner costs for units with a mortgage: $2,188 Median monthly owner costs for units without a mortgage: $1,022
Residents with income below the poverty level in 2022:
This zip code:
4.0%
Whole state:
7.2%
Residents with income below 50% of the poverty level in 2022:
This zip code:
2.3%
Whole state:
3.7%
Median number of rooms in houses and condos:
Here:
6.5
State:
6.4
Median number of rooms in apartments:
Here:
4.8
State:
4.0
Notable locations in this zip code not listed on our city pages
In group quarters: 45 (-1 institutionalized population)
Size of family households: 506 2-persons, 397 3-persons, 379 4-persons, 107 5-persons, 13 6-persons, 1 7-or-more-persons
Size of nonfamily households: 270 1-person, 49 2-persons
646 married couples with children.
255 single-parent households (80 men, 175 women).
97.2% of residents of 03044 zip code speak English at home.
1.3% of residents speak other Indo-European language at home (86% very well, 14% well).
1.2% of residents speak Asian or Pacific Island language at home (34% very well, 9% well, 57% not well).
0.2% of residents speak other language at home (100% very well).
Foreign born population: 155 (3.2%) (100.0% of them are naturalized citizens)
This zip code:
3.2%
Whole state:
6.2%
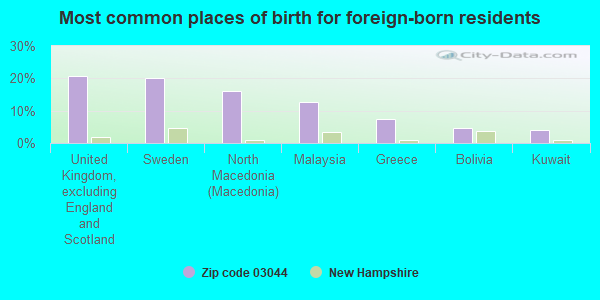
21%United Kingdom, excluding England and Scotland
20%Sweden
16%North Macedonia (Macedonia)
13%Malaysia
7%Greece
5%Bolivia
4%Kuwait
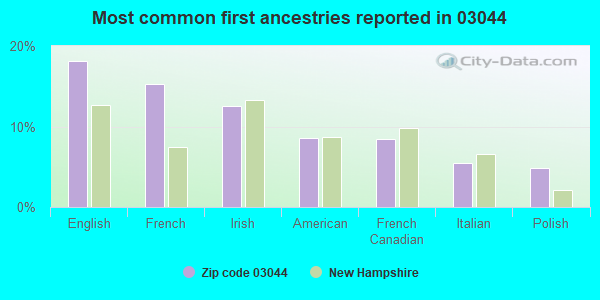
18%English
15%French
13%Irish
9%American
8%French Canadian
5%Italian
5%Polish
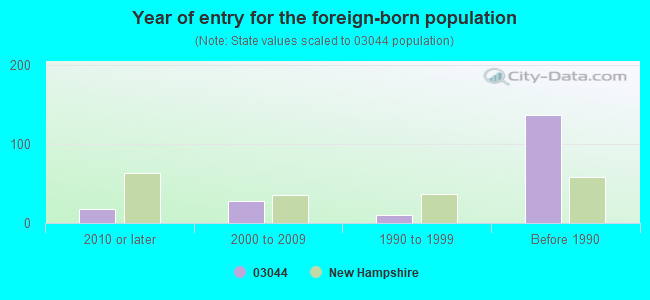
Year of entry for the foreign-born population
182010 or later
282000 to 2009
101990 to 1999
137Before 1990
Major facilities with environmental interests located in this zip code:
ESTATE OF ERNEST DOMINGS (35 MAIN ST in FREMONT, NH)
STATE MASTER (New Hampshire water, air, and waste tracking) - HAZARDOUS WASTE PROGRAM (Resource Conservation and Recovery Act (tracking hazardous waste))
ELLIS SCHOOL (432 MAIN ST in FREMONT, NH)
COMPLIANCE ACTIVITY (Tracking inspections of insecticide, fungicide, and rodenticide, and toxic substances) (National Center for Education Statistics) - STATE ID-71418918920525 Organizations: FREMONT SCHOOL DISTRICT (SCHOOL DISTRICT)
VILLAGE MARKET OF FREMONT (6 DANVILLE ROAD in FREMONT, NH)
(Resource Conservation and Recovery Act (tracking hazardous waste)) Organizations: STEPHEN GILLINGHAM (CONTACT/OWNER)
BEAULIEU RESIDENCE (5 RIVERSDIE DR in FREMONT, NH)
(Resource Conservation and Recovery Act (tracking hazardous waste))
C & E SERVICE CENTER (286 NORTH RD in FREMONT, NH)
(Resource Conservation and Recovery Act (tracking hazardous waste))
COMCAST (3 SQUIRE RD in FREMONT, NH)
(Resource Conservation and Recovery Act (tracking hazardous waste))
DEL & P AUTO SERVICE (431 SANDOWN RD in FREMONT, NH)
(Resource Conservation and Recovery Act (tracking hazardous waste))
EDS COLLISION CENTER (453 MAIN ST in FREMONT, NH)
(Resource Conservation and Recovery Act (tracking hazardous waste))
SAU 14 (432 MAIN ST in FREMONT, NH)
(Resource Conservation and Recovery Act (tracking hazardous waste))
SPAULDING & FROST CO INC (100 MAIN ST in FREMONT, NH)
(Resource Conservation and Recovery Act (tracking hazardous waste))
SPAULDING & FROST CO INC (326 MAIN STREET in FREMONT, NH)
AIR MINOR (AIRS/AFS) Business SIC classification: WOOD PRODUCTS
UNITED MACHINE & TOOL DESIGN (18 RIVER RD in FREMONT, NH)
(Resource Conservation and Recovery Act (tracking hazardous waste))
PROVIDER E N T THE (MAIN ST in FREMONT, NH)
(Resource Conservation and Recovery Act (tracking hazardous waste))
Housing units lacking complete plumbing facilities: 0.4% Housing units lacking complete kitchen facilities: 2.0%
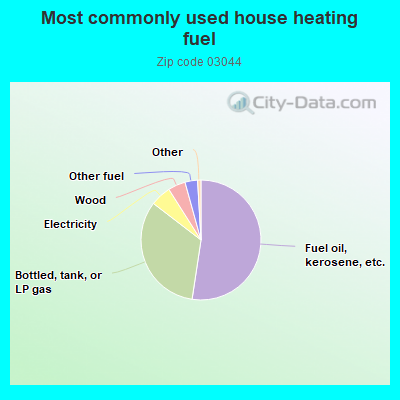
52.5%Fuel oil, kerosene, etc.
33.1%Bottled, tank, or LP gas
5.6%Electricity
4.7%Wood
3.4%Other fuel
Population in 1990: 2,677. Population change in the 1990s: +845 (+31.6%).
Place of birth for U.S.-born residents:
This state: 1,556
Northeast: 2,674
Midwest: 67
South: 152
West: 110
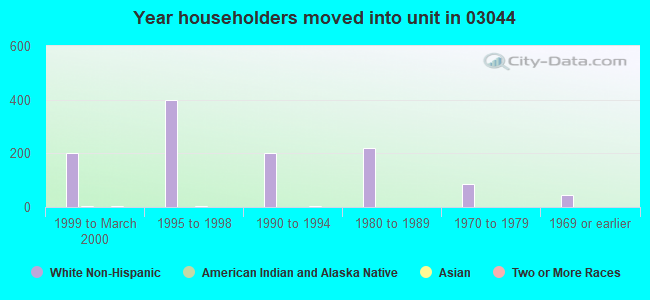
55% of the 03044 zip code residents lived in the same house 5 years ago. Out of people who lived in different houses, 62% lived in this county. Out of people who lived in different counties, 50% lived in New Hampshire.
97% of the 03044 zip code residents lived in the same house 1 year ago. Out of people who lived in different houses, 45% moved from this county. Out of people who lived in different houses, 82% moved from different state.
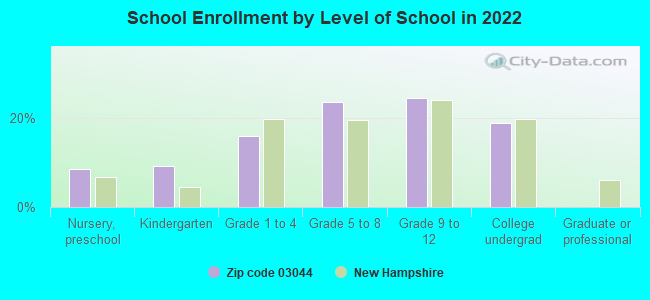
Private vs. public school enrollment:
Students in private schools in grades 1 to 8 (elementary and middle school): 11
Here:
3.0%
New Hampshire:
11.4%
Students in private schools in grades 9 to 12 (high school): 17
Here:
7.8%
New Hampshire:
14.0%
Students in private undergraduate colleges: 55
Here:
32.0%
New Hampshire:
38.0%
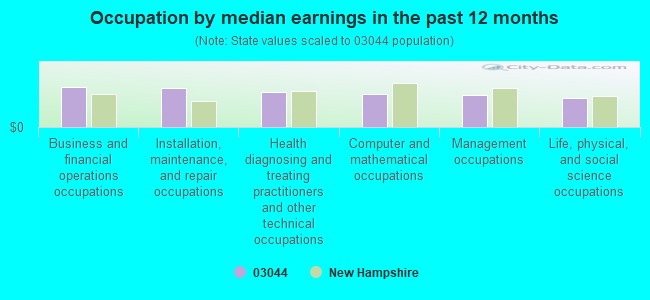
Occupation by median earnings in the past 12 months ($)
116,290Business and financial operations occupations
112,980Installation, maintenance, and repair occupations
101,622Health diagnosing and treating practitioners and other technical occupations
95,728Computer and mathematical occupations
92,088Management occupations
83,829Life, physical, and social science occupations
Companies with federal contracts located in this zip code:
UNITED MACHINE & TOOL DESIGN C (18 RIVER RD in FREMONT, NH; small business) : $89,094 in 4 contractsfrom 2003 to 2005
$35,400 with Defense Logistics Agency for Miscellaneous Electrical and Electronic Components. Signed on 2004-11-18. Completion date: 2005-03-18.
$35,400, same as above.Signed on 2003-12-22. Completion date: 2004-02-20.
$11,274 with Defense Logistics Agency for Indoor and Outdoor Electric Lighting Fixtures. Signed on 2005-11-29. Completion date: 2005-12-28.
$7,020 with Navy for Bushings, Rings, Shims, and Spacers. Signed on 2004-10-01. Completion date: 2004-10-29.
Top industries in this zip code by the number of employees in 2005:
Health Care and Social Assistance: Nursing Care Facilities (50-99 employees: 1 establishment)
Health Care and Social Assistance: Child Day Care Services (20-49: 1, 5-9: 1, 1-4: 2)
Professional, Scientific, and Technical Services: Veterinary Services (20-49: 1)
Construction: Painting and Wall Covering Contractors (10-19: 2)
Construction: Site Preparation Contractors (10-19: 1)
People in group quarters in 2010:
48 people in nursing facilities/skilled-nursing facilities
People in group quarters in 2000:
31 people in nursing homes
Fatal accident statistics in 2014:
Fatal accident count: 1
Vehicles involved in fatal accidents: 1
Fatal accidents caused by drunken drivers: 0
Fatalities: 1
Persons involved in fatal accidents: 1
Pedestrians involved in fatal accidents: 0
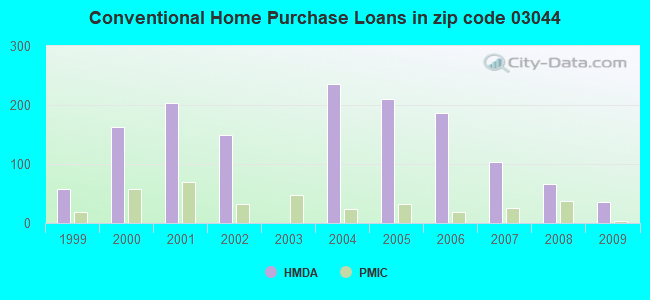
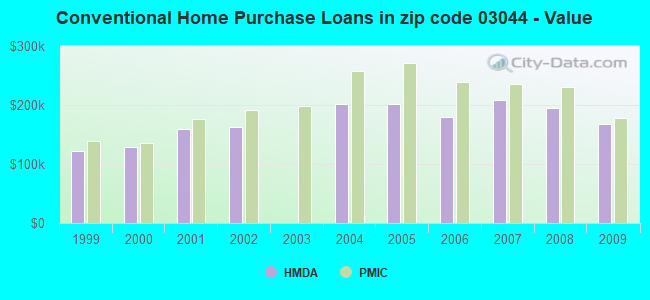
Home Mortgage Disclosure Act Aggregated Statistics For Year 2009 (Based on 2 full tracts)
A) FHA, FSA/RHS & VA Home Purchase Loans
B) Conventional Home Purchase Loans
C) Refinancings
D) Home Improvement Loans
F) Non-occupant Loans on < 5 Family Dwellings (A B C & D)
G) Loans On Manufactured Home Dwelling (A B C & D)
Number
Average Value
Number
Average Value
Number
Average Value
Number
Average Value
Number
Average Value
Number
Average Value
LOANS ORIGINATED
46
$230,261
36
$168,056
308
$192,422
12
$48,333
6
$173,667
6
$66,333
APPLICATIONS APPROVED, NOT ACCEPTED
2
$194,000
6
$162,000
28
$175,857
0
$0
0
$0
0
$0
APPLICATIONS DENIED
20
$199,900
6
$152,667
150
$225,960
8
$96,250
0
$0
2
$98,000
APPLICATIONS WITHDRAWN
6
$200,667
8
$179,000
38
$208,526
2
$150,000
4
$232,500
2
$98,000
FILES CLOSED FOR INCOMPLETENESS
2
$232,000
4
$132,500
20
$224,900
2
$165,000
2
$45,000
0
$0
Aggregated Statistics For Year 2008 (Based on 2 full tracts)
A) FHA, FSA/RHS & VA Home Purchase Loans
B) Conventional Home Purchase Loans
C) Refinancings
D) Home Improvement Loans
F) Non-occupant Loans on < 5 Family Dwellings (A B C & D)
G) Loans On Manufactured Home Dwelling (A B C & D)
Number
Average Value
Number
Average Value
Number
Average Value
Number
Average Value
Number
Average Value
Number
Average Value
LOANS ORIGINATED
22
$209,364
66
$195,667
144
$188,750
36
$63,778
20
$194,800
8
$66,250
APPLICATIONS APPROVED, NOT ACCEPTED
2
$128,000
6
$260,667
16
$195,875
4
$35,000
0
$0
2
$46,000
APPLICATIONS DENIED
8
$184,000
18
$225,667
108
$211,574
30
$79,267
4
$402,500
6
$103,333
APPLICATIONS WITHDRAWN
8
$178,500
4
$240,500
44
$232,136
0
$0
0
$0
0
$0
FILES CLOSED FOR INCOMPLETENESS
2
$265,000
0
$0
4
$184,500
0
$0
0
$0
0
$0
Aggregated Statistics For Year 2007 (Based on 2 full tracts)
A) FHA, FSA/RHS & VA Home Purchase Loans
B) Conventional Home Purchase Loans
C) Refinancings
D) Home Improvement Loans
F) Non-occupant Loans on < 5 Family Dwellings (A B C & D)
G) Loans On Manufactured Home Dwelling (A B C & D)
Number
Average Value
Number
Average Value
Number
Average Value
Number
Average Value
Number
Average Value
Number
Average Value
LOANS ORIGINATED
4
$330,000
104
$207,750
170
$182,000
62
$91,484
8
$206,750
2
$154,000
APPLICATIONS APPROVED, NOT ACCEPTED
0
$0
16
$221,250
34
$222,588
8
$115,250
0
$0
2
$153,000
APPLICATIONS DENIED
0
$0
24
$190,500
150
$203,613
42
$57,286
6
$135,333
4
$107,500
APPLICATIONS WITHDRAWN
0
$0
6
$264,000
78
$252,436
10
$68,800
0
$0
0
$0
FILES CLOSED FOR INCOMPLETENESS
0
$0
0
$0
24
$335,583
0
$0
0
$0
0
$0
Aggregated Statistics For Year 2006 (Based on 2 full tracts)
A) FHA, FSA/RHS & VA Home Purchase Loans
B) Conventional Home Purchase Loans
C) Refinancings
D) Home Improvement Loans
F) Non-occupant Loans on < 5 Family Dwellings (A B C & D)
G) Loans On Manufactured Home Dwelling (A B C & D)
Number
Average Value
Number
Average Value
Number
Average Value
Number
Average Value
Number
Average Value
Number
Average Value
LOANS ORIGINATED
4
$243,000
186
$179,312
272
$174,860
86
$70,093
10
$126,400
6
$103,333
APPLICATIONS APPROVED, NOT ACCEPTED
0
$0
20
$168,400
50
$201,520
8
$41,000
4
$70,000
0
$0
APPLICATIONS DENIED
0
$0
32
$173,188
192
$191,500
44
$49,136
4
$335,500
4
$64,500
APPLICATIONS WITHDRAWN
0
$0
20
$210,100
116
$173,086
2
$360,000
0
$0
0
$0
FILES CLOSED FOR INCOMPLETENESS
0
$0
8
$211,000
28
$208,143
2
$57,000
0
$0
0
$0
Aggregated Statistics For Year 2005 (Based on 2 full tracts)
A) FHA, FSA/RHS & VA Home Purchase Loans
B) Conventional Home Purchase Loans
C) Refinancings
D) Home Improvement Loans
F) Non-occupant Loans on < 5 Family Dwellings (A B C & D)
G) Loans On Manufactured Home Dwelling (A B C & D)
Number
Average Value
Number
Average Value
Number
Average Value
Number
Average Value
Number
Average Value
Number
Average Value
LOANS ORIGINATED
2
$272,000
210
$200,981
372
$171,737
70
$73,714
24
$182,917
18
$100,889
APPLICATIONS APPROVED, NOT ACCEPTED
0
$0
26
$175,000
44
$198,091
14
$65,571
4
$285,000
6
$67,000
APPLICATIONS DENIED
4
$259,000
42
$195,714
184
$188,120
56
$84,964
6
$113,667
6
$120,000
APPLICATIONS WITHDRAWN
0
$0
28
$173,000
128
$204,969
12
$106,667
2
$133,000
4
$122,500
FILES CLOSED FOR INCOMPLETENESS
0
$0
4
$326,000
58
$211,448
2
$181,000
0
$0
0
$0
Aggregated Statistics For Year 2004 (Based on 2 full tracts)
A) FHA, FSA/RHS & VA Home Purchase Loans
B) Conventional Home Purchase Loans
C) Refinancings
D) Home Improvement Loans
F) Non-occupant Loans on < 5 Family Dwellings (A B C & D)
G) Loans On Manufactured Home Dwelling (A B C & D)
Number
Average Value
Number
Average Value
Number
Average Value
Number
Average Value
Number
Average Value
Number
Average Value
LOANS ORIGINATED
2
$282,000
236
$201,822
396
$172,480
62
$94,226
10
$166,800
2
$135,000
APPLICATIONS APPROVED, NOT ACCEPTED
0
$0
34
$208,353
60
$171,300
16
$40,000
4
$203,000
2
$4,000
APPLICATIONS DENIED
2
$123,000
38
$164,000
138
$178,391
40
$63,050
8
$156,000
0
$0
APPLICATIONS WITHDRAWN
0
$0
14
$163,286
164
$165,720
18
$111,778
6
$163,333
0
$0
FILES CLOSED FOR INCOMPLETENESS
0
$0
6
$210,000
28
$188,929
8
$102,500
0
$0
0
$0
Aggregated Statistics For Year 2002 (Based on 2 full tracts)
A) FHA, FSA/RHS & VA Home Purchase Loans
B) Conventional Home Purchase Loans
C) Refinancings
D) Home Improvement Loans
F) Non-occupant Loans on < 5 Family Dwellings (A B C & D)
Number
Average Value
Number
Average Value
Number
Average Value
Number
Average Value
Number
Average Value
LOANS ORIGINATED
16
$178,250
150
$163,107
512
$142,152
36
$34,722
12
$113,333
APPLICATIONS APPROVED, NOT ACCEPTED
0
$0
26
$148,462
84
$140,357
20
$23,800
2
$261,000
APPLICATIONS DENIED
2
$177,000
8
$143,000
132
$131,530
32
$28,125
2
$202,000
APPLICATIONS WITHDRAWN
0
$0
12
$125,833
68
$162,500
18
$46,667
0
$0
FILES CLOSED FOR INCOMPLETENESS
0
$0
2
$10,000
36
$146,722
0
$0
2
$10,000
Aggregated Statistics For Year 2001 (Based on 2 full tracts)
A) FHA, FSA/RHS & VA Home Purchase Loans
B) Conventional Home Purchase Loans
C) Refinancings
D) Home Improvement Loans
E) Loans on Dwellings For 5+ Families
F) Non-occupant Loans on < 5 Family Dwellings (A B C & D)
Number
Average Value
Number
Average Value
Number
Average Value
Number
Average Value
Number
Average Value
Number
Average Value
LOANS ORIGINATED
24
$166,667
204
$158,529
462
$122,528
48
$30,333
2
$100,000
6
$130,667
APPLICATIONS APPROVED, NOT ACCEPTED
0
$0
26
$152,462
46
$98,826
18
$35,556
0
$0
2
$63,000
APPLICATIONS DENIED
2
$147,000
22
$101,636
134
$111,642
34
$29,471
0
$0
0
$0
APPLICATIONS WITHDRAWN
2
$113,000
8
$45,250
100
$127,160
16
$49,125
0
$0
2
$66,000
FILES CLOSED FOR INCOMPLETENESS
0
$0
2
$186,000
16
$116,500
0
$0
0
$0
0
$0
Aggregated Statistics For Year 2000 (Based on 2 full tracts)
A) FHA, FSA/RHS & VA Home Purchase Loans
B) Conventional Home Purchase Loans
C) Refinancings
D) Home Improvement Loans
F) Non-occupant Loans on < 5 Family Dwellings (A B C & D)
Number
Average Value
Number
Average Value
Number
Average Value
Number
Average Value
Number
Average Value
LOANS ORIGINATED
34
$155,000
162
$129,654
118
$113,695
44
$30,000
2
$83,000
APPLICATIONS APPROVED, NOT ACCEPTED
2
$113,000
20
$133,300
14
$58,571
18
$25,000
0
$0
APPLICATIONS DENIED
4
$135,000
42
$101,857
48
$70,375
26
$42,231
2
$30,000
APPLICATIONS WITHDRAWN
6
$131,667
14
$132,143
36
$87,056
4
$14,000
0
$0
FILES CLOSED FOR INCOMPLETENESS
0
$0
0
$0
8
$117,750
2
$190,000
0
$0
Aggregated Statistics For Year 1999 (Based on 1 full tract)
A) FHA, FSA/RHS & VA Home Purchase Loans
B) Conventional Home Purchase Loans
C) Refinancings
D) Home Improvement Loans
F) Non-occupant Loans on < 5 Family Dwellings (A B C & D)
Detailed PMIC statistics for the following Tracts:0540.00
2002 - 2018 National Fire Incident Reporting System (NFIRS) incidents
Based on the data from the years 2002 - 2018 the average number of fire incidents per year is 21. The highest number of fire incidents - 45 took place in 2010, and the least - 3 in 2004. The data has a declining trend.
When looking into fire subcategories, the most incidents belonged to: Structure Fires (55.0%), and Outside Fires (33.4%).
Fire incident types reported to NFIRS in Zip Code 03044


 Nearest zip codes: 03042, 03819, 03873, 03077, 03848, 03826.


 Based on the data from the years 2002 - 2018 the average number of fire incidents per year is 21. The highest number of fire incidents - 45 took place in 2010, and the least - 3 in 2004. The data has a declining trend.
 When looking into fire subcategories, the most incidents belonged to: Structure Fires (55.0%), and Outside Fires (33.4%).