Estimated zip code population in 2022: 3,547 Zip code population in 2010: 3,146 Zip code population in 2000: 2,786
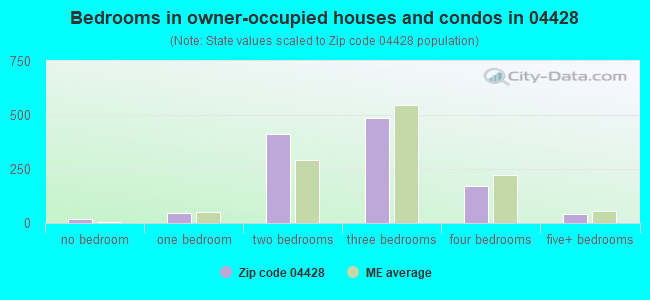
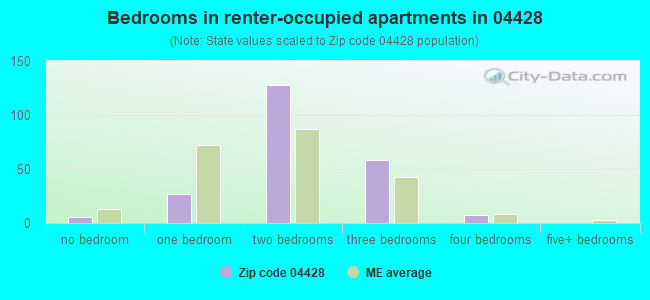
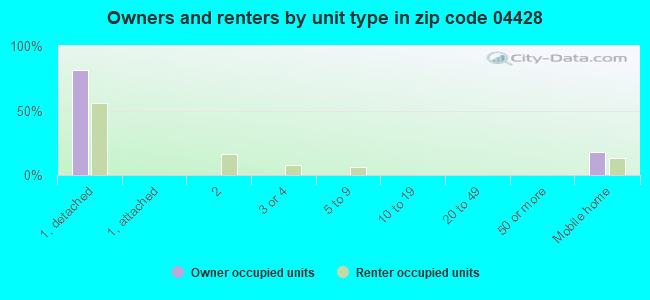
Houses and condos: 1,622 Renter-occupied apartments: 226
% of renters here:
16%
State:
26%
March 2022 cost of living index in zip code 04428: 87.3 (less than average, U.S. average is 100)
Land area: 59.5 sq. mi. Water area: 2.9 sq. mi.
Population density: 60 people per square mile
(very low).
OSM Map
Google Map
MSN Map
OSM Map
General Map
Google Map
MSN Map
OSM Map
Google Map
MSN Map
OSM Map
Google Map
MSN Map
Please wait while loading the map...
Real estate property taxes paid for housing units in 2022:
This zip code:
0.9% ($2,072)
Maine:
1.0% ($2,785)
Median real estate property taxes paid for housing units with mortgages in 2022: $1,986 (0.8%) Median real estate property taxes paid for housing units with no mortgage in 2022: $2,196 (1.1%)
Business Search- 14 Million verified businesses
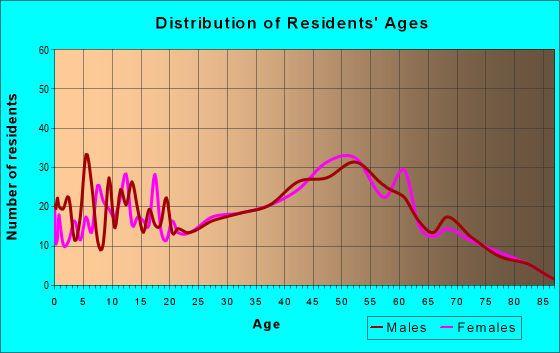
Males: 1,858
(52.4%)
Females: 1,689
(47.6%)
For population 25 years and over in 04428:
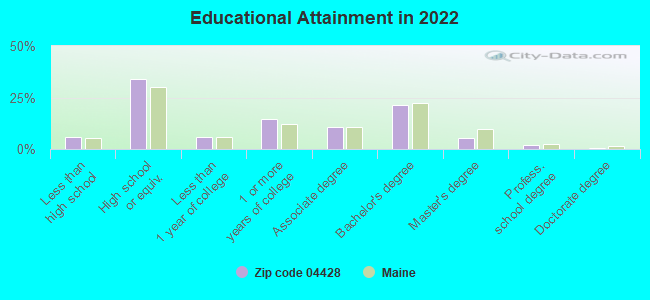
High school or higher: 92.6%
Bachelor's degree or higher: 28.4%
Graduate or professional degree: 7.5%
Unemployed: 2.5%
Mean travel time to work (commute): 29.0 minutes
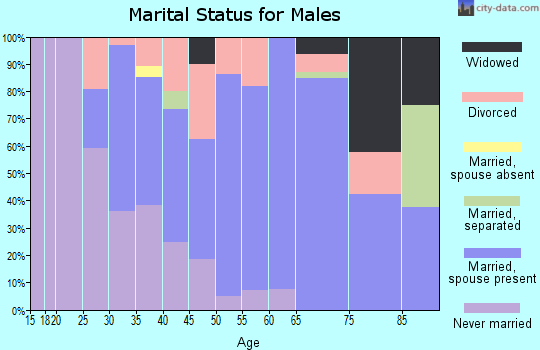
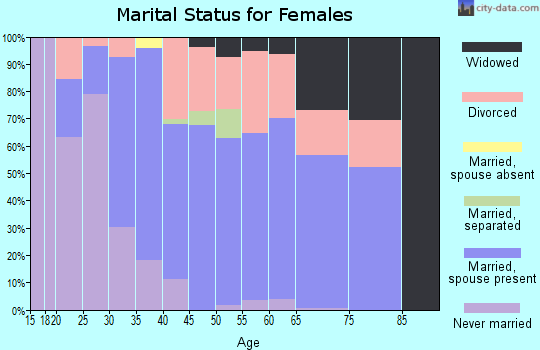
For population 15 years and over in 04428:
Never married: 28.1%
Now married: 54.5%
Separated: 0.3%
Widowed: 6.4%
Divorced: 10.7%
Zip code 04428 compared to state average:
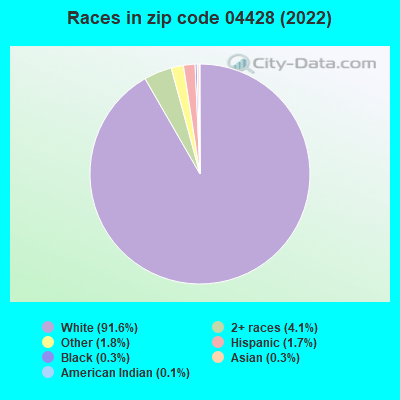
Black race population percentage significantly below state average.
Foreign-born population percentage below state average.
Renting percentage below state average.
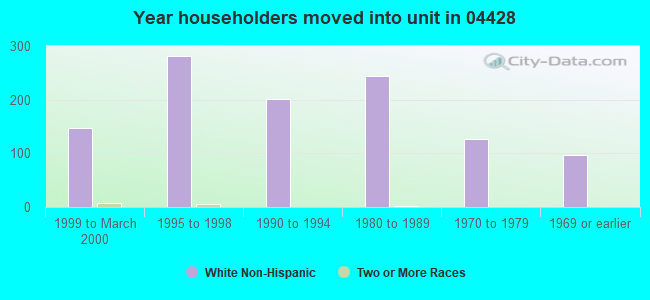
Length of stay since moving in significantly above state average.
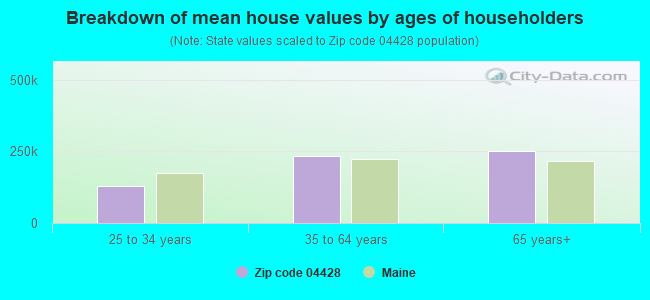
Estimated median house/condo value in 2022: $228,159
04428:
$228,159
Maine:
$290,600
According to our research of Maine and other state lists, there were 5 registered sex offenders living in 04428 zip code as of April 19, 2024. The ratio of all residents to sex offenders in zip code 04428 is 601 to 1. The ratio of registered sex offenders to all residents in this zip code is near the state average.
Median resident age:
This zip code:
48.8 years
Maine median age:
45.1 years
Average household size:
This zip code:
2.5 people
Maine:
2.2 people
Averages for the 2020 tax year for zip code 04428, filed in 2021:
Average Adjusted Gross Income (AGI) in 2020: $61,278 (Individual Income Tax Returns)
Here:
$61,278
State:
$68,227
Salary/wage: $49,813 (reported on 83.6% of returns)
Here:
$49,813
State:
$55,127
(% of AGI for various income ranges: 1216.8% for AGIs below $25k, 3747.7% for AGIs $25k-50k, 6040.0% for AGIs $50k-75k, 9142.3% for AGIs $75k-100k, 15180.8% for AGIs $100k-200k)
Taxable interest for individuals: $406 (reported on 32.9% of returns)
This zip code:
$406
Maine:
$1,162
(% of AGI for various income ranges: 8.4% for AGIs below $25k, 7.4% for AGIs $25k-50k, 23.5% for AGIs $50k-75k, 21.5% for AGIs $75k-100k, 50.8% for AGIs $100k-200k)
Ordinary dividends: $3,910 (reported on 13.8% of returns)
Here:
$3,910
State:
$7,695
(% of AGI for various income ranges: 10.6% for AGIs below $25k, 18.3% for AGIs $25k-50k, 61.8% for AGIs $50k-75k, 86.2% for AGIs $75k-100k, 422.5% for AGIs $100k-200k)
Net capital gain/loss in AGI: +$19,865 (reported on 13.2% of returns)
Here:
+$19,865
State:
+$22,201
(% of AGI for various income ranges: 8.4% for AGIs below $25k, 24.0% for AGIs $25k-50k, 116.5% for AGIs $50k-75k, 168.5% for AGIs $75k-100k, 260.8% for AGIs $100k-200k)
Profit/loss from business: +$8,000 (reported on 13.8% of returns)
Here:
+$8,000
State:
+$15,095
(% of AGI for various income ranges: 98.4% for AGIs below $25k, 119.1% for AGIs $25k-50k, 253.5% for AGIs $50k-75k, 140.0% for AGIs $75k-100k, 287.5% for AGIs $100k-200k)
Taxable individual retirement arrangement distribution: $14,100 (reported on 8.6% of returns)
04428:
$14,100
Maine:
$18,314
(% of AGI for various income ranges: 79.4% for AGIs below $25k, 119.7% for AGIs $25k-50k, 216.9% for AGIs $75k-100k, 738.3% for AGIs $100k-200k)
Total itemized deductions: $23,800 (reported on 3.9% of returns)
Here:
$23,800
State:
$31,197
(% of AGI for various income ranges: 281.2% for AGIs $50k-75k, 791.7% for AGIs $100k-200k)
Charity contributions: $5,675 (reported on 2.6% of returns)
Here:
$5,675
State:
$9,863
(% of AGI for various income ranges: 189.2% for AGIs $100k-200k)
Taxes paid: $8,167 (reported on 3.9% of returns)
04428:
$8,167
State:
$8,241
(% of AGI for various income ranges: 102.9% for AGIs $50k-75k, 262.5% for AGIs $100k-200k)
Earned income credit: $2,215 (reported on 13.2% of returns)
Here:
$2,215
State:
$1,960
(% of AGI for various income ranges: 75.5% for AGIs below $25k, 59.7% for AGIs $25k-50k)
Percentage of individuals using paid preparers for their 2020 taxes: 94.1%
Here:
94%
State:
92%
(% for various income ranges: 93.2% for AGIs below $25k, 95.6% for AGIs $25k-50k, 95.7% for AGIs $50k-75k, 94.4% for AGIs $75k-100k, 94.4% for AGIs $100k-200k, 75.0% for AGIs over 200k)
Averages for the 2012 tax year for zip code 04428, filed in 2013:
Average Adjusted Gross Income (AGI) in 2012: $47,170 (Individual Income Tax Returns)
Here:
$47,170
State:
$52,375
Salary/wage: $41,370 (reported on 87.3% of returns)
Here:
$41,370
State:
$43,415
(% of AGI for various income ranges: 79.0% for AGIs below $25k, 84.1% for AGIs $25k-50k, 79.8% for AGIs $50k-75k, 81.1% for AGIs $75k-100k, 66.3% for AGIs $100k-200k)
Taxable interest for individuals: $505 (reported on 28.9% of returns)
This zip code:
$505
Maine:
$1,221
(% of AGI for various income ranges: 0.9% for AGIs below $25k, 0.3% for AGIs $25k-50k, 0.2% for AGIs $50k-75k, 0.2% for AGIs $75k-100k, 0.3% for AGIs $100k-200k)
Ordinary dividends: $1,259 (reported on 15.5% of returns)
Here:
$1,259
State:
$5,812
(% of AGI for various income ranges: 0.5% for AGIs below $25k, 0.5% for AGIs $25k-50k, 0.4% for AGIs $50k-75k, 0.3% for AGIs $75k-100k, 0.4% for AGIs $100k-200k)
Net capital gain/loss in AGI: +$1,607 (reported on 9.9% of returns)
Here:
+$1,607
State:
+$11,897
(% of AGI for various income ranges: 0.2% for AGIs $25k-50k, 0.6% for AGIs $50k-75k, 0.6% for AGIs $100k-200k)
Profit/loss from business: +$5,573 (reported on 15.5% of returns)
Here:
+$5,573
State:
+$12,144
(% of AGI for various income ranges: 3.0% for AGIs below $25k, 1.6% for AGIs $25k-50k, 2.3% for AGIs $50k-75k, 0.5% for AGIs $75k-100k, 1.9% for AGIs $100k-200k)
Taxable individual retirement arrangement distribution: $12,136 (reported on 7.7% of returns)
04428:
$12,136
Maine:
$13,385
(% of AGI for various income ranges: 3.2% for AGIs below $25k, 1.6% for AGIs $25k-50k, 3.9% for AGIs $50k-75k, 1.6% for AGIs $100k-200k)
Total itemized deductions: $17,903 (20% of AGI, reported on 27.5% of returns)
Here:
$17,903
State:
$21,859
Here:
19.9% of AGI
State:
20.9% of AGI
(% of AGI for various income ranges: 4.7% for AGIs below $25k, 8.2% for AGIs $25k-50k, 10.5% for AGIs $50k-75k, 10.8% for AGIs $75k-100k, 13.5% for AGIs $100k-200k)
Charity contributions: $1,986 (reported on 19.7% of returns)
Here:
$1,986
State:
$2,741
(% of AGI for various income ranges: 0.5% for AGIs $25k-50k, 1.1% for AGIs $50k-75k, 0.7% for AGIs $75k-100k, 1.2% for AGIs $100k-200k)
Taxes paid: $7,997 (reported on 27.5% of returns)
04428:
$7,997
State:
$9,996
(% of AGI for various income ranges: 1.5% for AGIs below $25k, 2.5% for AGIs $25k-50k, 3.8% for AGIs $50k-75k, 4.9% for AGIs $75k-100k, 7.5% for AGIs $100k-200k)
Earned income credit: $1,942 (reported on 18.3% of returns)
Here:
$1,942
State:
$1,959
(% of AGI for various income ranges: 5.2% for AGIs below $25k, 1.0% for AGIs $25k-50k)
Percentage of individuals using paid preparers for their 2012 taxes: 49.3%
Here:
49%
State:
48%
(% for various income ranges: 38.9% for AGIs below $25k, 48.7% for AGIs $25k-50k, 56.5% for AGIs $50k-75k, 61.5% for AGIs $75k-100k, 69.2% for AGIs $100k-200k)
Averages for the 2004 tax year for zip code 04428, filed in 2005:
Average Adjusted Gross Income (AGI) in 2004: $36,310 (Individual Income Tax Returns)
Here:
$36,310
State:
$42,606
Salary/wage: $33,515 (reported on 87.8% of returns)
Here:
$33,515
State:
$36,376
(% of AGI for various income ranges: 97.8% for AGIs below $10k, 80.0% for AGIs $10k-25k, 83.3% for AGIs $25k-50k, 86.9% for AGIs $50k-75k, 84.5% for AGIs $75k-100k, 61.4% for AGIs over 100k)
Taxable interest for individuals: $677 (reported on 41.4% of returns)
This zip code:
$677
Maine:
$1,367
(% of AGI for various income ranges: 3.8% for AGIs below $10k, 1.5% for AGIs $10k-25k, 0.9% for AGIs $25k-50k, 0.3% for AGIs $50k-75k, 0.5% for AGIs $75k-100k, 0.7% for AGIs over 100k)
Taxable dividends: $1,325 (reported on 17.7% of returns)
Here:
$1,325
State:
$3,533
(% of AGI for various income ranges: 1.8% for AGIs below $10k, 0.9% for AGIs $10k-25k, 0.4% for AGIs $25k-50k, 0.4% for AGIs $50k-75k, 0.4% for AGIs $75k-100k, 1.4% for AGIs over 100k)
Net capital gain/loss: +$4,660 (reported on 13.7% of returns)
Here:
+$4,660
State:
+$11,433
(% of AGI for various income ranges: -1.6% for AGIs below $10k, 0.1% for AGIs $10k-25k, 1.3% for AGIs $25k-50k, 1.6% for AGIs $50k-75k, 3.3% for AGIs $75k-100k, 3.2% for AGIs over 100k)
Profit/loss from business: +$5,143 (reported on 17.1% of returns)
Here:
+$5,143
State:
+$10,755
(% of AGI for various income ranges: 5.3% for AGIs below $10k, 3.1% for AGIs $10k-25k, 3.1% for AGIs $25k-50k, 0.9% for AGIs $50k-75k, 0.5% for AGIs $75k-100k, 4.7% for AGIs over 100k)
IRA payment deduction: $3,137 (reported on 3.7% of returns)
04428:
$3,137
Maine:
$3,014
Total itemized deductions: $14,937 (23% of AGI, reported on 27.3% of returns)
Here:
$14,937
State:
$18,231
Here:
23.0% of AGI
State:
21.7% of AGI
(% of AGI for various income ranges: 8.7% for AGIs $10k-25k, 8.5% for AGIs $25k-50k, 12.2% for AGIs $50k-75k, 13.8% for AGIs $75k-100k, 15.3% for AGIs over 100k)
Charity contributions deductions: $1,719 (2% of AGI, reported on 21.2% of returns)
Here:
$1,719
State:
$2,466
Here:
2.5% of AGI
State:
2.8% of AGI
(% of AGI for various income ranges: 0.4% for AGIs $10k-25k, 0.6% for AGIs $25k-50k, 0.9% for AGIs $50k-75k, 1.2% for AGIs $75k-100k, 2.4% for AGIs over 100k)
Total tax: $4,127 (reported on 76.8% of returns)
04428:
$4,127
State:
$6,047
(% of AGI for various income ranges: 2.9% for AGIs below $10k, 4.2% for AGIs $10k-25k, 6.7% for AGIs $25k-50k, 8.2% for AGIs $50k-75k, 10.8% for AGIs $75k-100k, 16.0% for AGIs over 100k)
Earned income credit: $1,534 (reported on 15.0% of returns)
Here:
$1,534
State:
$1,520
Percentage of individuals using paid preparers for their 2004 taxes: 51.4%
Here:
51%
State:
53%
(% for various income ranges: 38.6% for AGIs below $10k, 46.6% for AGIs $10k-25k, 58.6% for AGIs $25k-50k, 54.7% for AGIs $50k-75k, 57.8% for AGIs $75k-100k, 70.4% for AGIs over 100k)
Household received Food Stamps/SNAP in the past 12 months: 163 Household did not receive Food Stamps/SNAP in the past 12 months: 1,225
Women who had a birth in the past 12 months: 27 (20 now married, 6 unmarried) Women who did not have a birth in the past 12 months: 618 (219 now married, 398 unmarried)
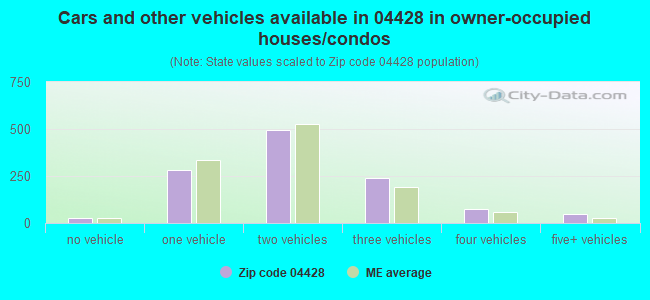
Housing units in zip code 04428 with a mortgage: 629 (53 second mortgage, 50 both second mortgage and home equity loan) Houses without a mortgage: 31
Median monthly owner costs for units with a mortgage: $1,354 Median monthly owner costs for units without a mortgage: $515
Residents with income below the poverty level in 2022:
This zip code:
7.7%
Whole state:
10.8%
Residents with income below 50% of the poverty level in 2022:
This zip code:
3.3%
Whole state:
5.8%
Median number of rooms in houses and condos:
Here:
5.7
State:
6.1
Median number of rooms in apartments:
Here:
4.2
State:
4.0
Notable locations in this zip code not listed on our city pages
Notable locations in zip code 04428: Clifton Corners (A), Parks Pond Campground (B), Roosevelt Boy Scout Camp (C), Eddington Fire Department (D). Display/hide their locations on the map
Churches in zip code 04428 include: East Eddington Community Church (A), North Brewer-Eddington Methodist Church (B). Display/hide their locations on the map
Cemeteries: North Eddington Cemetery (1), Mount Pleasant Cemetery (2), Meadowbrook Cemetery (3), Pine Tree Cemetery (4). Display/hide their locations on the map
Lakes and swamps: Upper Springy Pond (A), Cedar Swamp Pond (B), Chemo Pond (C), Cranberry Pond (D), Davis Pond (E), Fitts Pond (F), Holbrook Pond (G), Hopkins Pond (H). Display/hide their locations on the map
Streams, rivers, and creeks: Goodwin Brook (A), Sibley Brook (B), Intervale Brook (C), Parks Pond Brook (D), Kidder Brook (E), Meadow Brook (F), Mill Brook (G), Bradbury Brook (H). Display/hide their locations on the map
In group quarters: 23 (-1 institutionalized population)
Size of family households: 501 2-persons, 190 3-persons, 189 4-persons, 52 5-persons, 7 6-persons, 28 7-or-more-persons
Size of nonfamily households: 293 1-person, 131 2-persons, 1 3-persons
365 married couples with children.
139 single-parent households (112 men, 27 women).
96.3% of residents of 04428 zip code speak English at home.
1.2% of residents speak Spanish at home (73% very well, 27% well).
2.0% of residents speak other Indo-European language at home (100% very well).
0.6% of residents speak Asian or Pacific Island language at home (26% not well, 74% not at all).
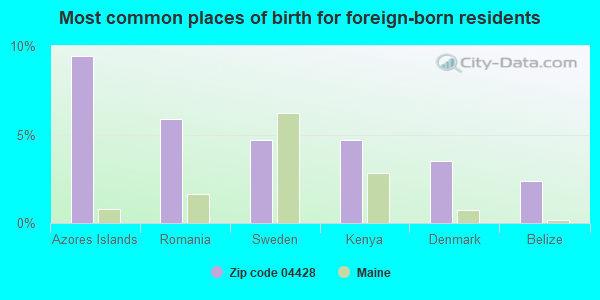
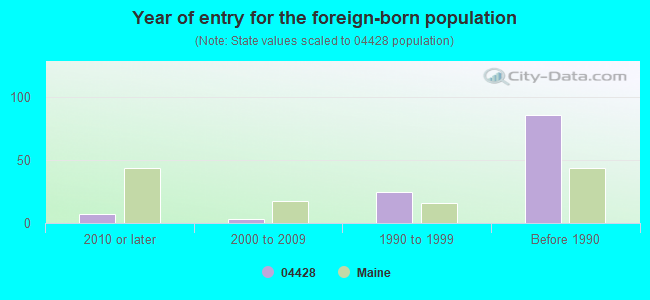
Foreign born population: 92 (2.6%) (80.7% of them are naturalized citizens)
This zip code:
2.6%
Whole state:
4.1%
9%Azores Islands
6%Romania
5%Sweden
5%Kenya
4%Denmark
2%Belize
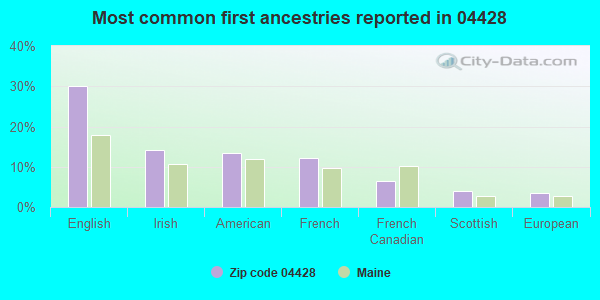
30%English
14%Irish
13%American
12%French
6%French Canadian
4%Scottish
3%European
Year of entry for the foreign-born population
72010 or later
32000 to 2009
251990 to 1999
86Before 1990
Facilities with environmental interests located in this zip code:
EDDINGTON SCHOOL (440 MAIN ROAD in EDDINGTON, ME)
(Geographic Names Information System) (National Center for Education Statistics) - STATE ID-13901 Organizations: MSAD 63 HOLDEN (SCHOOL DISTRICT)
NEW ENGLAND TELE CO (BLACK CAP MOUNTAIN in EDDINGTON, ME)
(Resource Conservation and Recovery Act (tracking hazardous waste)) Organizations: NEW ENGLAND TELEPHONE CO BOSTON MASS (CONTACT/OWNER)
Housing units lacking complete plumbing facilities: 3.2% Housing units lacking complete kitchen facilities: 2.5%
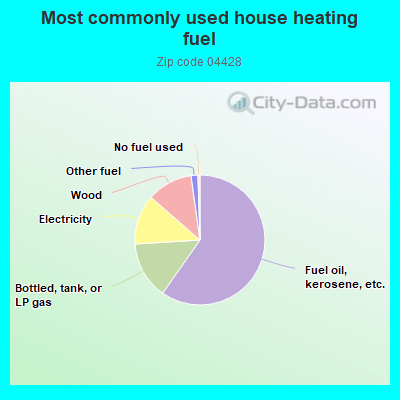
59.8%Fuel oil, kerosene, etc.
14.3%Bottled, tank, or LP gas
12.4%Electricity
11.4%Wood
1.7%Other fuel
0.5%No fuel used
Population in 1990: 2,263. Population change in the 1990s: +523 (+23.1%).
Place of birth for U.S.-born residents:
This state: 2,486
Northeast: 555
Midwest: 29
South: 204
West: 99
63% of the 04428 zip code residents lived in the same house 5 years ago. Out of people who lived in different houses, 72% lived in this county. Out of people who lived in different counties, 50% lived in Maine.
97% of the 04428 zip code residents lived in the same house 1 year ago. Out of people who lived in different houses, 53% moved from this county. Out of people who lived in different houses, 20% moved from different county within same state. Out of people who lived in different houses, 54% moved from different state.
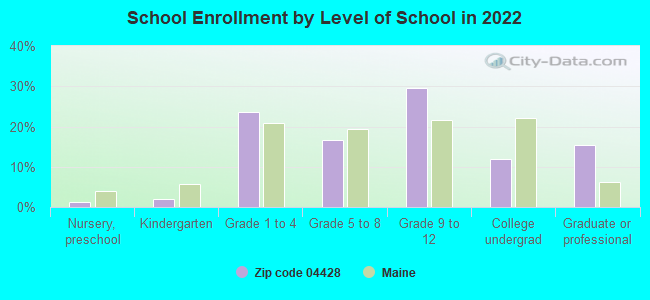
Private vs. public school enrollment:
Students in private schools in grades 1 to 8 (elementary and middle school): 32
Here:
12.8%
Maine:
12.7%
Students in private schools in grades 9 to 12 (high school): 70
Here:
37.4%
Maine:
12.6%
Students in private undergraduate colleges: 12
Here:
17.0%
Maine:
34.5%
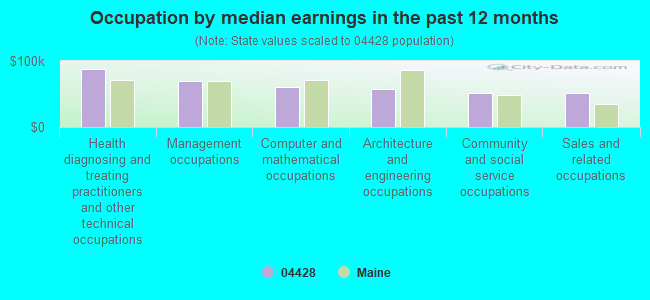
Occupation by median earnings in the past 12 months ($)
87,568Health diagnosing and treating practitioners and other technical occupations
70,042Management occupations
61,197Computer and mathematical occupations
58,057Architecture and engineering occupations
52,070Community and social service occupations
50,767Sales and related occupations
Companies with federal contracts located in this zip code:
MC RAE, GORDON (BRADLEY RD in EDDINGTON, ME; small business)
$22,107 with Army for Maintenance, Repair or Alteration of Real Property -- Other Airfield Structures. Signed on 2005-06-06. Completion date: 2005-08-03.
Top industries in this zip code by the number of employees in 2005:
Health Care and Social Assistance: Residential Mental Retardation Facilities (20-49 employees: 3 establishments, 1-4 employees: 3 establishments)
Health Care and Social Assistance: Home Health Care Services (10-19: 1)
Health Care and Social Assistance: Child and Youth Services (5-9: 1)
Administrative and Support and Waste Management and Remediation Services: Landscaping Services (5-9: 1)
Construction: Electrical Contractors (5-9: 1)
Health Care and Social Assistance: Services for the Elderly and Persons with Disabilities (5-9: 1)
People in group quarters in 2010:
20 people in group homes intended for adults
5 people in residential treatment centers for adults
People in group quarters in 2000:
12 people in homes for the mentally retarded
7 people in training schools for juvenile delinquents
6 people in homes or halfway houses for drug/alcohol abuse
Fatal accident statistics in 2014:
Fatal accident count: 1
Vehicles involved in fatal accidents: 2
Fatal accidents caused by drunken drivers: 0
Fatalities: 1
Persons involved in fatal accidents: 2
Pedestrians involved in fatal accidents: 0
Fatal accident statistics in 2013:
Fatal accident count: 1
Vehicles involved in fatal accidents: 2
Fatal accidents caused by drunken drivers: 0
Fatalities: 1
Persons involved in fatal accidents: 3
Pedestrians involved in fatal accidents: 0
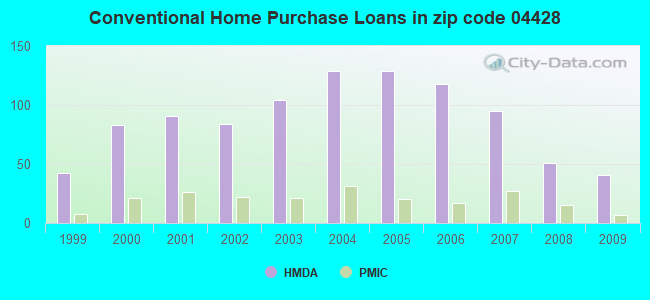
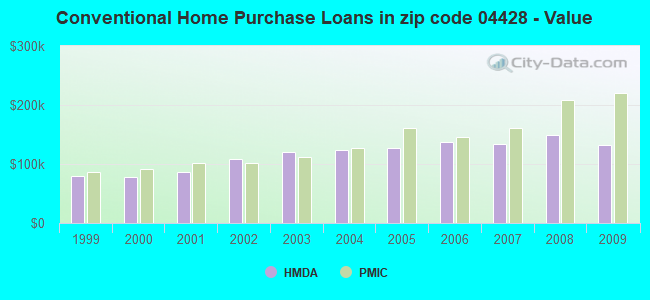
Home Mortgage Disclosure Act Aggregated Statistics For Year 2009 (Based on 2 partial tracts)
A) FHA, FSA/RHS & VA Home Purchase Loans
B) Conventional Home Purchase Loans
C) Refinancings
D) Home Improvement Loans
F) Non-occupant Loans on < 5 Family Dwellings (A B C & D)
G) Loans On Manufactured Home Dwelling (A B C & D)
Number
Average Value
Number
Average Value
Number
Average Value
Number
Average Value
Number
Average Value
Number
Average Value
LOANS ORIGINATED
27
$149,027
41
$132,297
205
$143,043
31
$58,465
12
$111,376
18
$56,231
APPLICATIONS APPROVED, NOT ACCEPTED
2
$251,560
0
$0
9
$155,341
4
$23,675
0
$0
2
$72,805
APPLICATIONS DENIED
5
$112,698
11
$99,762
70
$151,898
8
$35,958
13
$118,289
11
$54,885
APPLICATIONS WITHDRAWN
4
$115,718
4
$95,000
41
$148,928
2
$156,855
0
$0
2
$69,250
FILES CLOSED FOR INCOMPLETENESS
0
$0
1
$208,350
11
$191,991
0
$0
1
$208,350
0
$0
Aggregated Statistics For Year 2008 (Based on 2 partial tracts)
A) FHA, FSA/RHS & VA Home Purchase Loans
B) Conventional Home Purchase Loans
C) Refinancings
D) Home Improvement Loans
F) Non-occupant Loans on < 5 Family Dwellings (A B C & D)
G) Loans On Manufactured Home Dwelling (A B C & D)
Number
Average Value
Number
Average Value
Number
Average Value
Number
Average Value
Number
Average Value
Number
Average Value
LOANS ORIGINATED
27
$137,189
51
$149,043
142
$119,781
41
$60,547
14
$96,818
17
$51,182
APPLICATIONS APPROVED, NOT ACCEPTED
0
$0
2
$124,300
17
$119,216
1
$106,540
0
$0
1
$130,220
APPLICATIONS DENIED
5
$144,424
12
$79,907
51
$164,339
14
$32,047
6
$172,440
5
$37,644
APPLICATIONS WITHDRAWN
0
$0
5
$180,648
26
$153,575
4
$108,612
5
$95,414
5
$79,314
FILES CLOSED FOR INCOMPLETENESS
0
$0
0
$0
2
$131,995
0
$0
0
$0
0
$0
Aggregated Statistics For Year 2007 (Based on 2 partial tracts)
A) FHA, FSA/RHS & VA Home Purchase Loans
B) Conventional Home Purchase Loans
C) Refinancings
D) Home Improvement Loans
F) Non-occupant Loans on < 5 Family Dwellings (A B C & D)
G) Loans On Manufactured Home Dwelling (A B C & D)
Number
Average Value
Number
Average Value
Number
Average Value
Number
Average Value
Number
Average Value
Number
Average Value
LOANS ORIGINATED
6
$122,128
95
$134,243
170
$107,287
46
$40,378
18
$97,861
33
$48,536
APPLICATIONS APPROVED, NOT ACCEPTED
1
$145,610
7
$140,534
24
$177,768
7
$86,587
1
$207,160
1
$159,810
APPLICATIONS DENIED
0
$0
17
$112,531
97
$146,925
11
$32,501
7
$89,800
15
$47,510
APPLICATIONS WITHDRAWN
0
$0
4
$118,972
26
$136,000
4
$46,760
4
$137,320
1
$130,220
FILES CLOSED FOR INCOMPLETENESS
0
$0
1
$114,830
13
$174,292
0
$0
0
$0
1
$183,490
Aggregated Statistics For Year 2006 (Based on 2 partial tracts)
A) FHA, FSA/RHS & VA Home Purchase Loans
B) Conventional Home Purchase Loans
C) Refinancings
D) Home Improvement Loans
F) Non-occupant Loans on < 5 Family Dwellings (A B C & D)
G) Loans On Manufactured Home Dwelling (A B C & D)
Number
Average Value
Number
Average Value
Number
Average Value
Number
Average Value
Number
Average Value
Number
Average Value
LOANS ORIGINATED
17
$130,914
118
$136,970
206
$111,679
51
$55,755
21
$150,173
38
$53,832
APPLICATIONS APPROVED, NOT ACCEPTED
1
$157,450
13
$103,810
20
$105,418
7
$34,161
0
$0
5
$90,916
APPLICATIONS DENIED
1
$136,140
19
$80,000
98
$131,498
20
$39,716
2
$76,945
25
$63,499
APPLICATIONS WITHDRAWN
0
$0
5
$99,912
53
$142,704
12
$60,768
0
$0
1
$17,760
FILES CLOSED FOR INCOMPLETENESS
0
$0
1
$88,780
24
$143,930
4
$31,075
0
$0
0
$0
Aggregated Statistics For Year 2005 (Based on 2 partial tracts)
A) FHA, FSA/RHS & VA Home Purchase Loans
B) Conventional Home Purchase Loans
C) Refinancings
D) Home Improvement Loans
F) Non-occupant Loans on < 5 Family Dwellings (A B C & D)
G) Loans On Manufactured Home Dwelling (A B C & D)
Number
Average Value
Number
Average Value
Number
Average Value
Number
Average Value
Number
Average Value
Number
Average Value
LOANS ORIGINATED
14
$138,759
129
$126,300
201
$134,871
54
$63,268
20
$130,751
30
$50,035
APPLICATIONS APPROVED, NOT ACCEPTED
0
$0
14
$140,111
24
$116,703
7
$60,711
1
$369,350
1
$47,350
APPLICATIONS DENIED
1
$132,590
45
$167,047
114
$138,338
34
$57,101
11
$282,283
20
$54,159
APPLICATIONS WITHDRAWN
2
$107,725
18
$132,323
94
$122,800
7
$130,556
4
$97,960
6
$121,340
FILES CLOSED FOR INCOMPLETENESS
0
$0
2
$163,365
15
$122,642
1
$33,150
1
$146,790
0
$0
Aggregated Statistics For Year 2004 (Based on 2 partial tracts)
A) FHA, FSA/RHS & VA Home Purchase Loans
B) Conventional Home Purchase Loans
C) Refinancings
D) Home Improvement Loans
F) Non-occupant Loans on < 5 Family Dwellings (A B C & D)
G) Loans On Manufactured Home Dwelling (A B C & D)
Number
Average Value
Number
Average Value
Number
Average Value
Number
Average Value
Number
Average Value
Number
Average Value
LOANS ORIGINATED
27
$124,036
129
$122,987
198
$114,291
44
$55,396
27
$126,667
30
$63,688
APPLICATIONS APPROVED, NOT ACCEPTED
1
$111,280
6
$81,090
36
$100,360
7
$33,654
1
$142,060
4
$44,688
APPLICATIONS DENIED
2
$150,345
32
$64,887
127
$97,258
24
$61,015
14
$95,549
18
$43,472
APPLICATIONS WITHDRAWN
2
$225,515
9
$107,200
88
$130,743
5
$65,110
5
$79,314
7
$89,123
FILES CLOSED FOR INCOMPLETENESS
0
$0
1
$59,190
9
$104,832
1
$29,590
0
$0
0
$0
Aggregated Statistics For Year 2003 (Based on 2 partial tracts)
A) FHA, FSA/RHS & VA Home Purchase Loans
B) Conventional Home Purchase Loans
C) Refinancings
D) Home Improvement Loans
F) Non-occupant Loans on < 5 Family Dwellings (A B C & D)
Number
Average Value
Number
Average Value
Number
Average Value
Number
Average Value
Number
Average Value
LOANS ORIGINATED
14
$104,513
104
$119,587
361
$102,151
18
$16,113
18
$106,411
APPLICATIONS APPROVED, NOT ACCEPTED
2
$158,035
5
$97,072
24
$125,335
5
$15,862
1
$111,280
APPLICATIONS DENIED
1
$104,170
20
$58,066
88
$93,695
11
$25,505
0
$0
APPLICATIONS WITHDRAWN
1
$142,060
7
$119,226
82
$106,095
4
$42,025
2
$92,335
FILES CLOSED FOR INCOMPLETENESS
0
$0
0
$0
2
$159,220
0
$0
0
$0
Aggregated Statistics For Year 2002 (Based on 2 partial tracts)
A) FHA, FSA/RHS & VA Home Purchase Loans
B) Conventional Home Purchase Loans
C) Refinancings
D) Home Improvement Loans
F) Non-occupant Loans on < 5 Family Dwellings (A B C & D)
Number
Average Value
Number
Average Value
Number
Average Value
Number
Average Value
Number
Average Value
LOANS ORIGINATED
20
$98,137
84
$107,853
289
$98,468
32
$22,122
14
$76,355
APPLICATIONS APPROVED, NOT ACCEPTED
0
$0
7
$109,417
30
$101,294
2
$13,615
2
$227,880
APPLICATIONS DENIED
0
$0
26
$54,409
86
$89,336
22
$10,762
2
$87,600
APPLICATIONS WITHDRAWN
0
$0
5
$90,916
46
$96,454
2
$6,510
0
$0
FILES CLOSED FOR INCOMPLETENESS
0
$0
1
$149,160
6
$76,355
0
$0
0
$0
Aggregated Statistics For Year 2001 (Based on 2 partial tracts)
A) FHA, FSA/RHS & VA Home Purchase Loans
B) Conventional Home Purchase Loans
C) Refinancings
D) Home Improvement Loans
F) Non-occupant Loans on < 5 Family Dwellings (A B C & D)
Number
Average Value
Number
Average Value
Number
Average Value
Number
Average Value
Number
Average Value
LOANS ORIGINATED
25
$104,743
91
$86,586
239
$94,164
27
$16,705
18
$77,342
APPLICATIONS APPROVED, NOT ACCEPTED
1
$105,360
14
$63,841
14
$70,944
2
$8,285
0
$0
APPLICATIONS DENIED
0
$0
43
$51,454
69
$60,305
13
$15,389
2
$46,170
APPLICATIONS WITHDRAWN
0
$0
5
$50,194
46
$108,730
6
$8,287
0
$0
FILES CLOSED FOR INCOMPLETENESS
0
$0
0
$0
7
$74,071
0
$0
0
$0
Aggregated Statistics For Year 2000 (Based on 2 partial tracts)
A) FHA, FSA/RHS & VA Home Purchase Loans
B) Conventional Home Purchase Loans
C) Refinancings
D) Home Improvement Loans
F) Non-occupant Loans on < 5 Family Dwellings (A B C & D)
Number
Average Value
Number
Average Value
Number
Average Value
Number
Average Value
Number
Average Value
LOANS ORIGINATED
22
$88,893
83
$77,945
60
$76,809
36
$12,824
1
$140,870
APPLICATIONS APPROVED, NOT ACCEPTED
0
$0
7
$56,484
6
$65,108
6
$33,343
0
$0
APPLICATIONS DENIED
0
$0
69
$44,230
60
$69,667
7
$19,956
1
$23,680
APPLICATIONS WITHDRAWN
1
$151,530
4
$48,832
25
$71,123
4
$16,278
0
$0
FILES CLOSED FOR INCOMPLETENESS
0
$0
0
$0
2
$73,395
0
$0
0
$0
Aggregated Statistics For Year 1999 (Based on 1 partial tract)
A) FHA, FSA/RHS & VA Home Purchase Loans
B) Conventional Home Purchase Loans
C) Refinancings
D) Home Improvement Loans
F) Non-occupant Loans on < 5 Family Dwellings (A B C & D)
Detailed PMIC statistics for the following Tracts:0090.00
2003 - 2018 National Fire Incident Reporting System (NFIRS) incidents
According to the data from the years 2003 - 2018 the average number of fire incidents per year is 21. The highest number of reported fire incidents - 51 took place in 2018, and the least - 2 in 2007. The data has an increasing trend.
When looking into fire subcategories, the most reports belonged to: Structure Fires (68.1%), and Outside Fires (14.2%).
Fire incident types reported to NFIRS in Zip Code 04428


 Nearest zip codes: 04411, 04429, 04469, 04461, 04489, 04412.


 According to the data from the years 2003 - 2018 the average number of fire incidents per year is 21. The highest number of reported fire incidents - 51 took place in 2018, and the least - 2 in 2007. The data has an increasing trend.
 When looking into fire subcategories, the most reports belonged to: Structure Fires (68.1%), and Outside Fires (14.2%).