Estimated zip code population in 2022: 5,410 Zip code population in 2010: 5,603 Zip code population in 2000: 5,264
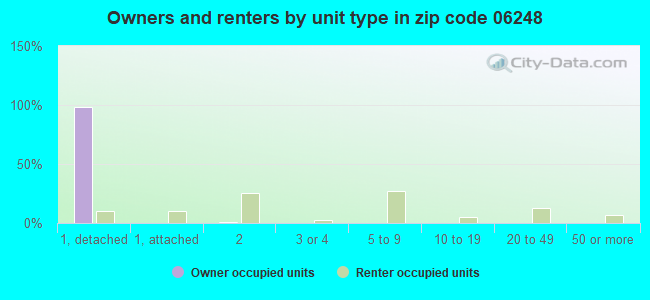
Houses and condos: 2,241 Renter-occupied apartments: 313
% of renters here:
15%
State:
34%
March 2022 cost of living index in zip code 06248: 98.1 (near average, U.S. average is 100)
Land area: 21.0 sq. mi. Water area: 0.2 sq. mi.
Population density: 257 people per square mile
(very low).
OSM Map
Google Map
MSN Map
OSM Map
General Map
Google Map
MSN Map
OSM Map
Google Map
MSN Map
OSM Map
Google Map
MSN Map
Please wait while loading the map...
Real estate property taxes paid for housing units in 2022:
This zip code:
2.2% ($8,032)
Connecticut:
1.8% ($6,189)
Median real estate property taxes paid for housing units with mortgages in 2022: $8,446 (2.2%) Median real estate property taxes paid for housing units with no mortgage in 2022: $7,021 (2.1%)
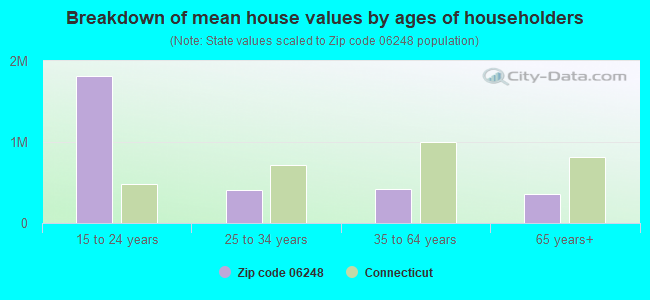
Estimated median house/condo value in 2022: $369,939
06248:
$369,939
Connecticut:
$347,200
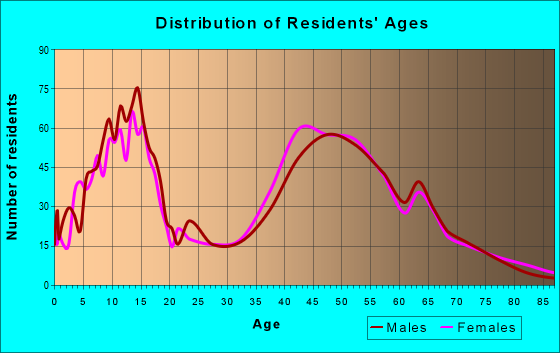
Median resident age:
This zip code:
45.5 years
Connecticut median age:
40.9 years
Average household size:
This zip code:
2.5 people
Connecticut:
2.5 people
Averages for the 2020 tax year for zip code 06248, filed in 2021:
Average Adjusted Gross Income (AGI) in 2020: $104,151 (Individual Income Tax Returns)
Here:
$104,151
State:
$105,931
Salary/wage: $95,337 (reported on 79.9% of returns)
Here:
$95,337
State:
$83,540
(% of AGI for various income ranges: 1076.3% for AGIs below $25k, 3184.4% for AGIs $25k-50k, 5978.6% for AGIs $50k-75k, 8103.6% for AGIs $75k-100k, 18178.6% for AGIs $100k-200k, 79674.2% for AGIs over 200k)
Taxable interest for individuals: $1,007 (reported on 45.3% of returns)
This zip code:
$1,007
Connecticut:
$3,402
(% of AGI for various income ranges: 16.5% for AGIs below $25k, 41.8% for AGIs $25k-50k, 68.6% for AGIs $50k-75k, 51.2% for AGIs $75k-100k, 108.8% for AGIs $100k-200k, 314.2% for AGIs over 200k)
Ordinary dividends: $6,201 (reported on 33.6% of returns)
Here:
$6,201
State:
$12,683
(% of AGI for various income ranges: 38.6% for AGIs below $25k, 80.0% for AGIs $25k-50k, 268.1% for AGIs $50k-75k, 162.0% for AGIs $75k-100k, 277.6% for AGIs $100k-200k, 2869.2% for AGIs over 200k)
Net capital gain/loss in AGI: +$10,214 (reported on 28.7% of returns)
Here:
+$10,214
State:
+$44,158
(% of AGI for various income ranges: 28.8% for AGIs below $25k, 87.1% for AGIs $25k-50k, 182.9% for AGIs $50k-75k, 98.8% for AGIs $75k-100k, 413.8% for AGIs $100k-200k, 4740.8% for AGIs over 200k)
Profit/loss from business: +$22,088 (reported on 13.8% of returns)
Here:
+$22,088
State:
+$22,988
(% of AGI for various income ranges: 83.7% for AGIs below $25k, 253.2% for AGIs $25k-50k, 321.9% for AGIs $50k-75k, 400.4% for AGIs $75k-100k, 742.6% for AGIs $100k-200k, 2348.3% for AGIs over 200k)
Taxable individual retirement arrangement distribution: $21,516 (reported on 13.1% of returns)
06248:
$21,516
Connecticut:
$22,031
(% of AGI for various income ranges: 60.5% for AGIs below $25k, 171.2% for AGIs $25k-50k, 372.4% for AGIs $50k-75k, 430.4% for AGIs $75k-100k, 768.8% for AGIs $100k-200k, 1872.5% for AGIs over 200k)
Self-employed (Keogh) retirement plans: $20,567 (reported on 1.0% of returns)
06248:
$20,567
Connecticut:
$29,016
(% of AGI for various income ranges: 146.9% for AGIs $100k-200k)
Total itemized deductions: $28,546 (reported on 12.1% of returns)
Here:
$28,546
State:
$37,613
(% of AGI for various income ranges: 314.7% for AGIs $25k-50k, 471.0% for AGIs $50k-75k, 647.2% for AGIs $75k-100k, 798.6% for AGIs $100k-200k, 2466.7% for AGIs over 200k)
Charity contributions: $7,193 (reported on 9.3% of returns)
Here:
$7,193
State:
$13,557
(% of AGI for various income ranges: 8.5% for AGIs $25k-50k, 39.0% for AGIs $50k-75k, 42.0% for AGIs $75k-100k, 137.9% for AGIs $100k-200k, 955.8% for AGIs over 200k)
Taxes paid: $9,257 (reported on 12.1% of returns)
06248:
$9,257
State:
$9,096
(% of AGI for various income ranges: 89.4% for AGIs $25k-50k, 169.0% for AGIs $50k-75k, 274.4% for AGIs $75k-100k, 286.0% for AGIs $100k-200k, 578.3% for AGIs over 200k)
Earned income credit: $1,842 (reported on 4.2% of returns)
Here:
$1,842
State:
$2,059
(% of AGI for various income ranges: 26.3% for AGIs below $25k, 31.8% for AGIs $25k-50k)
Percentage of individuals using paid preparers for their 2020 taxes: 92.7%
Here:
93%
State:
93%
(% for various income ranges: 91.0% for AGIs below $25k, 93.5% for AGIs $25k-50k, 93.9% for AGIs $50k-75k, 91.4% for AGIs $75k-100k, 93.2% for AGIs $100k-200k, 94.1% for AGIs over 200k)
Averages for the 2012 tax year for zip code 06248, filed in 2013:
Average Adjusted Gross Income (AGI) in 2012: $92,580 (Individual Income Tax Returns)
Here:
$92,580
State:
$93,290
Salary/wage: $84,144 (reported on 83.7% of returns)
Here:
$84,144
State:
$73,117
(% of AGI for various income ranges: 66.1% for AGIs below $25k, 73.5% for AGIs $25k-50k, 69.9% for AGIs $50k-75k, 76.0% for AGIs $75k-100k, 81.2% for AGIs $100k-200k, 73.2% for AGIs over 200k)
Taxable interest for individuals: $753 (reported on 59.6% of returns)
This zip code:
$753
Connecticut:
$2,530
(% of AGI for various income ranges: 2.3% for AGIs below $25k, 0.6% for AGIs $25k-50k, 0.7% for AGIs $50k-75k, 0.4% for AGIs $75k-100k, 0.4% for AGIs $100k-200k, 0.4% for AGIs over 200k)
Ordinary dividends: $3,725 (reported on 37.9% of returns)
Here:
$3,725
State:
$10,909
(% of AGI for various income ranges: 3.4% for AGIs below $25k, 1.0% for AGIs $25k-50k, 1.8% for AGIs $50k-75k, 1.0% for AGIs $75k-100k, 1.1% for AGIs $100k-200k, 2.1% for AGIs over 200k)
Net capital gain/loss in AGI: +$7,046 (reported on 28.4% of returns)
Here:
+$7,046
State:
+$34,090
(% of AGI for various income ranges: 1.8% for AGIs below $25k, 0.5% for AGIs $50k-75k, 0.3% for AGIs $75k-100k, 0.6% for AGIs $100k-200k, 5.2% for AGIs over 200k)
Profit/loss from business: +$23,376 (reported on 16.3% of returns)
Here:
+$23,376
State:
+$22,741
(% of AGI for various income ranges: 5.6% for AGIs below $25k, 3.9% for AGIs $25k-50k, 4.1% for AGIs $50k-75k, 3.7% for AGIs $75k-100k, 2.9% for AGIs $100k-200k, 5.5% for AGIs over 200k)
Taxable individual retirement arrangement distribution: $16,383 (reported on 12.4% of returns)
06248:
$16,383
Connecticut:
$19,976
(% of AGI for various income ranges: 3.7% for AGIs below $25k, 3.8% for AGIs $25k-50k, 2.6% for AGIs $50k-75k, 3.5% for AGIs $75k-100k, 2.4% for AGIs $100k-200k, 1.1% for AGIs over 200k)
Self-employment retirement plans: $21,700 (reported on 1.4% of returns)
06248:
$21,700
Connecticut:
$24,004
Total itemized deductions: $26,253 (19% of AGI, reported on 57.8% of returns)
Here:
$26,253
State:
$33,239
Here:
18.9% of AGI
State:
18.9% of AGI
(% of AGI for various income ranges: 15.7% for AGIs below $25k, 14.9% for AGIs $25k-50k, 18.3% for AGIs $50k-75k, 19.5% for AGIs $75k-100k, 18.2% for AGIs $100k-200k, 13.4% for AGIs over 200k)
Charity contributions: $2,718 (reported on 48.9% of returns)
Here:
$2,718
State:
$4,947
(% of AGI for various income ranges: 0.7% for AGIs below $25k, 0.9% for AGIs $25k-50k, 1.2% for AGIs $50k-75k, 1.2% for AGIs $75k-100k, 1.4% for AGIs $100k-200k, 1.8% for AGIs over 200k)
Taxes paid: $14,723 (reported on 57.8% of returns)
06248:
$14,723
State:
$17,397
(% of AGI for various income ranges: 5.5% for AGIs below $25k, 6.3% for AGIs $25k-50k, 8.8% for AGIs $50k-75k, 9.6% for AGIs $75k-100k, 10.5% for AGIs $100k-200k, 8.5% for AGIs over 200k)
Earned income credit: $1,500 (reported on 5.0% of returns)
Here:
$1,500
State:
$2,053
(% of AGI for various income ranges: 1.9% for AGIs below $25k, 0.4% for AGIs $25k-50k)
Percentage of individuals using paid preparers for their 2012 taxes: 48.2%
Here:
48%
State:
55%
(% for various income ranges: 38.2% for AGIs below $25k, 50.0% for AGIs $25k-50k, 55.6% for AGIs $50k-75k, 53.3% for AGIs $75k-100k, 48.6% for AGIs $100k-200k, 57.7% for AGIs over 200k)
Averages for the 2004 tax year for zip code 06248, filed in 2005:
Average Adjusted Gross Income (AGI) in 2004: $78,526 (Individual Income Tax Returns)
Here:
$78,526
State:
$73,265
Salary/wage: $70,880 (reported on 85.6% of returns)
Here:
$70,880
State:
$62,030
(% of AGI for various income ranges: 117.3% for AGIs below $10k, 67.0% for AGIs $10k-25k, 73.9% for AGIs $25k-50k, 76.9% for AGIs $50k-75k, 86.4% for AGIs $75k-100k, 75.5% for AGIs over 100k)
Taxable interest for individuals: $966 (reported on 72.4% of returns)
This zip code:
$966
Connecticut:
$2,287
(% of AGI for various income ranges: 5.9% for AGIs below $10k, 2.9% for AGIs $10k-25k, 1.7% for AGIs $25k-50k, 1.2% for AGIs $50k-75k, 0.6% for AGIs $75k-100k, 0.7% for AGIs over 100k)
Taxable dividends: $1,885 (reported on 43.0% of returns)
Here:
$1,885
State:
$5,735
(% of AGI for various income ranges: 8.4% for AGIs below $10k, 2.1% for AGIs $10k-25k, 1.2% for AGIs $25k-50k, 1.0% for AGIs $50k-75k, 1.0% for AGIs $75k-100k, 0.9% for AGIs over 100k)
Net capital gain/loss: +$4,463 (reported on 33.3% of returns)
Here:
+$4,463
State:
+$23,694
(% of AGI for various income ranges: -1.6% for AGIs below $10k, -0.4% for AGIs $10k-25k, 0.6% for AGIs $25k-50k, 1.1% for AGIs $50k-75k, 0.7% for AGIs $75k-100k, 2.6% for AGIs over 100k)
Profit/loss from business: +$20,840 (reported on 17.7% of returns)
Here:
+$20,840
State:
+$20,783
(% of AGI for various income ranges: 5.4% for AGIs below $10k, 8.9% for AGIs $10k-25k, 7.7% for AGIs $25k-50k, 3.6% for AGIs $50k-75k, 4.0% for AGIs $75k-100k, 4.5% for AGIs over 100k)
IRA payment deduction: $3,316 (reported on 2.9% of returns)
06248:
$3,316
Connecticut:
$3,216
(% of AGI for various income ranges: 0.3% for AGIs $25k-50k, 0.3% for AGIs $50k-75k, 0.1% for AGIs $75k-100k, 0.1% for AGIs over 100k)
Self-employed pension: $13,290 (reported on 2.4% of returns)
Here:
$13,290
Connecticut:
$17,335
Total itemized deductions: $22,524 (19% of AGI, reported on 59.0% of returns)
Here:
$22,524
State:
$24,919
Here:
19.1% of AGI
State:
18.6% of AGI
(% of AGI for various income ranges: 19.6% for AGIs below $10k, 22.6% for AGIs $10k-25k, 16.0% for AGIs $25k-50k, 20.6% for AGIs $50k-75k, 20.4% for AGIs $75k-100k, 15.3% for AGIs over 100k)
Charity contributions deductions: $2,514 (2% of AGI, reported on 54.5% of returns)
Here:
$2,514
State:
$3,762
Here:
2.1% of AGI
State:
2.7% of AGI
(% of AGI for various income ranges: 1.1% for AGIs $10k-25k, 1.0% for AGIs $25k-50k, 1.8% for AGIs $50k-75k, 1.5% for AGIs $75k-100k, 1.9% for AGIs over 100k)
Total tax: $13,779 (reported on 85.4% of returns)
06248:
$13,779
State:
$15,148
(% of AGI for various income ranges: 5.0% for AGIs below $10k, 5.9% for AGIs $10k-25k, 8.1% for AGIs $25k-50k, 9.1% for AGIs $50k-75k, 9.7% for AGIs $75k-100k, 18.6% for AGIs over 100k)
Earned income credit: $1,124 (reported on 3.8% of returns)
Here:
$1,124
State:
$1,570
Percentage of individuals using paid preparers for their 2004 taxes: 51.1%
Here:
51%
State:
59%
(% for various income ranges: 40.1% for AGIs below $10k, 48.6% for AGIs $10k-25k, 54.2% for AGIs $25k-50k, 52.3% for AGIs $50k-75k, 57.7% for AGIs $75k-100k, 53.5% for AGIs over 100k)
Likely homosexual households (counted as self-reported same-sex unmarried-partner households)
Lesbian couples: 0.4% of all households
Gay men: 0.0% of all households
Household received Food Stamps/SNAP in the past 12 months: 88 Household did not receive Food Stamps/SNAP in the past 12 months: 2,052
Women who had a birth in the past 12 months: 83 (62 now married, 21 unmarried) Women who did not have a birth in the past 12 months: 948 (486 now married, 450 unmarried)
Housing units in zip code 06248 with a mortgage: 1,333 (200 second mortgage, 205 both second mortgage and home equity loan) Houses without a mortgage: 139
Median monthly owner costs for units with a mortgage: $2,227 Median monthly owner costs for units without a mortgage: $944
Residents with income below the poverty level in 2022:
This zip code:
5.2%
Whole state:
9.8%
Residents with income below 50% of the poverty level in 2022:
This zip code:
2.6%
Whole state:
4.8%
Median number of rooms in houses and condos:
Here:
7.0
State:
6.5
Median number of rooms in apartments:
Here:
4.3
State:
4.0
Notable locations in this zip code not listed on our city pages
Notable locations in zip code 06248: Hebron Volunteer Fire Department Station 3 (A), Hebron Volunteer Fire Department Station 1 (B). Display/hide their locations on the map
In group quarters: 13 (-1 institutionalized population)
Size of family households: 724 2-persons, 465 3-persons, 216 4-persons, 163 5-persons, 40 6-persons, 10 7-or-more-persons
Size of nonfamily households: 462 1-person, 41 2-persons
928 married couples with children.
253 single-parent households (97 men, 156 women).
94.7% of residents of 06248 zip code speak English at home.
1.0% of residents speak Spanish at home (100% very well).
2.9% of residents speak other Indo-European language at home (93% very well, 7% well).
0.5% of residents speak Asian or Pacific Island language at home (100% very well).
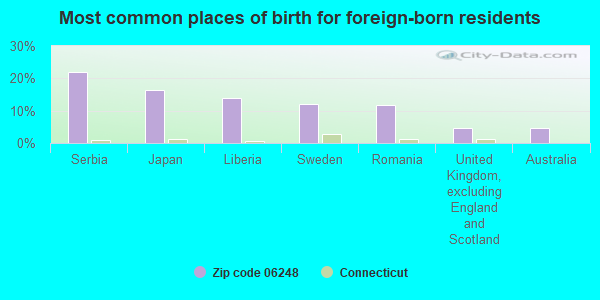
Foreign born population: 215 (4.0%) (79.3% of them are naturalized citizens)
This zip code:
4.0%
Whole state:
15.7%
22%Serbia
16%Japan
14%Liberia
12%Sweden
12%Romania
5%United Kingdom, excluding England and Scotland
5%Australia
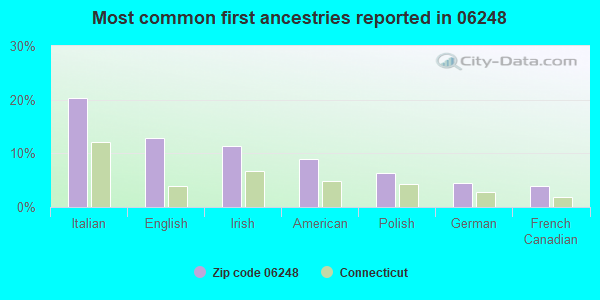
20%Italian
13%English
11%Irish
9%American
6%Polish
4%German
4%French Canadian
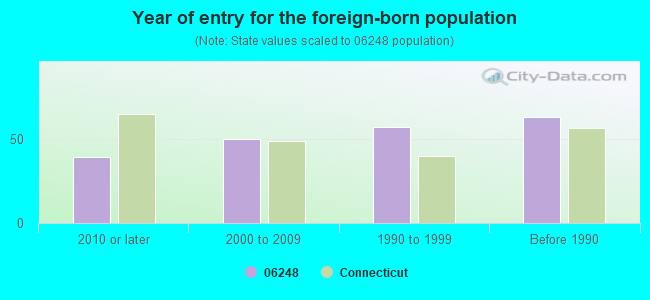
Year of entry for the foreign-born population
392010 or later
502000 to 2009
571990 to 1999
63Before 1990
Facilities with environmental interests located in this zip code:
HOMEBOUND (33 PENDLETON DRIVE in HEBRON, CT)
(National Center for Education Statistics) - STATE ID-88 Organizations: HEBRON SCHOOL DISTRICT (SCHOOL DISTRICT)
, REGIONAL SCHOOL DISTRICT 08 (SCHOOL DISTRICT)
HEBRON ELEMENTARY SCHOOL (92 CHURCH STREET in HEBRON, CT)
(Geographic Names Information System) (National Center for Education Statistics) - STATE ID-1 Organizations: HEBRON SCHOOL DISTRICT (SCHOOL DISTRICT)
GILEAD HILL SCHOOL (580 GILEAD STREET in HEBRON, CT)
(National Center for Education Statistics) - STATE ID-2 Organizations: HEBRON SCHOOL DISTRICT (SCHOOL DISTRICT)
A G T VALVE 30 (NORTH STREET in HEBRON, CT)
Small Quantity Generators, between 100 kg and 1000 kg of hazardous waste/month (Resource Conservation and Recovery Act (tracking hazardous waste)) - notification Organizations: ALGONQUIN GAS TRANSMISSION COMPANY (CONTACT/OWNER)
ANDOVER BOARD OF EDUCATION (21 PENDLETON DRIVE in HEBRON, CT)
COMPLIANCE ACTIVITY (Tracking inspections of insecticide, fungicide, and rodenticide, and toxic substances)
NUCLEAR TECHNOLOGY CORPORATION (FORMER) (612 CHURCH STREET (RT 88) in HEBRON, CT)
SUPERFUND (Superfund database)
Housing units lacking complete plumbing facilities: 0.4% Housing units lacking complete kitchen facilities: 0.4%
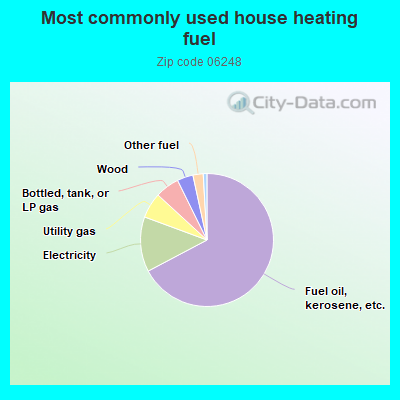
67.4%Fuel oil, kerosene, etc.
13.4%Electricity
6.2%Utility gas
5.9%Bottled, tank, or LP gas
3.9%Wood
2.5%Other fuel
0.9%Solar energy
Population in 1990: 4,192. Population change in the 1990s: +1,072 (+25.6%).
Place of birth for U.S.-born residents:
This state: 3,789
Northeast: 1,047
Midwest: 105
South: 71
West: 136
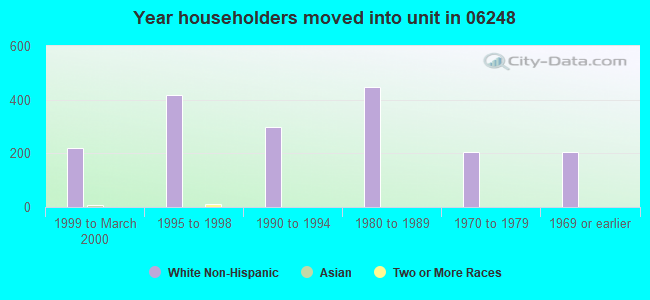
69% of the 06248 zip code residents lived in the same house 5 years ago. Out of people who lived in different houses, 32% lived in this county. Out of people who lived in different counties, 50% lived in Connecticut.
94% of the 06248 zip code residents lived in the same house 1 year ago. Out of people who lived in different houses, 59% moved from this county. Out of people who lived in different houses, 13% moved from different county within same state. Out of people who lived in different houses, 24% moved from different state.
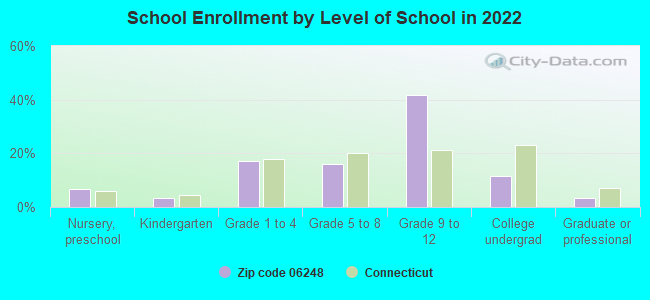
Private vs. public school enrollment:
Students in private schools in grades 1 to 8 (elementary and middle school):
Here:
0.0%
Connecticut:
9.5%
Students in private schools in grades 9 to 12 (high school): 76
Here:
14.0%
Connecticut:
12.9%
Students in private undergraduate colleges: 63
Here:
42.7%
Connecticut:
35.5%
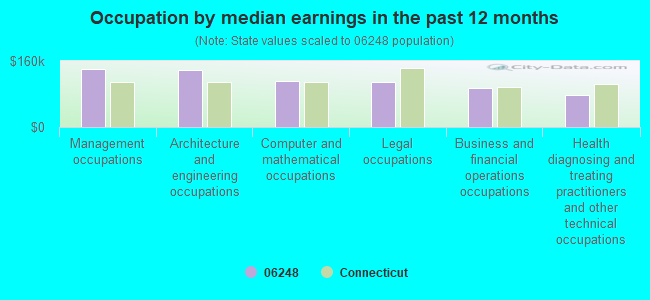
Occupation by median earnings in the past 12 months ($)
139,724Management occupations
138,590Architecture and engineering occupations
110,414Computer and mathematical occupations
108,186Legal occupations
95,563Business and financial operations occupations
76,703Health diagnosing and treating practitioners and other technical occupations
Companies with federal contracts located in this zip code:
EER LIMITED (2 OLDE HALL RD in HEBRON, CT; small business) : $672,400 in 5 contractsfrom 2005 to 2006
Contracts for Trash/Garbage Collection Services - Including Portable Sanitation Services by Defense Logistics Agency Signed by year:2000: $0; 2001: $0; 2002: $0; 2003: $0; 2004: $0; 2005: $504,000; 2006: $168,400.
Biggest contracts:
$252,000 with Defense Logistics Agency for Trash/Garbage Collection Services - Including Portable Sanitation Services. Signed on 2005-07-27. Completion date: 2006-07-21.
$252,000, same as above.Signed on 2005-07-22. Completion date: 2006-07-21.
$126,400, same as above.Signed on 2006-05-15. Completion date: 2006-07-21.
$87,000, same as above.Signed on 2006-06-26. Completion date: 2006-07-21.
Top industries in this zip code by the number of employees in 2005:
Health Care and Social Assistance: Home Health Care Services (50-99 employees: 1 establishment)
Accommodation and Food Services: Limited-Service Restaurants (20-49: 1, 5-9: 1)
Health Care and Social Assistance: Other Individual and Family Services (20-49: 1, 1-4: 1)
Accommodation and Food Services: Bed-and-Breakfast Inns (20-49: 1)
Other Services (except Public Administration): Religious Organizations (10-19: 1, 5-9: 2, 1-4: 2)
Health Care and Social Assistance: Residential Mental Retardation Facilities (10-19: 2)
Health Care and Social Assistance: Offices of Dentists (5-9: 4, 1-4: 1)
People in group quarters in 2010:
5 people in group homes for juveniles (non-correctional)
3 people in group homes intended for adults
Fatal accident statistics in 2014:
Fatal accident count: 2
Vehicles involved in fatal accidents: 2
Fatal accidents caused by drunken drivers: 1
Fatalities: 2
Persons involved in fatal accidents: 2
Pedestrians involved in fatal accidents: 1
Fatal accident statistics in 2013:
Fatal accident count: 3
Vehicles involved in fatal accidents: 5
Fatal accidents caused by drunken drivers: 2
Fatalities: 3
Persons involved in fatal accidents: 8
Pedestrians involved in fatal accidents: 0
Home Mortgage Disclosure Act Aggregated Statistics For Year 2009 (Based on 2 partial tracts)
A) FHA, FSA/RHS & VA Home Purchase Loans
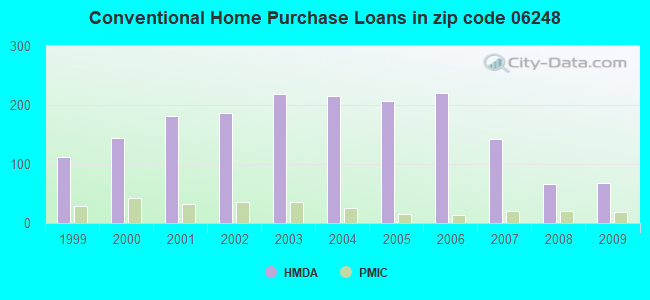
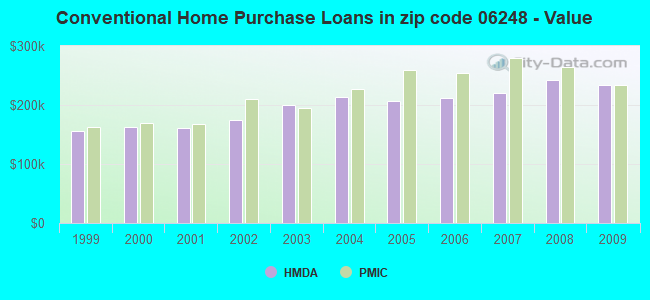
B) Conventional Home Purchase Loans
C) Refinancings
D) Home Improvement Loans
F) Non-occupant Loans on < 5 Family Dwellings (A B C & D)
Number
Average Value
Number
Average Value
Number
Average Value
Number
Average Value
Number
Average Value
LOANS ORIGINATED
32
$229,519
67
$233,751
424
$212,893
32
$78,727
5
$183,644
APPLICATIONS APPROVED, NOT ACCEPTED
2
$229,555
5
$166,544
32
$230,726
4
$31,330
2
$159,285
APPLICATIONS DENIED
9
$200,276
6
$231,898
76
$234,625
9
$54,787
4
$107,458
APPLICATIONS WITHDRAWN
4
$183,585
2
$354,290
64
$237,937
1
$484,880
0
$0
FILES CLOSED FOR INCOMPLETENESS
0
$0
1
$331,450
32
$231,019
1
$35,140
1
$35,140
Aggregated Statistics For Year 2008 (Based on 2 partial tracts)
A) FHA, FSA/RHS & VA Home Purchase Loans
B) Conventional Home Purchase Loans
C) Refinancings
D) Home Improvement Loans
E) Loans on Dwellings For 5+ Families
F) Non-occupant Loans on < 5 Family Dwellings (A B C & D)
Number
Average Value
Number
Average Value
Number
Average Value
Number
Average Value
Number
Average Value
Number
Average Value
LOANS ORIGINATED
15
$219,327
66
$241,764
176
$202,791
46
$94,231
0
$0
6
$120,828
APPLICATIONS APPROVED, NOT ACCEPTED
1
$295,140
7
$269,879
28
$211,569
6
$26,742
0
$0
0
$0
APPLICATIONS DENIED
7
$204,793
11
$213,265
76
$216,764
13
$50,632
0
$0
2
$101,310
APPLICATIONS WITHDRAWN
0
$0
9
$234,240
43
$210,898
5
$96,742
0
$0
1
$220,190
FILES CLOSED FOR INCOMPLETENESS
1
$158,110
0
$0
11
$215,607
2
$42,165
1
$644,160
1
$113,610
Aggregated Statistics For Year 2007 (Based on 2 partial tracts)
A) FHA, FSA/RHS & VA Home Purchase Loans
B) Conventional Home Purchase Loans
C) Refinancings
D) Home Improvement Loans
F) Non-occupant Loans on < 5 Family Dwellings (A B C & D)
Number
Average Value
Number
Average Value
Number
Average Value
Number
Average Value
Number
Average Value
LOANS ORIGINATED
16
$252,174
143
$220,652
232
$162,201
94
$65,537
16
$172,532
APPLICATIONS APPROVED, NOT ACCEPTED
0
$0
18
$206,066
41
$164,625
13
$62,434
4
$177,438
APPLICATIONS DENIED
1
$358,390
13
$224,600
85
$194,764
19
$42,348
2
$247,125
APPLICATIONS WITHDRAWN
2
$248,880
9
$246,863
55
$180,663
2
$52,705
1
$70,270
FILES CLOSED FOR INCOMPLETENESS
0
$0
1
$234,240
14
$288,031
5
$67,930
0
$0
Aggregated Statistics For Year 2006 (Based on 2 partial tracts)
A) FHA, FSA/RHS & VA Home Purchase Loans
B) Conventional Home Purchase Loans
C) Refinancings
D) Home Improvement Loans
F) Non-occupant Loans on < 5 Family Dwellings (A B C & D)
G) Loans On Manufactured Home Dwelling (A B C & D)
Number
Average Value
Number
Average Value
Number
Average Value
Number
Average Value
Number
Average Value
Number
Average Value
LOANS ORIGINATED
8
$246,391
221
$211,521
224
$140,999
102
$53,841
14
$217,425
0
$0
APPLICATIONS APPROVED, NOT ACCEPTED
0
$0
27
$253,500
28
$160,622
13
$54,686
1
$260,010
0
$0
APPLICATIONS DENIED
2
$347,260
27
$183,444
107
$177,825
23
$57,338
5
$220,420
0
$0
APPLICATIONS WITHDRAWN
0
$0
16
$247,489
96
$195,371
8
$65,001
2
$160,455
1
$161,630
FILES CLOSED FOR INCOMPLETENESS
0
$0
4
$85,498
13
$138,562
2
$200,860
0
$0
0
$0
Aggregated Statistics For Year 2005 (Based on 2 partial tracts)
A) FHA, FSA/RHS & VA Home Purchase Loans
B) Conventional Home Purchase Loans
C) Refinancings
D) Home Improvement Loans
F) Non-occupant Loans on < 5 Family Dwellings (A B C & D)
G) Loans On Manufactured Home Dwelling (A B C & D)
Number
Average Value
Number
Average Value
Number
Average Value
Number
Average Value
Number
Average Value
Number
Average Value
LOANS ORIGINATED
11
$183,346
206
$207,183
307
$170,915
95
$50,140
15
$188,563
1
$113,610
APPLICATIONS APPROVED, NOT ACCEPTED
0
$0
27
$208,517
52
$182,932
11
$46,422
4
$214,038
0
$0
APPLICATIONS DENIED
0
$0
35
$271,551
98
$170,266
34
$44,954
1
$398,210
4
$89,598
APPLICATIONS WITHDRAWN
0
$0
15
$203,164
164
$184,864
13
$134,418
8
$181,975
0
$0
FILES CLOSED FOR INCOMPLETENESS
0
$0
13
$171,355
25
$198,495
0
$0
0
$0
0
$0
Aggregated Statistics For Year 2004 (Based on 2 partial tracts)
A) FHA, FSA/RHS & VA Home Purchase Loans
B) Conventional Home Purchase Loans
C) Refinancings
D) Home Improvement Loans
E) Loans on Dwellings For 5+ Families
F) Non-occupant Loans on < 5 Family Dwellings (A B C & D)
G) Loans On Manufactured Home Dwelling (A B C & D)
Number
Average Value
Number
Average Value
Number
Average Value
Number
Average Value
Number
Average Value
Number
Average Value
Number
Average Value
LOANS ORIGINATED
6
$185,050
216
$212,909
350
$156,164
73
$48,549
1
$187,390
7
$179,361
1
$32,790
APPLICATIONS APPROVED, NOT ACCEPTED
1
$168,650
33
$248,401
40
$167,130
16
$45,458
0
$0
4
$89,598
0
$0
APPLICATIONS DENIED
0
$0
20
$192,780
93
$178,262
28
$28,652
0
$0
5
$64,650
1
$197,930
APPLICATIONS WITHDRAWN
1
$171,000
14
$191,993
131
$178,675
8
$22,692
0
$0
0
$0
0
$0
FILES CLOSED FOR INCOMPLETENESS
0
$0
4
$264,105
35
$164,202
1
$58,560
0
$0
1
$113,610
0
$0
Aggregated Statistics For Year 2003 (Based on 2 partial tracts)
A) FHA, FSA/RHS & VA Home Purchase Loans
B) Conventional Home Purchase Loans
C) Refinancings
D) Home Improvement Loans
F) Non-occupant Loans on < 5 Family Dwellings (A B C & D)
Number
Average Value
Number
Average Value
Number
Average Value
Number
Average Value
Number
Average Value
LOANS ORIGINATED
6
$163,382
218
$200,119
998
$156,258
46
$42,571
15
$145,853
APPLICATIONS APPROVED, NOT ACCEPTED
0
$0
30
$186,143
100
$152,736
9
$25,767
1
$72,610
APPLICATIONS DENIED
0
$0
21
$193,025
171
$158,879
20
$27,816
1
$243,610
APPLICATIONS WITHDRAWN
1
$214,330
15
$202,461
156
$167,519
8
$37,771
0
$0
FILES CLOSED FOR INCOMPLETENESS
0
$0
1
$154,600
41
$171,509
0
$0
0
$0
Aggregated Statistics For Year 2002 (Based on 2 partial tracts)
A) FHA, FSA/RHS & VA Home Purchase Loans
B) Conventional Home Purchase Loans
C) Refinancings
D) Home Improvement Loans
F) Non-occupant Loans on < 5 Family Dwellings (A B C & D)
Number
Average Value
Number
Average Value
Number
Average Value
Number
Average Value
Number
Average Value
LOANS ORIGINATED
19
$145,722
187
$174,766
527
$148,729
63
$32,087
5
$89,480
APPLICATIONS APPROVED, NOT ACCEPTED
0
$0
13
$174,959
46
$143,548
15
$33,340
1
$29,280
APPLICATIONS DENIED
1
$179,190
5
$55,280
81
$130,003
22
$26,831
1
$64,420
APPLICATIONS WITHDRAWN
0
$0
9
$200,926
87
$152,687
6
$44,700
2
$76,130
FILES CLOSED FOR INCOMPLETENESS
0
$0
5
$152,256
18
$178,933
1
$29,280
1
$333,790
Aggregated Statistics For Year 2001 (Based on 2 partial tracts)
A) FHA, FSA/RHS & VA Home Purchase Loans
B) Conventional Home Purchase Loans
C) Refinancings
D) Home Improvement Loans
F) Non-occupant Loans on < 5 Family Dwellings (A B C & D)
Number
Average Value
Number
Average Value
Number
Average Value
Number
Average Value
Number
Average Value
LOANS ORIGINATED
22
$154,226
182
$161,433
385
$144,575
88
$36,813
9
$59,601
APPLICATIONS APPROVED, NOT ACCEPTED
1
$186,220
16
$159,942
37
$104,775
12
$23,717
0
$0
APPLICATIONS DENIED
1
$126,490
8
$187,539
78
$114,838
25
$37,057
2
$74,370
APPLICATIONS WITHDRAWN
1
$83,160
7
$148,407
70
$119,128
13
$39,010
5
$18,036
FILES CLOSED FOR INCOMPLETENESS
0
$0
2
$78,470
9
$134,948
1
$40,990
0
$0
Aggregated Statistics For Year 2000 (Based on 2 partial tracts)
A) FHA, FSA/RHS & VA Home Purchase Loans
B) Conventional Home Purchase Loans
C) Refinancings
D) Home Improvement Loans
E) Loans on Dwellings For 5+ Families
F) Non-occupant Loans on < 5 Family Dwellings (A B C & D)
Number
Average Value
Number
Average Value
Number
Average Value
Number
Average Value
Number
Average Value
Number
Average Value
LOANS ORIGINATED
13
$130,904
144
$162,154
84
$91,075
52
$24,573
0
$0
7
$154,431
APPLICATIONS APPROVED, NOT ACCEPTED
0
$0
18
$138,462
14
$93,864
7
$27,440
0
$0
0
$0
APPLICATIONS DENIED
4
$120,632
9
$227,603
48
$95,648
13
$40,992
0
$0
2
$114,190
APPLICATIONS WITHDRAWN
2
$137,030
5
$83,156
35
$112,636
7
$88,509
1
$58,560
1
$140,540
FILES CLOSED FOR INCOMPLETENESS
0
$0
0
$0
5
$107,282
1
$46,850
0
$0
0
$0
Aggregated Statistics For Year 1999 (Based on 1 partial tract)
A) FHA, FSA/RHS & VA Home Purchase Loans
B) Conventional Home Purchase Loans
C) Refinancings
D) Home Improvement Loans
E) Loans on Dwellings For 5+ Families
F) Non-occupant Loans on < 5 Family Dwellings (A B C & D)
Detailed PMIC statistics for the following Tracts:5261.00
2002 - 2018 National Fire Incident Reporting System (NFIRS) incidents
According to the data from the years 2002 - 2018 the average number of fire incidents per year is 28. The highest number of reported fires - 56 took place in 2004, and the least - 8 in 2018. The data has a declining trend.
When looking into fire subcategories, the most reports belonged to: Structure Fires (52.4%), and Outside Fires (23.5%).
Fire incident types reported to NFIRS in Zip Code 06248


 Nearest zip codes: 06232, 06447, 06231, 06043, 06237, 06238.


 According to the data from the years 2002 - 2018 the average number of fire incidents per year is 28. The highest number of reported fires - 56 took place in 2004, and the least - 8 in 2018. The data has a declining trend.
 When looking into fire subcategories, the most reports belonged to: Structure Fires (52.4%), and Outside Fires (23.5%).