Estimated zip code population in 2022: 3,318 Zip code population in 2010: 3,282 Zip code population in 2000: 3,765
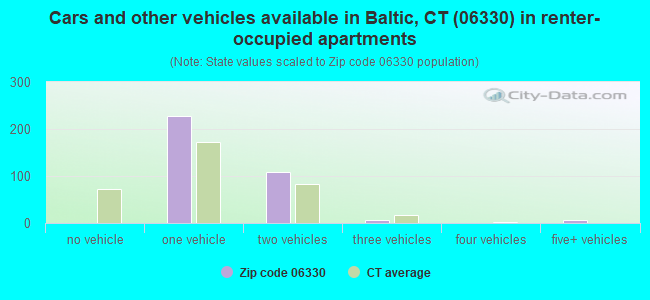
Houses and condos: 1,363 Renter-occupied apartments: 349
% of renters here:
29%
State:
34%
March 2022 cost of living index in zip code 06330: 96.9 (near average, U.S. average is 100)
Land area: 18.3 sq. mi. Water area: 0.6 sq. mi.
Population density: 181 people per square mile
(very low).
OSM Map
Google Map
MSN Map
OSM Map
General Map
Google Map
MSN Map
OSM Map
Google Map
MSN Map
OSM Map
Google Map
MSN Map
Please wait while loading the map...
Real estate property taxes paid for housing units in 2022:
This zip code:
1.6% ($4,606)
Connecticut:
1.8% ($6,189)
Median real estate property taxes paid for housing units with mortgages in 2022: $4,896 (1.6%) Median real estate property taxes paid for housing units with no mortgage in 2022: $4,369 (1.9%)
Business Search- 14 Million verified businesses
Males: 1,676
(50.5%)
Females: 1,642
(49.5%)
For population 25 years and over in 06330:
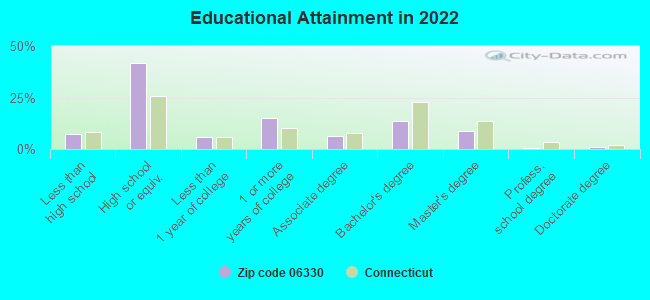
High school or higher: 92.3%
Bachelor's degree or higher: 23.7%
Graduate or professional degree: 10.3%
Unemployed: 3.6%
Mean travel time to work (commute): 33.1 minutes
For population 15 years and over in 06330:
Never married: 33.4%
Now married: 57.1%
Separated: 1.1%
Widowed: 2.1%
Divorced: 6.3%
Zip code 06330 compared to state average:
Black race population percentage significantly below state average.
Hispanic race population percentage below state average.
Foreign-born population percentage significantly below state average.
Length of stay since moving in significantly above state average.
Number of college students below state average.
Percentage of population with a bachelor's degree or higher below state average.
Estimated median house/condo value in 2022: $280,806
06330:
$280,806
Connecticut:
$347,200
According to our research of Connecticut and other state lists, there were 5 registered sex offenders living in 06330 zip code as of April 23, 2024. The ratio of all residents to sex offenders in zip code 06330 is 661 to 1. The ratio of registered sex offenders to all residents in this zip code is near the state average.
Median resident age:
This zip code:
40.1 years
Connecticut median age:
40.9 years
Average household size:
This zip code:
2.7 people
Connecticut:
2.5 people
Averages for the 2020 tax year for zip code 06330, filed in 2021:
Average Adjusted Gross Income (AGI) in 2020: $63,831 (Individual Income Tax Returns)
Here:
$63,831
State:
$105,931
Salary/wage: $56,294 (reported on 84.9% of returns)
Here:
$56,294
State:
$83,540
(% of AGI for various income ranges: 996.7% for AGIs below $25k, 3436.2% for AGIs $25k-50k, 5735.5% for AGIs $50k-75k, 9105.0% for AGIs $75k-100k, 16412.7% for AGIs $100k-200k)
Taxable interest for individuals: $519 (reported on 28.8% of returns)
This zip code:
$519
Connecticut:
$3,402
(% of AGI for various income ranges: 9.7% for AGIs below $25k, 5.2% for AGIs $25k-50k, 10.9% for AGIs $50k-75k, 43.3% for AGIs $75k-100k, 48.0% for AGIs $100k-200k)
Ordinary dividends: $2,796 (reported on 15.8% of returns)
Here:
$2,796
State:
$12,683
(% of AGI for various income ranges: 14.3% for AGIs below $25k, 29.3% for AGIs $25k-50k, 25.0% for AGIs $50k-75k, 158.3% for AGIs $75k-100k, 115.3% for AGIs $100k-200k)
Net capital gain/loss in AGI: +$7,117 (reported on 12.3% of returns)
Here:
+$7,117
State:
+$44,158
(% of AGI for various income ranges: 1.3% for AGIs below $25k, 27.2% for AGIs $25k-50k, 25.9% for AGIs $50k-75k, 190.0% for AGIs $75k-100k, 201.3% for AGIs $100k-200k)
Profit/loss from business: +$12,012 (reported on 11.0% of returns)
Here:
+$12,012
State:
+$22,988
(% of AGI for various income ranges: 39.3% for AGIs below $25k, 141.0% for AGIs $25k-50k, 160.5% for AGIs $50k-75k, 483.3% for AGIs $75k-100k, 308.0% for AGIs $100k-200k)
Taxable individual retirement arrangement distribution: $15,233 (reported on 8.2% of returns)
06330:
$15,233
Connecticut:
$22,031
(% of AGI for various income ranges: 50.3% for AGIs below $25k, 162.4% for AGIs $25k-50k, 330.8% for AGIs $75k-100k, 539.3% for AGIs $100k-200k)
Total itemized deductions: $20,600 (reported on 7.5% of returns)
Here:
$20,600
State:
$37,613
(% of AGI for various income ranges: 328.2% for AGIs $50k-75k, 429.2% for AGIs $75k-100k, 686.0% for AGIs $100k-200k)
Charity contributions: $3,533 (reported on 4.1% of returns)
Here:
$3,533
State:
$13,557
(% of AGI for various income ranges: 32.7% for AGIs $50k-75k, 93.3% for AGIs $100k-200k)
Taxes paid: $7,727 (reported on 7.5% of returns)
06330:
$7,727
State:
$9,096
(% of AGI for various income ranges: 122.7% for AGIs $50k-75k, 200.8% for AGIs $75k-100k, 226.0% for AGIs $100k-200k)
Earned income credit: $2,294 (reported on 12.3% of returns)
Here:
$2,294
State:
$2,059
(% of AGI for various income ranges: 72.7% for AGIs below $25k, 67.2% for AGIs $25k-50k)
Percentage of individuals using paid preparers for their 2020 taxes: 94.5%
Here:
95%
State:
93%
(% for various income ranges: 91.9% for AGIs below $25k, 97.2% for AGIs $25k-50k, 96.3% for AGIs $50k-75k, 94.4% for AGIs $75k-100k, 91.7% for AGIs $100k-200k, 100.0% for AGIs over 200k)
Averages for the 2012 tax year for zip code 06330, filed in 2013:
Average Adjusted Gross Income (AGI) in 2012: $52,962 (Individual Income Tax Returns)
Here:
$52,962
State:
$93,290
Salary/wage: $47,360 (reported on 89.1% of returns)
Here:
$47,360
State:
$73,117
(% of AGI for various income ranges: 73.4% for AGIs below $25k, 85.0% for AGIs $25k-50k, 80.1% for AGIs $50k-75k, 79.4% for AGIs $75k-100k, 78.1% for AGIs $100k-200k)
Taxable interest for individuals: $448 (reported on 45.3% of returns)
This zip code:
$448
Connecticut:
$2,530
(% of AGI for various income ranges: 0.7% for AGIs below $25k, 0.2% for AGIs $25k-50k, 0.4% for AGIs $50k-75k, 0.2% for AGIs $75k-100k, 0.5% for AGIs $100k-200k)
Ordinary dividends: $1,665 (reported on 19.0% of returns)
Here:
$1,665
State:
$10,909
(% of AGI for various income ranges: 1.2% for AGIs below $25k, 0.9% for AGIs $25k-50k, 0.7% for AGIs $50k-75k, 0.5% for AGIs $75k-100k, 0.3% for AGIs $100k-200k)
Profit/loss from business: +$10,250 (reported on 10.2% of returns)
Here:
+$10,250
State:
+$22,741
(% of AGI for various income ranges: 4.2% for AGIs below $25k, 2.1% for AGIs $25k-50k, 1.1% for AGIs $50k-75k, 1.4% for AGIs $75k-100k, 2.2% for AGIs $100k-200k)
Taxable individual retirement arrangement distribution: $11,767 (reported on 6.6% of returns)
06330:
$11,767
Connecticut:
$19,976
(% of AGI for various income ranges: 2.6% for AGIs below $25k, 1.1% for AGIs $25k-50k, 1.6% for AGIs $50k-75k, 3.9% for AGIs $75k-100k)
Total itemized deductions: $20,092 (23% of AGI, reported on 35.0% of returns)
Here:
$20,092
State:
$33,239
Here:
22.8% of AGI
State:
18.9% of AGI
(% of AGI for various income ranges: 9.7% for AGIs below $25k, 9.2% for AGIs $25k-50k, 14.3% for AGIs $50k-75k, 13.9% for AGIs $75k-100k, 15.4% for AGIs $100k-200k)
Charity contributions: $1,758 (reported on 24.1% of returns)
Here:
$1,758
State:
$4,947
(% of AGI for various income ranges: 0.5% for AGIs $25k-50k, 0.7% for AGIs $50k-75k, 1.1% for AGIs $75k-100k, 1.1% for AGIs $100k-200k)
Taxes paid: $8,892 (reported on 35.0% of returns)
06330:
$8,892
State:
$17,397
(% of AGI for various income ranges: 2.2% for AGIs below $25k, 3.1% for AGIs $25k-50k, 5.4% for AGIs $50k-75k, 6.4% for AGIs $75k-100k, 8.3% for AGIs $100k-200k)
Earned income credit: $2,220 (reported on 14.6% of returns)
Here:
$2,220
State:
$2,053
(% of AGI for various income ranges: 5.4% for AGIs below $25k, 0.9% for AGIs $25k-50k)
Percentage of individuals using paid preparers for their 2012 taxes: 44.5%
Here:
45%
State:
55%
(% for various income ranges: 37.8% for AGIs below $25k, 38.9% for AGIs $25k-50k, 52.0% for AGIs $50k-75k, 53.3% for AGIs $75k-100k, 56.2% for AGIs $100k-200k)
Averages for the 2004 tax year for zip code 06330, filed in 2005:
Average Adjusted Gross Income (AGI) in 2004: $43,641 (Individual Income Tax Returns)
Here:
$43,641
State:
$73,265
Salary/wage: $41,690 (reported on 87.5% of returns)
Here:
$41,690
State:
$62,030
(% of AGI for various income ranges: 113.6% for AGIs below $10k, 83.1% for AGIs $10k-25k, 83.6% for AGIs $25k-50k, 83.2% for AGIs $50k-75k, 85.0% for AGIs $75k-100k, 81.0% for AGIs over 100k)
Taxable interest for individuals: $778 (reported on 49.6% of returns)
This zip code:
$778
Connecticut:
$2,287
(% of AGI for various income ranges: 5.9% for AGIs below $10k, 1.7% for AGIs $10k-25k, 0.8% for AGIs $25k-50k, 0.9% for AGIs $50k-75k, 0.5% for AGIs $75k-100k, 0.7% for AGIs over 100k)
Taxable dividends: $1,122 (reported on 22.4% of returns)
Here:
$1,122
State:
$5,735
(% of AGI for various income ranges: 1.5% for AGIs below $10k, 0.4% for AGIs $10k-25k, 0.7% for AGIs $25k-50k, 0.5% for AGIs $50k-75k, 0.6% for AGIs $75k-100k, 0.6% for AGIs over 100k)
Net capital gain/loss: +$6,840 (reported on 14.8% of returns)
Here:
+$6,840
State:
+$23,694
(% of AGI for various income ranges: 0.3% for AGIs below $10k, -0.5% for AGIs $10k-25k, 0.0% for AGIs $25k-50k, 0.1% for AGIs $50k-75k, 2.0% for AGIs $75k-100k, 7.9% for AGIs over 100k)
Profit/loss from business: +$11,439 (reported on 10.6% of returns)
Here:
+$11,439
State:
+$20,783
(% of AGI for various income ranges: 10.0% for AGIs below $10k, 4.2% for AGIs $10k-25k, 3.1% for AGIs $25k-50k, 0.9% for AGIs $50k-75k, 1.5% for AGIs $75k-100k, 4.5% for AGIs over 100k)
IRA payment deduction: $3,000 (reported on 2.5% of returns)
06330:
$3,000
Connecticut:
$3,216
Total itemized deductions: $16,103 (21% of AGI, reported on 33.3% of returns)
Here:
$16,103
State:
$24,919
Here:
21.4% of AGI
State:
18.6% of AGI
(% of AGI for various income ranges: 7.6% for AGIs $10k-25k, 10.6% for AGIs $25k-50k, 12.8% for AGIs $50k-75k, 13.1% for AGIs $75k-100k, 15.0% for AGIs over 100k)
Charity contributions deductions: $1,572 (2% of AGI, reported on 28.5% of returns)
Here:
$1,572
State:
$3,762
Here:
2.0% of AGI
State:
2.7% of AGI
(% of AGI for various income ranges: 0.9% for AGIs $10k-25k, 0.9% for AGIs $25k-50k, 1.0% for AGIs $50k-75k, 1.0% for AGIs $75k-100k, 1.2% for AGIs over 100k)
Total tax: $5,467 (reported on 78.3% of returns)
06330:
$5,467
State:
$15,148
(% of AGI for various income ranges: 3.3% for AGIs below $10k, 4.7% for AGIs $10k-25k, 7.0% for AGIs $25k-50k, 9.0% for AGIs $50k-75k, 10.4% for AGIs $75k-100k, 14.9% for AGIs over 100k)
Earned income credit: $1,547 (reported on 11.4% of returns)
Here:
$1,547
State:
$1,570
Percentage of individuals using paid preparers for their 2004 taxes: 50.3%
Here:
50%
State:
59%
(% for various income ranges: 34.4% for AGIs below $10k, 49.6% for AGIs $10k-25k, 51.7% for AGIs $25k-50k, 54.3% for AGIs $50k-75k, 57.2% for AGIs $75k-100k, 65.3% for AGIs over 100k)
Household received Food Stamps/SNAP in the past 12 months: 126 Household did not receive Food Stamps/SNAP in the past 12 months: 1,088
Women who had a birth in the past 12 months: 17 (16 now married, 0 unmarried) Women who did not have a birth in the past 12 months: 615 (251 now married, 361 unmarried)
Housing units in zip code 06330 with a mortgage: 499 (58 second mortgage, 49 both second mortgage and home equity loan) Median monthly owner costs for units with a mortgage: $1,957 Median monthly owner costs for units without a mortgage: $785
Residents with income below the poverty level in 2022:
This zip code:
11.0%
Whole state:
9.8%
Residents with income below 50% of the poverty level in 2022:
This zip code:
7.0%
Whole state:
4.8%
Median number of rooms in houses and condos:
Here:
6.2
State:
6.5
Median number of rooms in apartments:
Here:
4.7
State:
4.0
Notable locations in this zip code not listed on our city pages
Notable locations in zip code 06330: Highland Campground (A), Pautipaug Golf Course and Country Club (B), Baltic Fire Department (C). Display/hide their locations on the map
Churches in zip code 06330 include: Baltic United Methodist Church (A), Hanover Congregational Church (B), Saint Marys Roman Catholic Church (C), Versailles United Methodist Church (D). Display/hide their locations on the map
577 married couples with children.
76 single-parent households (60 men, 16 women).
94.0% of residents of 06330 zip code speak English at home.
2.2% of residents speak Spanish at home (60% very well, 40% well).
1.8% of residents speak other Indo-European language at home (44% very well, 56% well).
0.7% of residents speak other language at home (52% very well, 48% well).
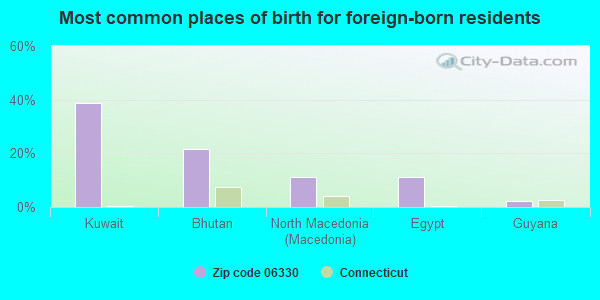
Foreign born population: 89 (2.7%) (60.3% of them are naturalized citizens)
This zip code:
2.7%
Whole state:
15.7%
39%Kuwait
22%Bhutan
11%North Macedonia (Macedonia)
11%Egypt
2%Guyana
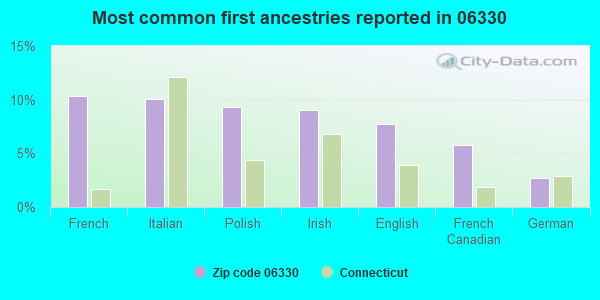
10%French
10%Italian
9%Polish
9%Irish
8%English
6%French Canadian
3%German
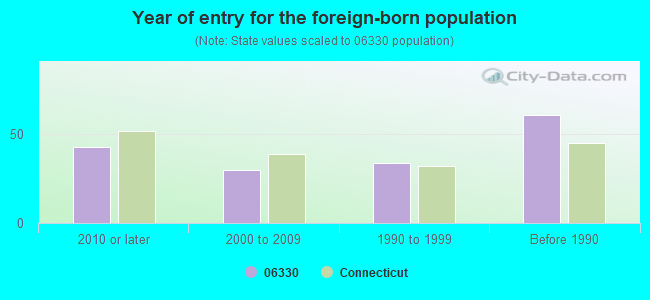
Year of entry for the foreign-born population
432010 or later
302000 to 2009
341990 to 1999
61Before 1990
Facilities with environmental interests located in this zip code:
HANOVER PARK (ADDRESS NOT IN SDWIS OR ICIS in SPRAGUE, CT)
(Integrated Compliance Information System) - ICIS-01-2000-0130, FORMAL ENFORCEMENT ACTION COMMUNITY WATER SYSTEM (SDWIS)
HOMEBOUND (10 SCOTLAND ROAD in BALTIC, CT)
(National Center for Education Statistics) - STATE ID-88 Organizations: SPRAGUE SCHOOL DISTRICT (SCHOOL DISTRICT)
BALTIC MILLS (BUSHNELL HOLLOW RD. in BALTIC, CT)
COMPLIANCE ACTIVITY (Tracking inspections of insecticide, fungicide, and rodenticide, and toxic substances) Alternative names: BAULTIC MILLS ASSOCIATES PARTNERSHIP
ACADEMY OF THE HOLY FAMILY (54 WEST MAIN STREET in BALTIC, CT)
COMPLIANCE ACTIVITY (Tracking inspections of insecticide, fungicide, and rodenticide, and toxic substances)
Housing units lacking complete plumbing facilities: 3.8% Housing units lacking complete kitchen facilities: 3.3%
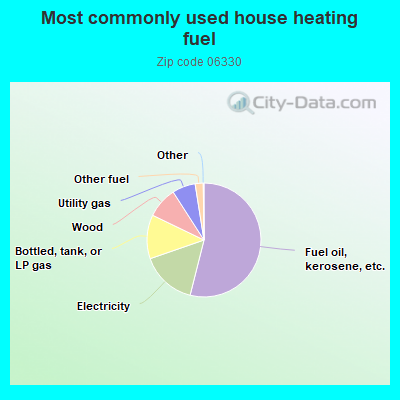
54.1%Fuel oil, kerosene, etc.
15.8%Electricity
12.5%Bottled, tank, or LP gas
8.8%Wood
6.6%Utility gas
2.3%Other fuel
Population in 1990: 3,188. Population change in the 1990s: +577 (+18.1%).
Place of birth for U.S.-born residents:
This state: 2,350
Northeast: 600
Midwest: 28
South: 105
West: 26
66% of the 06330 zip code residents lived in the same house 5 years ago. Out of people who lived in different houses, 70% lived in this county. Out of people who lived in different counties, 50% lived in Connecticut.
92% of the 06330 zip code residents lived in the same house 1 year ago. Out of people who lived in different houses, 46% moved from this county. Out of people who lived in different houses, 21% moved from different county within same state. Out of people who lived in different houses, 17% moved from different state. Out of people who lived in different houses, 11% moved from abroad.
Private vs. public school enrollment:
Students in private schools in grades 1 to 8 (elementary and middle school): 19
Here:
5.2%
Connecticut:
9.5%
Students in private schools in grades 9 to 12 (high school):
Here:
0.0%
Connecticut:
12.9%
Students in private undergraduate colleges: 8
Here:
13.9%
Connecticut:
35.5%
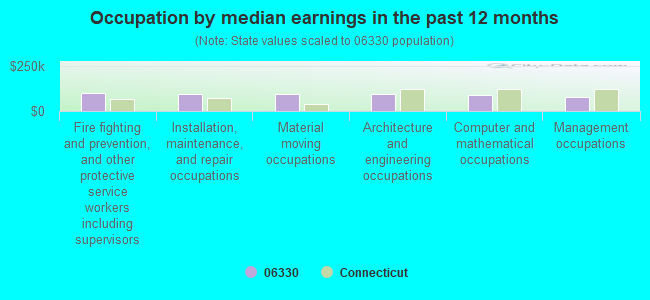
Occupation by median earnings in the past 12 months ($)
100,312Fire fighting and prevention, and other protective service workers including supervisors
96,637Installation, maintenance, and repair occupations
94,334Material moving occupations
93,402Architecture and engineering occupations
87,849Computer and mathematical occupations
76,280Management occupations
Top industries in this zip code by the number of employees in 2005:
Health Care and Social Assistance: Offices of Physical, Occupational and Speech Therapists, and Audiologists (20-49 employees: 1 establishment)
Arts, Entertainment, and Recreation: Golf Courses and Country Clubs (20-49: 1)
Construction: Commercial and Institutional Building Construction (20-49: 1)
Construction: Other Building Equipment Contractors (20-49: 1)
Educational Services: Sports and Recreation Instruction (20-49: 1)
Educational Services: Elementary and Secondary Schools (10-19: 2)
Administrative and Support and Waste Management and Remediation Services: Remediation Services (10-19: 1)
Accommodation and Food Services: Full-Service Restaurants (5-9: 1, 1-4: 2)
People in group quarters in 2000:
49 people in religious group quarters
Fatal accident statistics in 2014:
Fatal accident count: 1
Vehicles involved in fatal accidents: 2
Fatal accidents caused by drunken drivers: 0
Fatalities: 1
Persons involved in fatal accidents: 4
Pedestrians involved in fatal accidents: 0
Fatal accident statistics in 2012:
Fatal accident count: 1
Vehicles involved in fatal accidents: 1
Fatal accidents caused by drunken drivers: 0
Fatalities: 1
Persons involved in fatal accidents: 1
Pedestrians involved in fatal accidents: 0
Home Mortgage Disclosure Act Aggregated Statistics For Year 2009 (Based on 6 partial tracts)
A) FHA, FSA/RHS & VA Home Purchase Loans
B) Conventional Home Purchase Loans
C) Refinancings
D) Home Improvement Loans
F) Non-occupant Loans on < 5 Family Dwellings (A B C & D)
G) Loans On Manufactured Home Dwelling (A B C & D)
Number
Average Value
Number
Average Value
Number
Average Value
Number
Average Value
Number
Average Value
Number
Average Value
LOANS ORIGINATED
30
$171,342
30
$160,871
135
$179,087
44
$81,058
4
$105,925
1
$17,970
APPLICATIONS APPROVED, NOT ACCEPTED
1
$181,290
4
$173,700
13
$207,538
2
$196,065
0
$0
0
$0
APPLICATIONS DENIED
2
$224,870
10
$153,506
45
$186,592
8
$22,896
6
$96,457
0
$0
APPLICATIONS WITHDRAWN
8
$149,329
2
$215,070
29
$173,074
2
$210,185
0
$0
0
$0
FILES CLOSED FOR INCOMPLETENESS
0
$0
0
$0
8
$171,195
0
$0
0
$0
0
$0
Aggregated Statistics For Year 2008 (Based on 6 partial tracts)
A) FHA, FSA/RHS & VA Home Purchase Loans
B) Conventional Home Purchase Loans
C) Refinancings
D) Home Improvement Loans
F) Non-occupant Loans on < 5 Family Dwellings (A B C & D)
Number
Average Value
Number
Average Value
Number
Average Value
Number
Average Value
Number
Average Value
LOANS ORIGINATED
27
$197,940
43
$170,509
71
$188,572
48
$79,956
13
$154,311
APPLICATIONS APPROVED, NOT ACCEPTED
4
$224,528
4
$178,842
9
$206,157
8
$69,899
4
$206,272
APPLICATIONS DENIED
0
$0
20
$162,808
66
$215,086
24
$99,761
6
$130,085
APPLICATIONS WITHDRAWN
2
$151,535
2
$107,535
34
$169,562
8
$95,482
2
$202,010
FILES CLOSED FOR INCOMPLETENESS
0
$0
0
$0
5
$283,224
0
$0
1
$100,170
Aggregated Statistics For Year 2007 (Based on 6 partial tracts)
A) FHA, FSA/RHS & VA Home Purchase Loans
B) Conventional Home Purchase Loans
C) Refinancings
D) Home Improvement Loans
F) Non-occupant Loans on < 5 Family Dwellings (A B C & D)
G) Loans On Manufactured Home Dwelling (A B C & D)
Number
Average Value
Number
Average Value
Number
Average Value
Number
Average Value
Number
Average Value
Number
Average Value
LOANS ORIGINATED
16
$200,070
56
$179,748
127
$167,677
78
$72,632
9
$146,112
0
$0
APPLICATIONS APPROVED, NOT ACCEPTED
2
$181,410
7
$190,771
14
$228,896
2
$21,010
2
$255,310
0
$0
APPLICATIONS DENIED
0
$0
29
$161,957
107
$194,584
37
$73,238
14
$171,658
1
$57,710
APPLICATIONS WITHDRAWN
0
$0
3
$170,457
61
$166,860
6
$86,568
2
$172,060
0
$0
FILES CLOSED FOR INCOMPLETENESS
0
$0
2
$238,750
6
$237,163
0
$0
0
$0
0
$0
Aggregated Statistics For Year 2006 (Based on 6 partial tracts)
A) FHA, FSA/RHS & VA Home Purchase Loans
B) Conventional Home Purchase Loans
C) Refinancings
D) Home Improvement Loans
F) Non-occupant Loans on < 5 Family Dwellings (A B C & D)
G) Loans On Manufactured Home Dwelling (A B C & D)
Number
Average Value
Number
Average Value
Number
Average Value
Number
Average Value
Number
Average Value
Number
Average Value
LOANS ORIGINATED
17
$196,255
102
$159,106
172
$160,713
72
$80,392
26
$160,596
0
$0
APPLICATIONS APPROVED, NOT ACCEPTED
0
$0
23
$158,125
26
$141,792
5
$37,524
2
$161,305
0
$0
APPLICATIONS DENIED
2
$233,645
43
$135,825
89
$188,697
36
$78,649
11
$162,242
0
$0
APPLICATIONS WITHDRAWN
0
$0
14
$155,989
82
$168,474
13
$65,507
10
$153,630
0
$0
FILES CLOSED FOR INCOMPLETENESS
0
$0
0
$0
18
$187,609
0
$0
0
$0
2
$14,665
Aggregated Statistics For Year 2005 (Based on 6 partial tracts)
A) FHA, FSA/RHS & VA Home Purchase Loans
B) Conventional Home Purchase Loans
C) Refinancings
D) Home Improvement Loans
F) Non-occupant Loans on < 5 Family Dwellings (A B C & D)
G) Loans On Manufactured Home Dwelling (A B C & D)
Number
Average Value
Number
Average Value
Number
Average Value
Number
Average Value
Number
Average Value
Number
Average Value
LOANS ORIGINATED
8
$196,564
164
$164,668
182
$158,691
68
$77,191
28
$116,431
3
$32,163
APPLICATIONS APPROVED, NOT ACCEPTED
0
$0
11
$177,807
33
$145,548
13
$45,230
2
$162,750
0
$0
APPLICATIONS DENIED
0
$0
35
$109,150
112
$159,304
43
$66,617
6
$153,483
4
$166,228
APPLICATIONS WITHDRAWN
0
$0
35
$126,285
108
$166,063
14
$124,086
9
$208,313
0
$0
FILES CLOSED FOR INCOMPLETENESS
0
$0
8
$148,798
18
$149,266
0
$0
2
$327,495
0
$0
Aggregated Statistics For Year 2004 (Based on 6 partial tracts)
A) FHA, FSA/RHS & VA Home Purchase Loans
B) Conventional Home Purchase Loans
C) Refinancings
D) Home Improvement Loans
E) Loans on Dwellings For 5+ Families
F) Non-occupant Loans on < 5 Family Dwellings (A B C & D)
G) Loans On Manufactured Home Dwelling (A B C & D)
Number
Average Value
Number
Average Value
Number
Average Value
Number
Average Value
Number
Average Value
Number
Average Value
Number
Average Value
LOANS ORIGINATED
13
$153,299
114
$160,001
211
$129,349
93
$67,224
4
$406,682
31
$120,028
1
$20,690
APPLICATIONS APPROVED, NOT ACCEPTED
0
$0
6
$96,425
33
$136,478
12
$32,816
0
$0
0
$0
0
$0
APPLICATIONS DENIED
2
$162,635
29
$147,922
88
$143,113
25
$69,152
0
$0
9
$122,488
1
$48,180
APPLICATIONS WITHDRAWN
0
$0
19
$158,039
97
$131,302
14
$83,722
0
$0
1
$54,710
0
$0
FILES CLOSED FOR INCOMPLETENESS
0
$0
0
$0
7
$203,163
0
$0
0
$0
2
$127,090
0
$0
Aggregated Statistics For Year 2003 (Based on 6 partial tracts)
A) FHA, FSA/RHS & VA Home Purchase Loans
B) Conventional Home Purchase Loans
C) Refinancings
D) Home Improvement Loans
E) Loans on Dwellings For 5+ Families
F) Non-occupant Loans on < 5 Family Dwellings (A B C & D)
Number
Average Value
Number
Average Value
Number
Average Value
Number
Average Value
Number
Average Value
Number
Average Value
LOANS ORIGINATED
10
$143,538
95
$139,924
381
$124,987
51
$27,851
2
$391,040
18
$103,926
APPLICATIONS APPROVED, NOT ACCEPTED
0
$0
7
$122,906
30
$127,804
1
$16,330
0
$0
2
$78,210
APPLICATIONS DENIED
2
$143,705
15
$144,348
125
$123,804
19
$32,526
0
$0
16
$80,896
APPLICATIONS WITHDRAWN
0
$0
16
$120,388
93
$131,506
9
$33,030
0
$0
1
$90,910
FILES CLOSED FOR INCOMPLETENESS
0
$0
2
$149,460
8
$102,334
1
$17,150
0
$0
2
$78,255
Aggregated Statistics For Year 2002 (Based on 6 partial tracts)
A) FHA, FSA/RHS & VA Home Purchase Loans
B) Conventional Home Purchase Loans
C) Refinancings
D) Home Improvement Loans
E) Loans on Dwellings For 5+ Families
F) Non-occupant Loans on < 5 Family Dwellings (A B C & D)
Number
Average Value
Number
Average Value
Number
Average Value
Number
Average Value
Number
Average Value
Number
Average Value
LOANS ORIGINATED
12
$141,208
113
$136,794
204
$107,452
52
$31,975
2
$235,205
17
$70,278
APPLICATIONS APPROVED, NOT ACCEPTED
0
$0
6
$121,347
21
$103,333
4
$55,815
0
$0
0
$0
APPLICATIONS DENIED
2
$118,570
16
$81,679
52
$95,570
17
$23,779
0
$0
2
$91,000
APPLICATIONS WITHDRAWN
0
$0
11
$153,722
51
$100,245
11
$50,576
0
$0
2
$170,100
FILES CLOSED FOR INCOMPLETENESS
2
$139,795
5
$108,602
7
$111,769
0
$0
0
$0
0
$0
Aggregated Statistics For Year 2001 (Based on 6 partial tracts)
A) FHA, FSA/RHS & VA Home Purchase Loans
B) Conventional Home Purchase Loans
C) Refinancings
D) Home Improvement Loans
F) Non-occupant Loans on < 5 Family Dwellings (A B C & D)
Number
Average Value
Number
Average Value
Number
Average Value
Number
Average Value
Number
Average Value
LOANS ORIGINATED
21
$130,242
69
$126,297
170
$100,563
45
$26,438
23
$92,252
APPLICATIONS APPROVED, NOT ACCEPTED
2
$117,905
4
$84,400
18
$107,252
2
$20,270
1
$75,130
APPLICATIONS DENIED
1
$111,060
16
$120,575
65
$80,322
20
$30,600
2
$100,695
APPLICATIONS WITHDRAWN
0
$0
6
$136,425
49
$88,597
8
$22,521
2
$136,060
FILES CLOSED FOR INCOMPLETENESS
0
$0
0
$0
9
$63,837
2
$29,330
0
$0
Aggregated Statistics For Year 2000 (Based on 6 partial tracts)
A) FHA, FSA/RHS & VA Home Purchase Loans
B) Conventional Home Purchase Loans
C) Refinancings
D) Home Improvement Loans
F) Non-occupant Loans on < 5 Family Dwellings (A B C & D)
Number
Average Value
Number
Average Value
Number
Average Value
Number
Average Value
Number
Average Value
LOANS ORIGINATED
26
$111,106
40
$95,917
52
$68,315
63
$32,971
6
$68,485
APPLICATIONS APPROVED, NOT ACCEPTED
0
$0
5
$65,050
12
$60,740
11
$17,297
0
$0
APPLICATIONS DENIED
12
$107,307
10
$109,592
44
$81,991
15
$22,369
4
$46,925
APPLICATIONS WITHDRAWN
4
$82,118
5
$63,462
35
$87,956
9
$58,889
2
$102,650
FILES CLOSED FOR INCOMPLETENESS
0
$0
0
$0
6
$110,130
0
$0
0
$0
Aggregated Statistics For Year 1999 (Based on 3 partial tracts)
A) FHA, FSA/RHS & VA Home Purchase Loans
B) Conventional Home Purchase Loans
C) Refinancings
D) Home Improvement Loans
E) Loans on Dwellings For 5+ Families
F) Non-occupant Loans on < 5 Family Dwellings (A B C & D)
Detailed PMIC statistics for the following Tracts:7101.00
, 7111.00
2002 - 2018 National Fire Incident Reporting System (NFIRS) incidents
According to the data from the years 2002 - 2018 the average number of fires per year is 12. The highest number of fires - 27 took place in 2018, and the least - 2 in 2006. The data has an increasing trend.
When looking into fire subcategories, the most incidents belonged to: Structure Fires (46.0%), and Outside Fires (25.2%).
Fire incident types reported to NFIRS in Zip Code 06330


 Nearest zip codes: 06350, 06264, 06254, 06280, 06380, 06389.


 According to the data from the years 2002 - 2018 the average number of fires per year is 12. The highest number of fires - 27 took place in 2018, and the least - 2 in 2006. The data has an increasing trend.
 When looking into fire subcategories, the most incidents belonged to: Structure Fires (46.0%), and Outside Fires (25.2%).