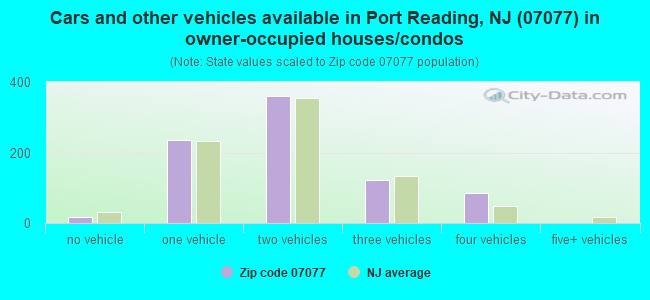
Estimated zip code population in 2022: 2,698 Zip code population in 2010: 2,766 Zip code population in 2000: 2,781
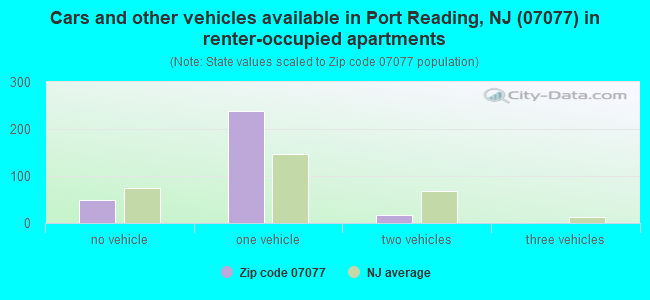
Houses and condos: 1,144 Renter-occupied apartments: 298
% of renters here:
27%
State:
35%
March 2022 cost of living index in zip code 07077: 117.6 (more than average, U.S. average is 100)
Land area: 1.5 sq. mi. Water area: 0.6 sq. mi.
Population density: 1,741 people per square mile
(low).
OSM Map
Google Map
MSN Map
OSM Map
General Map
Google Map
MSN Map
OSM Map
Google Map
MSN Map
OSM Map
Google Map
MSN Map
Please wait while loading the map...
Real estate property taxes paid for housing units in 2022:
This zip code:
2.3% ($8,952)
New Jersey:
2.1% ($8,897)
Median real estate property taxes paid for housing units with mortgages in 2022: $9,327 (2.2%) Median real estate property taxes paid for housing units with no mortgage in 2022: $8,379 (2.5%)
Business Search- 14 Million verified businesses
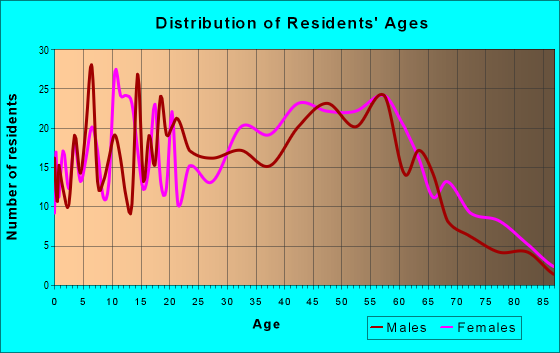
Males: 1,384
(51.3%)
Females: 1,314
(48.7%)
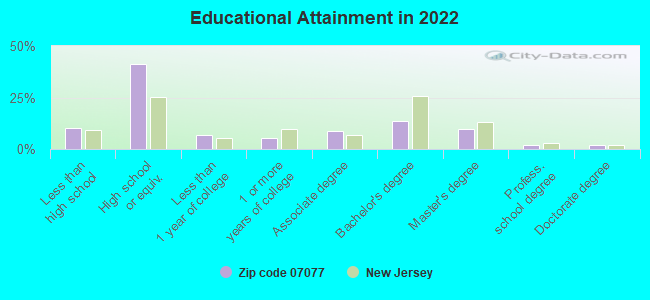
For population 25 years and over in 07077:
High school or higher: 89.9%
Bachelor's degree or higher: 27.4%
Graduate or professional degree: 13.9%
Unemployed: 5.3%
Mean travel time to work (commute): 29.2 minutes
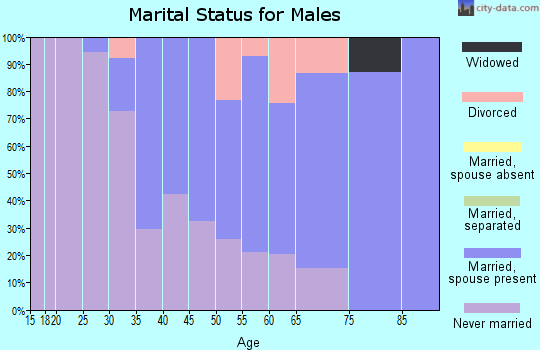
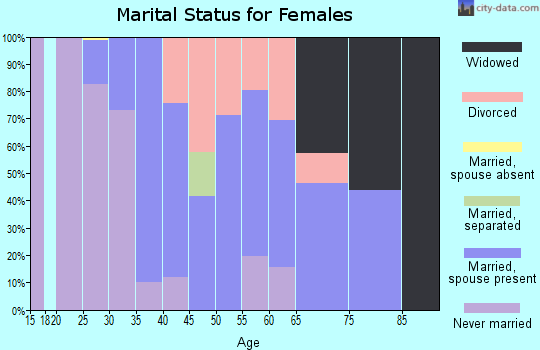
For population 15 years and over in 07077:
Never married: 18.2%
Now married: 59.2%
Separated: 3.2%
Widowed: 5.2%
Divorced: 14.2%
Zip code 07077 compared to state average:
Median age significantly above state average.
Length of stay since moving in significantly above state average.
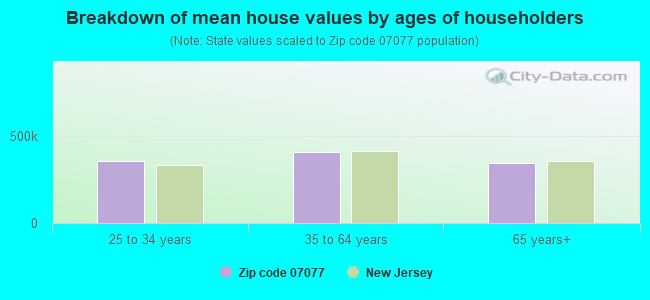
Estimated median house/condo value in 2022: $384,984
07077:
$384,984
New Jersey:
$428,900
According to our research of New Jersey and other state lists, there were 2 registered sex offenders living in 07077 zip code as of April 24, 2024. The ratio of all residents to sex offenders in zip code 07077 is 1,220 to 1.
Median resident age:
This zip code:
48.6 years
New Jersey median age:
40.4 years
Average household size:
This zip code:
2.4 people
New Jersey:
2.6 people
Averages for the 2020 tax year for zip code 07077, filed in 2021:
Average Adjusted Gross Income (AGI) in 2020: $66,691 (Individual Income Tax Returns)
Here:
$66,691
State:
$95,247
Salary/wage: $60,135 (reported on 81.9% of returns)
Here:
$60,135
State:
$80,635
(% of AGI for various income ranges: 987.3% for AGIs below $25k, 3585.9% for AGIs $25k-50k, 6686.9% for AGIs $50k-75k, 9935.0% for AGIs $75k-100k, 18017.1% for AGIs $100k-200k)
Taxable interest for individuals: $1,078 (reported on 26.8% of returns)
This zip code:
$1,078
New Jersey:
$2,414
(% of AGI for various income ranges: 18.7% for AGIs below $25k, 13.3% for AGIs $25k-50k, 20.6% for AGIs $50k-75k, 32.5% for AGIs $75k-100k, 47.1% for AGIs $100k-200k)
Ordinary dividends: $2,419 (reported on 17.4% of returns)
Here:
$2,419
State:
$8,057
(% of AGI for various income ranges: 11.0% for AGIs below $25k, 23.3% for AGIs $25k-50k, 58.8% for AGIs $50k-75k, 40.0% for AGIs $75k-100k, 128.8% for AGIs $100k-200k)
Net capital gain/loss in AGI: +$16,528 (reported on 12.1% of returns)
Here:
+$16,528
State:
+$25,022
(% of AGI for various income ranges: 8.0% for AGIs below $25k, 17.0% for AGIs $25k-50k, 93.1% for AGIs $50k-75k, 291.2% for AGIs $100k-200k)
Profit/loss from business: +$9,568 (reported on 14.8% of returns)
Here:
+$9,568
State:
+$18,035
(% of AGI for various income ranges: 95.7% for AGIs below $25k, 140.7% for AGIs $25k-50k, 188.1% for AGIs $50k-75k, 171.7% for AGIs $75k-100k, 547.6% for AGIs $100k-200k)
Taxable individual retirement arrangement distribution: $17,800 (reported on 6.7% of returns)
07077:
$17,800
New Jersey:
$21,558
(% of AGI for various income ranges: 115.3% for AGIs below $25k, 371.9% for AGIs $50k-75k, 493.5% for AGIs $100k-200k)
Total itemized deductions: $23,768 (reported on 16.8% of returns)
Here:
$23,768
State:
$32,863
(% of AGI for various income ranges: 380.4% for AGIs $25k-50k, 663.8% for AGIs $50k-75k, 1135.8% for AGIs $75k-100k, 1464.7% for AGIs $100k-200k)
Charity contributions: $4,174 (reported on 12.8% of returns)
Here:
$4,174
State:
$7,880
(% of AGI for various income ranges: 41.5% for AGIs $25k-50k, 76.2% for AGIs $50k-75k, 136.7% for AGIs $75k-100k, 232.4% for AGIs $100k-200k)
Taxes paid: $8,912 (reported on 16.8% of returns)
07077:
$8,912
State:
$9,183
(% of AGI for various income ranges: 146.7% for AGIs $25k-50k, 268.8% for AGIs $50k-75k, 463.3% for AGIs $75k-100k, 497.6% for AGIs $100k-200k)
Earned income credit: $2,029 (reported on 11.4% of returns)
Here:
$2,029
State:
$2,148
(% of AGI for various income ranges: 68.3% for AGIs below $25k, 51.9% for AGIs $25k-50k)
Percentage of individuals using paid preparers for their 2020 taxes: 92.6%
Here:
93%
State:
92%
(% for various income ranges: 93.0% for AGIs below $25k, 91.2% for AGIs $25k-50k, 95.7% for AGIs $50k-75k, 94.1% for AGIs $75k-100k, 89.3% for AGIs $100k-200k, 100.0% for AGIs over 200k)
Averages for the 2012 tax year for zip code 07077, filed in 2013:
Average Adjusted Gross Income (AGI) in 2012: $58,889 (Individual Income Tax Returns)
Here:
$58,889
State:
$79,688
Salary/wage: $53,970 (reported on 86.7% of returns)
Here:
$53,970
State:
$68,122
(% of AGI for various income ranges: 68.5% for AGIs below $25k, 78.3% for AGIs $25k-50k, 81.3% for AGIs $50k-75k, 80.5% for AGIs $75k-100k, 80.2% for AGIs $100k-200k)
Taxable interest for individuals: $717 (reported on 36.4% of returns)
This zip code:
$717
New Jersey:
$2,193
(% of AGI for various income ranges: 1.0% for AGIs below $25k, 0.7% for AGIs $25k-50k, 0.4% for AGIs $50k-75k, 0.2% for AGIs $75k-100k, 0.4% for AGIs $100k-200k)
Ordinary dividends: $1,903 (reported on 21.0% of returns)
Here:
$1,903
State:
$6,828
(% of AGI for various income ranges: 1.3% for AGIs below $25k, 1.2% for AGIs $25k-50k, 1.1% for AGIs $50k-75k, 0.3% for AGIs $75k-100k, 0.4% for AGIs $100k-200k)
Net capital gain/loss in AGI: +$983 (reported on 12.6% of returns)
Here:
+$983
State:
+$15,358
(% of AGI for various income ranges: 0.5% for AGIs $100k-200k)
Profit/loss from business: +$9,031 (reported on 11.2% of returns)
Here:
+$9,031
State:
+$19,577
(% of AGI for various income ranges: 6.6% for AGIs below $25k, 3.9% for AGIs $25k-50k, 1.5% for AGIs $50k-75k, 1.2% for AGIs $100k-200k)
Taxable individual retirement arrangement distribution: $18,700 (reported on 8.4% of returns)
07077:
$18,700
New Jersey:
$18,214
(% of AGI for various income ranges: 2.9% for AGIs below $25k, 5.4% for AGIs $25k-50k, 3.9% for AGIs $75k-100k, 2.4% for AGIs $100k-200k)
Total itemized deductions: $23,494 (26% of AGI, reported on 46.2% of returns)
Here:
$23,494
State:
$30,827
Here:
26.3% of AGI
State:
21.2% of AGI
(% of AGI for various income ranges: 14.8% for AGIs below $25k, 13.6% for AGIs $25k-50k, 18.0% for AGIs $50k-75k, 19.2% for AGIs $75k-100k, 20.4% for AGIs $100k-200k)
Charity contributions: $2,198 (reported on 37.8% of returns)
Here:
$2,198
State:
$3,451
(% of AGI for various income ranges: 0.7% for AGIs below $25k, 0.9% for AGIs $25k-50k, 1.4% for AGIs $50k-75k, 1.5% for AGIs $75k-100k, 1.6% for AGIs $100k-200k)
Taxes paid: $10,632 (reported on 46.2% of returns)
07077:
$10,632
State:
$15,801
(% of AGI for various income ranges: 6.4% for AGIs below $25k, 5.6% for AGIs $25k-50k, 7.9% for AGIs $50k-75k, 8.8% for AGIs $75k-100k, 9.5% for AGIs $100k-200k)
Earned income credit: $1,906 (reported on 11.2% of returns)
Here:
$1,906
State:
$2,182
(% of AGI for various income ranges: 4.2% for AGIs below $25k, 0.7% for AGIs $25k-50k)
Percentage of individuals using paid preparers for their 2012 taxes: 65.0%
Here:
65%
State:
65%
(% for various income ranges: 61.4% for AGIs below $25k, 61.3% for AGIs $25k-50k, 68.0% for AGIs $50k-75k, 73.7% for AGIs $75k-100k, 66.7% for AGIs $100k-200k)
Averages for the 2004 tax year for zip code 07077, filed in 2005:
Average Adjusted Gross Income (AGI) in 2004: $49,685 (Individual Income Tax Returns)
Here:
$49,685
State:
$64,921
Salary/wage: $49,279 (reported on 86.8% of returns)
Here:
$49,279
State:
$57,755
(% of AGI for various income ranges: 81.0% for AGIs below $10k, 69.2% for AGIs $10k-25k, 88.2% for AGIs $25k-50k, 85.3% for AGIs $50k-75k, 89.0% for AGIs $75k-100k, 87.5% for AGIs over 100k)
Taxable interest for individuals: $766 (reported on 52.0% of returns)
This zip code:
$766
New Jersey:
$2,068
(% of AGI for various income ranges: 5.4% for AGIs below $10k, 3.2% for AGIs $10k-25k, 0.9% for AGIs $25k-50k, 0.6% for AGIs $50k-75k, 0.3% for AGIs $75k-100k, 0.5% for AGIs over 100k)
Taxable dividends: $1,216 (reported on 26.5% of returns)
Here:
$1,216
State:
$3,959
(% of AGI for various income ranges: 5.8% for AGIs below $10k, 1.3% for AGIs $10k-25k, 1.3% for AGIs $25k-50k, 0.5% for AGIs $50k-75k, 0.2% for AGIs $75k-100k, 0.3% for AGIs over 100k)
Net capital gain/loss: +$1,651 (reported on 17.0% of returns)
Here:
+$1,651
State:
+$13,591
(% of AGI for various income ranges: -2.0% for AGIs below $10k, -0.4% for AGIs $10k-25k, -0.3% for AGIs $25k-50k, 0.6% for AGIs $50k-75k, -0.3% for AGIs $75k-100k, 1.8% for AGIs over 100k)
Profit/loss from business: +$9,108 (reported on 9.4% of returns)
Here:
+$9,108
State:
+$17,520
(% of AGI for various income ranges: 8.8% for AGIs below $10k, 4.5% for AGIs $10k-25k, 2.1% for AGIs $25k-50k, 1.4% for AGIs $50k-75k, 1.7% for AGIs $75k-100k, 0.9% for AGIs over 100k)
IRA payment deduction: $3,341 (reported on 3.2% of returns)
07077:
$3,341
New Jersey:
$3,270
Total itemized deductions: $19,441 (26% of AGI, reported on 48.2% of returns)
Here:
$19,441
State:
$23,924
Here:
26.4% of AGI
State:
21.1% of AGI
(% of AGI for various income ranges: 19.4% for AGIs below $10k, 14.2% for AGIs $10k-25k, 16.9% for AGIs $25k-50k, 21.1% for AGIs $50k-75k, 20.1% for AGIs $75k-100k, 18.4% for AGIs over 100k)
Charity contributions deductions: $2,197 (3% of AGI, reported on 44.5% of returns)
Here:
$2,197
State:
$3,242
Here:
2.9% of AGI
State:
2.7% of AGI
(% of AGI for various income ranges: 0.9% for AGIs below $10k, 0.7% for AGIs $10k-25k, 2.2% for AGIs $25k-50k, 2.1% for AGIs $50k-75k, 2.0% for AGIs $75k-100k, 2.0% for AGIs over 100k)
Total tax: $6,401 (reported on 80.3% of returns)
07077:
$6,401
State:
$12,321
(% of AGI for various income ranges: 2.6% for AGIs below $10k, 4.2% for AGIs $10k-25k, 7.5% for AGIs $25k-50k, 9.0% for AGIs $50k-75k, 9.8% for AGIs $75k-100k, 14.6% for AGIs over 100k)
Earned income credit: $1,254 (reported on 8.8% of returns)
Here:
$1,254
State:
$1,711
Percentage of individuals using paid preparers for their 2004 taxes: 66.3%
Here:
66%
State:
65%
(% for various income ranges: 54.3% for AGIs below $10k, 62.5% for AGIs $10k-25k, 67.4% for AGIs $25k-50k, 71.4% for AGIs $50k-75k, 70.7% for AGIs $75k-100k, 75.3% for AGIs over 100k)
Likely homosexual households (counted as self-reported same-sex unmarried-partner households)
Lesbian couples: 2.5% of all households
Gay men: 0.0% of all households
Household received Food Stamps/SNAP in the past 12 months: 40 Household did not receive Food Stamps/SNAP in the past 12 months: 1,060
Women who had a birth in the past 12 months: 12 (13 now married, 0 unmarried) Women who did not have a birth in the past 12 months: 520 (294 now married, 223 unmarried)
Housing units in zip code 07077 with a mortgage: 508 (14 second mortgage, 6 both second mortgage and home equity loan) Houses without a mortgage: 14
Median monthly owner costs for units with a mortgage: $2,536 Median monthly owner costs for units without a mortgage: $1,023
Residents with income below the poverty level in 2022:
This zip code:
4.2%
Whole state:
9.7%
Residents with income below 50% of the poverty level in 2022:
This zip code:
0.7%
Whole state:
5.2%
Median number of rooms in houses and condos:
Here:
6.9
State:
6.8
Median number of rooms in apartments:
Here:
4.2
State:
3.9
Notable locations in this zip code not listed on our city pages
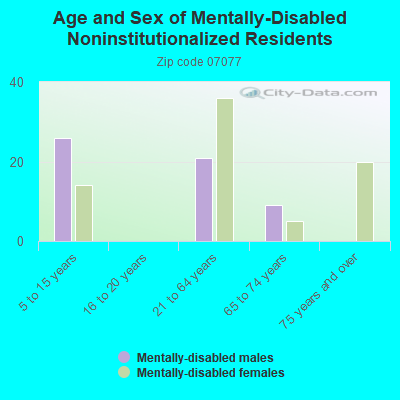
In group quarters: 15 (-1 institutionalized population)
Size of family households: 104 2-persons, 275 3-persons, 132 4-persons, 92 5-persons, 27 6-persons
Size of nonfamily households: 421 1-person, 52 2-persons
439 married couples with children.
32 single-parent households (32 women).
69.6% of residents of 07077 zip code speak English at home.
19.9% of residents speak Spanish at home (61% very well, 21% well, 18% not well).
9.9% of residents speak other Indo-European language at home (42% very well, 58% well).
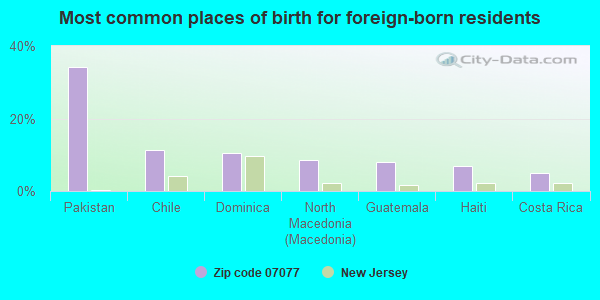
Foreign born population: 591 (21.9%) (85.1% of them are naturalized citizens)
This zip code:
21.9%
Whole state:
23.5%
34%Pakistan
11%Chile
10%Dominica
9%North Macedonia (Macedonia)
8%Guatemala
7%Haiti
5%Costa Rica
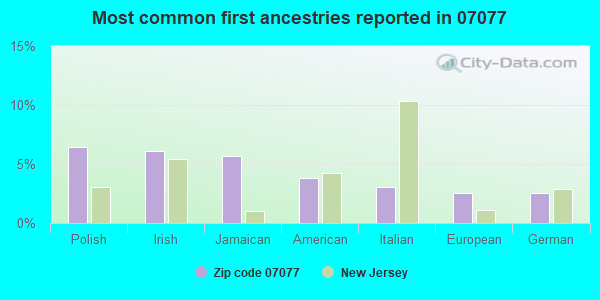
6%Polish
6%Irish
6%Jamaican
4%American
3%Italian
3%European
3%German
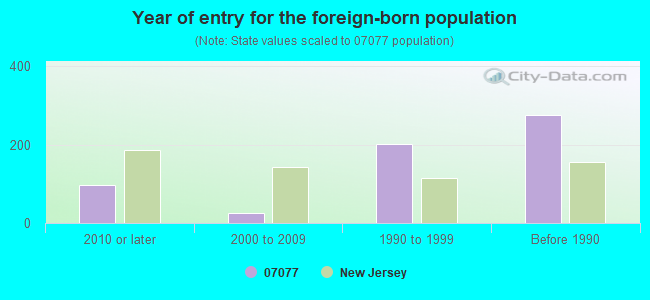
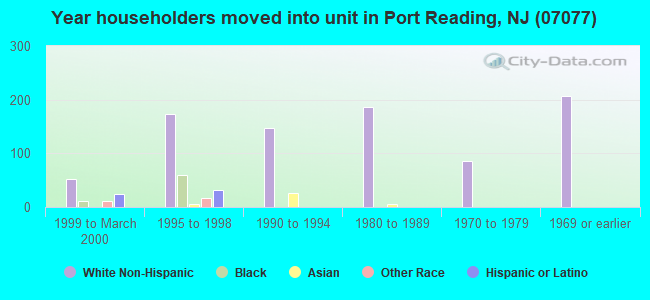
Year of entry for the foreign-born population
982010 or later
252000 to 2009
2021990 to 1999
276Before 1990
Facilities with environmental interests located in this zip code:
NJ TURNPIKE AUTH GROVER CLEVELAND SERVICE AREA 10N (NJ TNPK M P 92.9 in SEWAREN, NJ)
STATE MASTER (New Jersey environmental info) - NJEMS-013316, STATE CLEANUP SITE, NJEMS-15689, AIR PROGRAM, NJEMS-82689500005, EPCRA, NJEMS-B1548, AIR PROGRAM, NJEMS-H8667, HAZARDOUS WASTE BIENNIAL REPORTER (Resource Conservation and Recovery Act (tracking hazardous waste)) (Resource Conservation and Recovery Act (tracking hazardous waste)) Business SIC classification: TRANSPORTATION SERVICES; GASOLINE SERVICE STATIONS Organizations: NJ TURNPIKE AUTH MAINTENCE DEPT Alternative names: NJ TNPK AUTH - GROVER CLEVELAND S/A 10-N
NJ BELL TELEPHONE CO (CLIFF RD PUBLIC SERVICE in SEWAREN, NJ)
(Resource Conservation and Recovery Act (tracking hazardous waste))
GLOUCESTER CITY TERMINAL (KING STREET & JERSEY AVENUE in GLOUCESTER CITY, NJ)
OIL CONTROL (Facility Response Plan for oil discharge) Organizations: SEMMATERIALS, LP (CONTACT/GENERAL)
Housing units lacking complete plumbing facilities: 1.8% Housing units lacking complete kitchen facilities: 2.0%
70.2%Utility gas
17.4%Electricity
12.6%Fuel oil, kerosene, etc.
Population in 1990: 2,463. Population change in the 1990s: +318 (+12.9%).
Place of birth for U.S.-born residents:
This state: 1,813
Northeast: 187
Midwest: 3
South: 53
71% of the 07077 zip code residents lived in the same house 5 years ago. Out of people who lived in different houses, 66% lived in this county. Out of people who lived in different counties, 50% lived in New Jersey.
98% of the 07077 zip code residents lived in the same house 1 year ago. Out of people who lived in different houses, 20% moved from this county. Out of people who lived in different houses, 17% moved from different county within same state. Out of people who lived in different houses, 95% moved from abroad.
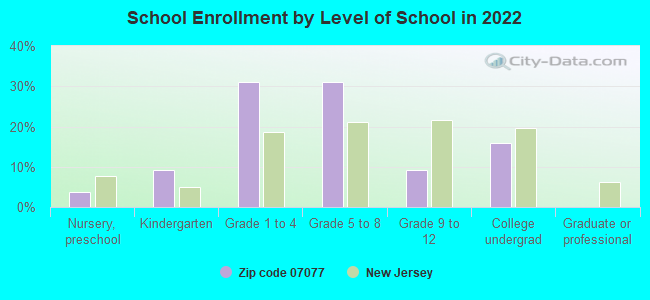
Private vs. public school enrollment:
Students in private schools in grades 1 to 8 (elementary and middle school):
Here:
0.0%
New Jersey:
12.3%
Students in private schools in grades 9 to 12 (high school):
Here:
0.0%
New Jersey:
13.1%
Students in private undergraduate colleges: 9
Here:
10.8%
New Jersey:
33.2%
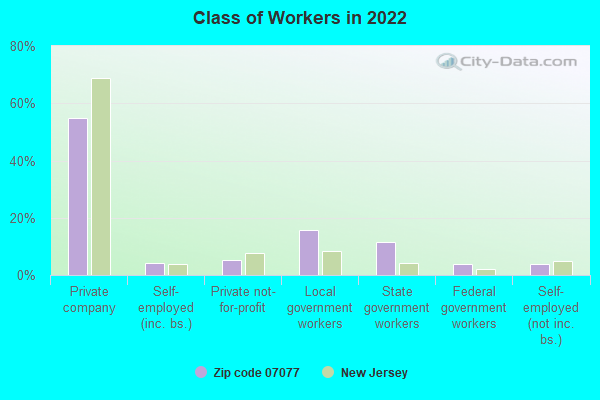
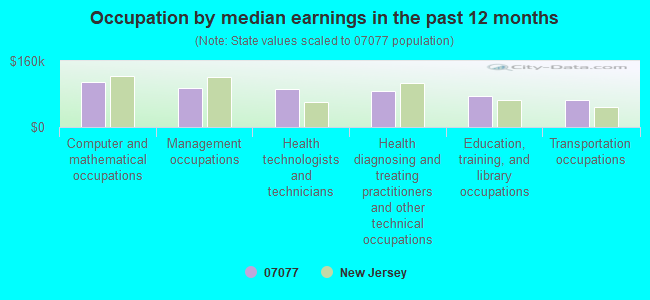
Occupation by median earnings in the past 12 months ($)
108,969Computer and mathematical occupations
93,918Management occupations
91,921Health technologists and technicians
88,313Health diagnosing and treating practitioners and other technical occupations
76,038Education, training, and library occupations
65,615Transportation occupations
Top industries in this zip code by the number of employees in 2005:
Health Care and Social Assistance: Services for the Elderly and Persons with Disabilities (100-249 employees: 1 establishment)
Utilities: Fossil Fuel Electric Power Generation (50-99: 1, 1-4: 1)
Utilities: Electric Power Distribution (50-99: 1)
Administrative and Support and Waste Management and Remediation Services: Janitorial Services (50-99: 1)
Wholesale Trade: Petroleum Bulk Stations and Terminals (50-99: 1)
Construction: Plumbing, Heating, and Air-Conditioning Contractors (10-19: 2, 1-4: 2)
Health Care and Social Assistance: Child Day Care Services (10-19: 1, 1-4: 1)
Administrative and Support and Waste Management and Remediation Services: Employment Placement Agencies (10-19: 1)
Other Services (except Public Administration): Commercial and Industrial Machinery and Equipment (except Automotive and Electronic) Repair and Maintenance (10-19: 1)
Wholesale Trade: Farm and Garden Machinery and Equipment Merchant Wholesalers (10-19: 1)
Fatal accident statistics in 2010:
Fatal accident count: 1
Vehicles involved in fatal accidents: 2
Fatal accidents caused by drunken drivers: 0
Fatalities: 1
Persons involved in fatal accidents: 2
Pedestrians involved in fatal accidents: 0
Home Mortgage Disclosure Act Aggregated Statistics For Year 2009 (Based on 2 partial tracts)
A) FHA, FSA/RHS & VA Home Purchase Loans
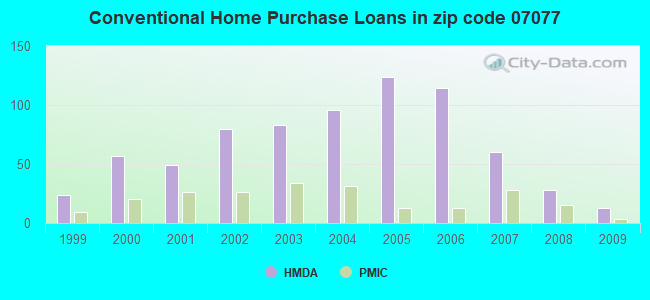
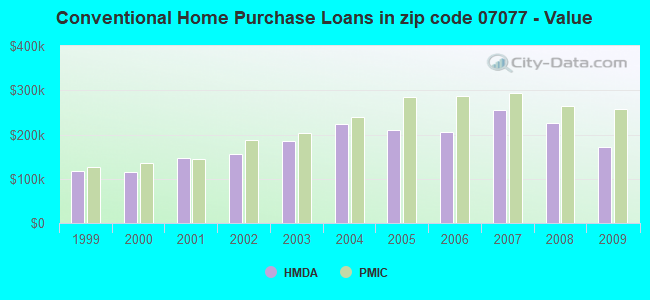
B) Conventional Home Purchase Loans
C) Refinancings
D) Home Improvement Loans
F) Non-occupant Loans on < 5 Family Dwellings (A B C & D)
Number
Average Value
Number
Average Value
Number
Average Value
Number
Average Value
Number
Average Value
LOANS ORIGINATED
26
$237,500
13
$172,568
135
$233,057
7
$73,260
2
$97,680
APPLICATIONS APPROVED, NOT ACCEPTED
2
$171,755
2
$211,640
5
$271,224
2
$2,440
0
$0
APPLICATIONS DENIED
5
$222,710
2
$104,190
70
$245,898
8
$96,255
7
$247,223
APPLICATIONS WITHDRAWN
0
$0
2
$103,380
57
$258,052
0
$0
3
$399,947
FILES CLOSED FOR INCOMPLETENESS
2
$225,480
0
$0
18
$278,207
2
$101,750
0
$0
Aggregated Statistics For Year 2008 (Based on 2 partial tracts)
A) FHA, FSA/RHS & VA Home Purchase Loans
B) Conventional Home Purchase Loans
C) Refinancings
D) Home Improvement Loans
F) Non-occupant Loans on < 5 Family Dwellings (A B C & D)
Number
Average Value
Number
Average Value
Number
Average Value
Number
Average Value
Number
Average Value
LOANS ORIGINATED
16
$288,461
28
$225,187
99
$221,753
18
$98,313
7
$187,220
APPLICATIONS APPROVED, NOT ACCEPTED
0
$0
5
$168,336
24
$181,793
3
$146,520
0
$0
APPLICATIONS DENIED
5
$220,756
13
$284,148
86
$227,977
29
$47,605
5
$238,340
APPLICATIONS WITHDRAWN
2
$182,335
3
$278,387
29
$227,639
0
$0
0
$0
FILES CLOSED FOR INCOMPLETENESS
0
$0
0
$0
10
$263,573
3
$93,340
2
$160,360
Aggregated Statistics For Year 2007 (Based on 2 partial tracts)
A) FHA, FSA/RHS & VA Home Purchase Loans
B) Conventional Home Purchase Loans
C) Refinancings
D) Home Improvement Loans
E) Loans on Dwellings For 5+ Families
F) Non-occupant Loans on < 5 Family Dwellings (A B C & D)
Number
Average Value
Number
Average Value
Number
Average Value
Number
Average Value
Number
Average Value
Number
Average Value
LOANS ORIGINATED
3
$326,687
60
$255,081
147
$215,826
33
$81,943
2
$275,130
18
$190,476
APPLICATIONS APPROVED, NOT ACCEPTED
0
$0
11
$258,408
31
$230,388
5
$66,422
0
$0
5
$225,640
APPLICATIONS DENIED
0
$0
34
$310,948
114
$248,299
28
$156,928
0
$0
11
$120,028
APPLICATIONS WITHDRAWN
0
$0
7
$289,086
62
$236,979
5
$251,688
0
$0
2
$122,100
FILES CLOSED FOR INCOMPLETENESS
0
$0
0
$0
21
$266,527
0
$0
0
$0
2
$249,900
Aggregated Statistics For Year 2006 (Based on 2 partial tracts)
A) FHA, FSA/RHS & VA Home Purchase Loans
B) Conventional Home Purchase Loans
C) Refinancings
D) Home Improvement Loans
F) Non-occupant Loans on < 5 Family Dwellings (A B C & D)
G) Loans On Manufactured Home Dwelling (A B C & D)
Number
Average Value
Number
Average Value
Number
Average Value
Number
Average Value
Number
Average Value
Number
Average Value
LOANS ORIGINATED
8
$289,580
114
$205,371
207
$210,382
49
$73,792
15
$192,864
0
$0
APPLICATIONS APPROVED, NOT ACCEPTED
0
$0
16
$226,699
41
$187,061
11
$137,492
3
$186,133
0
$0
APPLICATIONS DENIED
0
$0
42
$211,950
127
$247,456
29
$88,810
11
$215,340
3
$213,267
APPLICATIONS WITHDRAWN
5
$260,480
20
$246,968
85
$233,225
5
$152,056
7
$138,147
0
$0
FILES CLOSED FOR INCOMPLETENESS
0
$0
5
$111,030
31
$248,559
3
$187,220
2
$162,800
0
$0
Aggregated Statistics For Year 2005 (Based on 2 partial tracts)
A) FHA, FSA/RHS & VA Home Purchase Loans
B) Conventional Home Purchase Loans
C) Refinancings
D) Home Improvement Loans
E) Loans on Dwellings For 5+ Families
F) Non-occupant Loans on < 5 Family Dwellings (A B C & D)
G) Loans On Manufactured Home Dwelling (A B C & D)
Number
Average Value
Number
Average Value
Number
Average Value
Number
Average Value
Number
Average Value
Number
Average Value
Number
Average Value
LOANS ORIGINATED
8
$270,859
124
$210,340
236
$195,326
34
$113,338
2
$279,200
31
$158,074
0
$0
APPLICATIONS APPROVED, NOT ACCEPTED
0
$0
15
$212,074
37
$183,172
3
$160,087
0
$0
5
$175,824
0
$0
APPLICATIONS DENIED
2
$256,410
23
$198,474
106
$198,094
28
$69,190
0
$0
8
$236,468
3
$49,927
APPLICATIONS WITHDRAWN
2
$228,735
16
$216,321
77
$208,807
7
$206,523
2
$215,710
3
$218,693
0
$0
FILES CLOSED FOR INCOMPLETENESS
0
$0
2
$205,130
31
$227,447
0
$0
0
$0
2
$205,130
0
$0
Aggregated Statistics For Year 2004 (Based on 2 partial tracts)
A) FHA, FSA/RHS & VA Home Purchase Loans
B) Conventional Home Purchase Loans
C) Refinancings
D) Home Improvement Loans
E) Loans on Dwellings For 5+ Families
F) Non-occupant Loans on < 5 Family Dwellings (A B C & D)
Number
Average Value
Number
Average Value
Number
Average Value
Number
Average Value
Number
Average Value
Number
Average Value
LOANS ORIGINATED
11
$230,732
96
$222,985
210
$186,778
36
$88,590
0
$0
18
$162,709
APPLICATIONS APPROVED, NOT ACCEPTED
0
$0
33
$221,309
33
$147,457
8
$48,230
0
$0
5
$309,646
APPLICATIONS DENIED
0
$0
21
$181,250
81
$193,591
24
$50,672
0
$0
2
$170,940
APPLICATIONS WITHDRAWN
0
$0
20
$179,568
63
$186,987
3
$36,900
2
$280,830
7
$123,030
FILES CLOSED FOR INCOMPLETENESS
0
$0
7
$269,783
15
$180,599
0
$0
0
$0
2
$196,990
Aggregated Statistics For Year 2003 (Based on 2 partial tracts)
A) FHA, FSA/RHS & VA Home Purchase Loans
B) Conventional Home Purchase Loans
C) Refinancings
D) Home Improvement Loans
E) Loans on Dwellings For 5+ Families
F) Non-occupant Loans on < 5 Family Dwellings (A B C & D)
Number
Average Value
Number
Average Value
Number
Average Value
Number
Average Value
Number
Average Value
Number
Average Value
LOANS ORIGINATED
15
$221,517
83
$184,552
360
$150,753
16
$44,770
2
$594,220
16
$163,716
APPLICATIONS APPROVED, NOT ACCEPTED
0
$0
10
$228,734
67
$130,240
11
$78,440
0
$0
2
$112,330
APPLICATIONS DENIED
2
$183,965
8
$202,279
93
$128,577
11
$76,220
0
$0
2
$155,475
APPLICATIONS WITHDRAWN
2
$120,470
8
$159,138
93
$166,003
10
$35,816
0
$0
2
$148,150
FILES CLOSED FOR INCOMPLETENESS
0
$0
8
$265,568
10
$163,940
2
$45,585
0
$0
2
$163,615
Aggregated Statistics For Year 2002 (Based on 2 partial tracts)
A) FHA, FSA/RHS & VA Home Purchase Loans
B) Conventional Home Purchase Loans
C) Refinancings
D) Home Improvement Loans
F) Non-occupant Loans on < 5 Family Dwellings (A B C & D)
Number
Average Value
Number
Average Value
Number
Average Value
Number
Average Value
Number
Average Value
LOANS ORIGINATED
11
$207,496
80
$156,288
207
$252,489
20
$40,456
7
$117,681
APPLICATIONS APPROVED, NOT ACCEPTED
3
$194,273
15
$159,653
33
$114,749
18
$30,932
2
$101,750
APPLICATIONS DENIED
7
$153,963
5
$92,144
75
$110,205
28
$22,734
3
$77,600
APPLICATIONS WITHDRAWN
0
$0
8
$184,981
39
$132,118
11
$53,280
2
$81,400
FILES CLOSED FOR INCOMPLETENESS
0
$0
2
$175,010
15
$150,970
0
$0
3
$172,567
Aggregated Statistics For Year 2001 (Based on 2 partial tracts)
A) FHA, FSA/RHS & VA Home Purchase Loans
B) Conventional Home Purchase Loans
C) Refinancings
D) Home Improvement Loans
E) Loans on Dwellings For 5+ Families
F) Non-occupant Loans on < 5 Family Dwellings (A B C & D)
Number
Average Value
Number
Average Value
Number
Average Value
Number
Average Value
Number
Average Value
Number
Average Value
LOANS ORIGINATED
10
$136,752
49
$146,653
150
$119,484
24
$25,980
2
$205,940
10
$129,914
APPLICATIONS APPROVED, NOT ACCEPTED
0
$0
8
$156,899
24
$105,481
2
$32,560
0
$0
5
$141,636
APPLICATIONS DENIED
0
$0
5
$100,284
88
$98,660
24
$45,109
0
$0
2
$48,840
APPLICATIONS WITHDRAWN
2
$130,240
5
$191,128
63
$109,334
10
$50,956
0
$0
0
$0
FILES CLOSED FOR INCOMPLETENESS
0
$0
2
$111,520
16
$107,550
2
$16,280
0
$0
0
$0
Aggregated Statistics For Year 2000 (Based on 2 partial tracts)
A) FHA, FSA/RHS & VA Home Purchase Loans
B) Conventional Home Purchase Loans
C) Refinancings
D) Home Improvement Loans
F) Non-occupant Loans on < 5 Family Dwellings (A B C & D)
Number
Average Value
Number
Average Value
Number
Average Value
Number
Average Value
Number
Average Value
LOANS ORIGINATED
11
$153,624
57
$115,645
34
$75,319
11
$22,496
2
$140,820
APPLICATIONS APPROVED, NOT ACCEPTED
2
$102,565
5
$94,424
24
$96,459
18
$38,168
0
$0
APPLICATIONS DENIED
3
$144,893
5
$148,474
49
$59,571
33
$21,164
0
$0
APPLICATIONS WITHDRAWN
5
$146,520
2
$135,940
42
$79,423
3
$26,047
0
$0
FILES CLOSED FOR INCOMPLETENESS
0
$0
3
$128,070
16
$115,995
0
$0
0
$0
Aggregated Statistics For Year 1999 (Based on 1 partial tract)
A) FHA, FSA/RHS & VA Home Purchase Loans
B) Conventional Home Purchase Loans
C) Refinancings
D) Home Improvement Loans
E) Loans on Dwellings For 5+ Families
F) Non-occupant Loans on < 5 Family Dwellings (A B C & D)


 Nearest zip codes: 07064, 07001, 07095, 08861, 07008, 10309.