Estimated zip code population in 2022: 947 Zip code population in 2010: 997 Zip code population in 2000: 1,156
Houses and condos: 1,610 Renter-occupied apartments: 50
% of renters here:
10%
State:
35%
March 2022 cost of living index in zip code 08403: 112.3 (more than average, U.S. average is 100)
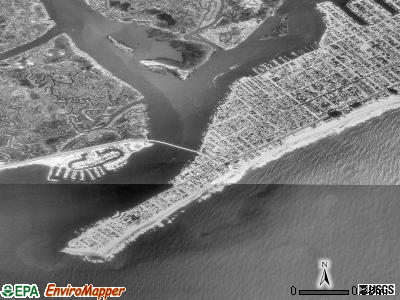
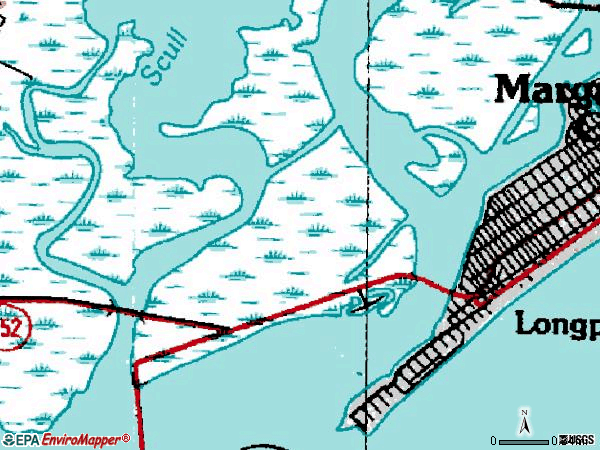
Land area: 2.1 sq. mi. Water area: 1.6 sq. mi.
Population density: 451 people per square mile
(low).
OSM Map
Google Map
MSN Map
OSM Map
General Map
Google Map
MSN Map
OSM Map
Google Map
MSN Map
OSM Map
Google Map
MSN Map
Please wait while loading the map...
Real estate property taxes paid for housing units in 2022:
This zip code:
0.8% ($8,348)
New Jersey:
2.1% ($8,897)
Median real estate property taxes paid for housing units with mortgages in 2022: $9,473 (0.8%) Median real estate property taxes paid for housing units with no mortgage in 2022: $7,486 (0.8%)
Business Search- 14 Million verified businesses
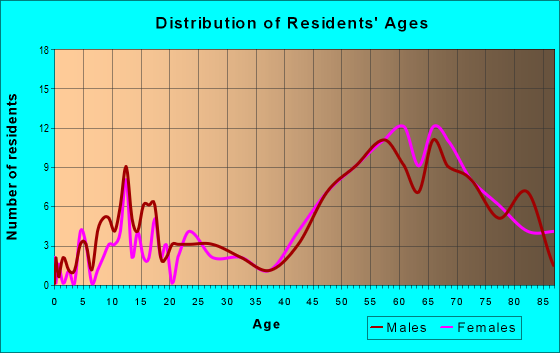
Males: 436
(46.1%)
Females: 510
(53.9%)
For population 25 years and over in 08403:
High school or higher: 99.3%
Bachelor's degree or higher: 53.7%
Graduate or professional degree: 26.4%
Unemployed: 5.8%
Mean travel time to work (commute): 35.7 minutes
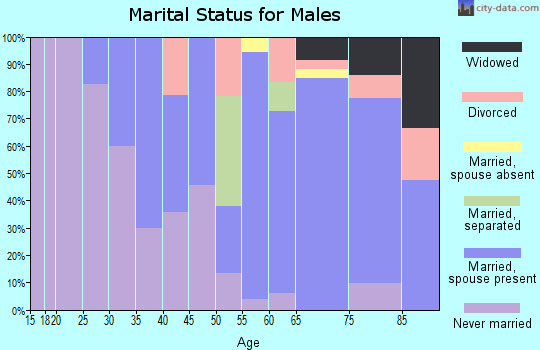
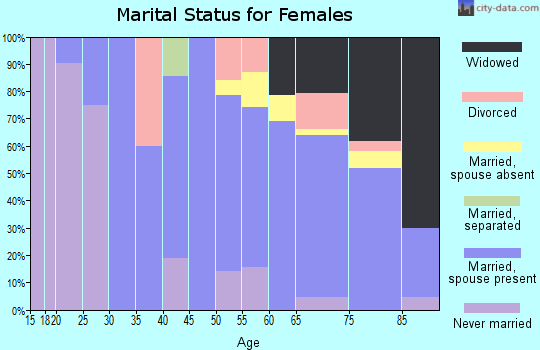
For population 15 years and over in 08403:
Never married: 15.6%
Now married: 64.1%
Separated: 0.4%
Widowed: 10.9%
Divorced: 8.9%
Zip code 08403 compared to state average:
Median house value significantly above state average.
Black race population percentage significantly below state average.
Hispanic race population percentage significantly below state average.
Median age significantly above state average.
Foreign-born population percentage significantly below state average.
Renting percentage significantly below state average.
Length of stay since moving in above state average.
Number of rooms per house above state average.
Number of college students below state average.
Percentage of population with a bachelor's degree or higher above state average.
Estimated median house/condo value in 2022: $1,048,529
08403:
$1,048,529
New Jersey:
$428,900
Median resident age:
This zip code:
66.6 years
New Jersey median age:
40.4 years
Average household size:
This zip code:
1.9 people
New Jersey:
2.6 people
Averages for the 2020 tax year for zip code 08403, filed in 2021:
Average Adjusted Gross Income (AGI) in 2020: $189,194 (Individual Income Tax Returns)
Here:
$189,194
State:
$95,247
Salary/wage: $136,154 (reported on 68.5% of returns)
Here:
$136,154
State:
$80,635
(% of AGI for various income ranges: 924.3% for AGIs below $25k, 2923.3% for AGIs $25k-50k, 5647.5% for AGIs $50k-75k, 7340.0% for AGIs $75k-100k, 13296.0% for AGIs $100k-200k, 188720.0% for AGIs over 200k)
Taxable interest for individuals: $4,879 (reported on 61.1% of returns)
This zip code:
$4,879
New Jersey:
$2,414
(% of AGI for various income ranges: 40.0% for AGIs below $25k, 66.7% for AGIs $25k-50k, 192.5% for AGIs $50k-75k, 103.3% for AGIs $75k-100k, 438.0% for AGIs $100k-200k, 6175.0% for AGIs over 200k)
Ordinary dividends: $16,842 (reported on 57.4% of returns)
Here:
$16,842
State:
$8,057
(% of AGI for various income ranges: 222.9% for AGIs below $25k, 373.3% for AGIs $25k-50k, 760.0% for AGIs $50k-75k, 846.7% for AGIs $75k-100k, 1622.0% for AGIs $100k-200k, 17920.0% for AGIs over 200k)
Net capital gain/loss in AGI: +$36,203 (reported on 53.7% of returns)
Here:
+$36,203
State:
+$25,022
(% of AGI for various income ranges: 84.3% for AGIs below $25k, 365.0% for AGIs $50k-75k, 593.3% for AGIs $75k-100k, 1666.0% for AGIs $100k-200k, 46415.0% for AGIs over 200k)
Profit/loss from business: +$53,345 (reported on 20.4% of returns)
Here:
+$53,345
State:
+$18,035
(% of AGI for various income ranges: 1036.7% for AGIs $25k-50k, 1708.0% for AGIs $100k-200k, 23515.0% for AGIs over 200k)
Taxable individual retirement arrangement distribution: $22,958 (reported on 22.2% of returns)
08403:
$22,958
New Jersey:
$21,558
(% of AGI for various income ranges: 350.0% for AGIs below $25k, 1172.5% for AGIs $50k-75k, 2206.0% for AGIs $100k-200k, 4690.0% for AGIs over 200k)
Total itemized deductions: $40,976 (reported on 31.5% of returns)
Here:
$40,976
State:
$32,863
(% of AGI for various income ranges: 780.0% for AGIs below $25k, 2950.0% for AGIs $50k-75k, 2784.0% for AGIs $100k-200k, 19240.0% for AGIs over 200k)
Charity contributions: $7,671 (reported on 25.9% of returns)
Here:
$7,671
State:
$7,880
(% of AGI for various income ranges: 142.5% for AGIs $50k-75k, 626.0% for AGIs $100k-200k, 3520.0% for AGIs over 200k)
Taxes paid: $9,135 (reported on 31.5% of returns)
08403:
$9,135
State:
$9,183
(% of AGI for various income ranges: 215.7% for AGIs below $25k, 612.5% for AGIs $50k-75k, 820.0% for AGIs $100k-200k, 3735.0% for AGIs over 200k)
Percentage of individuals using paid preparers for their 2020 taxes: 96.3%
Here:
96%
State:
92%
(% for various income ranges: 92.3% for AGIs below $25k, 100.0% for AGIs $25k-50k, 100.0% for AGIs $50k-75k, 100.0% for AGIs $75k-100k, 90.9% for AGIs $100k-200k, 100.0% for AGIs over 200k)
Averages for the 2012 tax year for zip code 08403, filed in 2013:
Average Adjusted Gross Income (AGI) in 2012: $126,008 (Individual Income Tax Returns)
Here:
$126,008
State:
$79,688
Salary/wage: $87,747 (reported on 65.4% of returns)
Here:
$87,747
State:
$68,122
(% of AGI for various income ranges: 48.3% for AGIs below $25k, 49.1% for AGIs $25k-50k, 42.8% for AGIs $50k-75k, 37.2% for AGIs $75k-100k, 61.7% for AGIs $100k-200k, 40.9% for AGIs over 200k)
Taxable interest for individuals: $4,953 (reported on 61.5% of returns)
This zip code:
$4,953
New Jersey:
$2,193
(% of AGI for various income ranges: 4.6% for AGIs below $25k, 4.0% for AGIs $25k-50k, 1.8% for AGIs $50k-75k, 2.5% for AGIs $75k-100k, 3.3% for AGIs $100k-200k, 1.9% for AGIs over 200k)
Ordinary dividends: $10,479 (reported on 53.8% of returns)
Here:
$10,479
State:
$6,828
(% of AGI for various income ranges: 9.0% for AGIs below $25k, 4.6% for AGIs $25k-50k, 6.3% for AGIs $50k-75k, 9.9% for AGIs $75k-100k, 4.4% for AGIs $100k-200k, 3.5% for AGIs over 200k)
Net capital gain/loss in AGI: +$28,768 (reported on 48.1% of returns)
Here:
+$28,768
State:
+$15,358
(% of AGI for various income ranges: 4.0% for AGIs $75k-100k, 3.1% for AGIs $100k-200k, 17.3% for AGIs over 200k)
Profit/loss from business: +$13,412 (reported on 15.4% of returns)
Here:
+$13,412
State:
+$19,577
Taxable individual retirement arrangement distribution: $20,721 (reported on 26.9% of returns)
08403:
$20,721
New Jersey:
$18,214
(% of AGI for various income ranges: 10.3% for AGIs below $25k, 6.3% for AGIs $25k-50k, 9.4% for AGIs $50k-75k, 10.1% for AGIs $75k-100k, 3.4% for AGIs $100k-200k, 3.1% for AGIs over 200k)
Total itemized deductions: $45,703 (24% of AGI, reported on 57.7% of returns)
Here:
$45,703
State:
$30,827
Here:
23.7% of AGI
State:
21.2% of AGI
(% of AGI for various income ranges: 41.4% for AGIs below $25k, 28.6% for AGIs $25k-50k, 32.8% for AGIs $50k-75k, 25.0% for AGIs $75k-100k, 19.3% for AGIs $100k-200k, 18.0% for AGIs over 200k)
Charity contributions: $6,104 (reported on 51.9% of returns)
Here:
$6,104
State:
$3,451
(% of AGI for various income ranges: 2.3% for AGIs below $25k, 1.9% for AGIs $25k-50k, 1.5% for AGIs $50k-75k, 1.6% for AGIs $75k-100k, 2.5% for AGIs $100k-200k, 2.8% for AGIs over 200k)
Taxes paid: $20,157 (reported on 57.7% of returns)
08403:
$20,157
State:
$15,801
(% of AGI for various income ranges: 13.1% for AGIs below $25k, 9.2% for AGIs $25k-50k, 10.5% for AGIs $50k-75k, 9.2% for AGIs $75k-100k, 8.5% for AGIs $100k-200k, 9.2% for AGIs over 200k)
Percentage of individuals using paid preparers for their 2012 taxes: 78.8%
Here:
79%
State:
65%
(% for various income ranges: 66.7% for AGIs below $25k, 80.0% for AGIs $25k-50k, 85.7% for AGIs $50k-75k, 80.0% for AGIs $75k-100k, 77.8% for AGIs $100k-200k, 100.0% for AGIs over 200k)
Averages for the 2004 tax year for zip code 08403, filed in 2005:
Average Adjusted Gross Income (AGI) in 2004: $100,502 (Individual Income Tax Returns)
Here:
$100,502
State:
$64,921
Salary/wage: $78,230 (reported on 62.9% of returns)
Here:
$78,230
State:
$57,755
(% of AGI for various income ranges: 73.1% for AGIs below $10k, 49.4% for AGIs $10k-25k, 53.6% for AGIs $25k-50k, 41.5% for AGIs $50k-75k, 55.0% for AGIs $75k-100k, 48.5% for AGIs over 100k)
Taxable interest for individuals: $4,554 (reported on 72.5% of returns)
This zip code:
$4,554
New Jersey:
$2,068
(% of AGI for various income ranges: 23.1% for AGIs below $10k, 8.4% for AGIs $10k-25k, 5.9% for AGIs $25k-50k, 6.5% for AGIs $50k-75k, 3.0% for AGIs $75k-100k, 2.3% for AGIs over 100k)
Taxable dividends: $8,705 (reported on 57.9% of returns)
Here:
$8,705
State:
$3,959
(% of AGI for various income ranges: 22.8% for AGIs below $10k, 8.3% for AGIs $10k-25k, 5.7% for AGIs $25k-50k, 8.6% for AGIs $50k-75k, 3.8% for AGIs $75k-100k, 4.4% for AGIs over 100k)
Net capital gain/loss: +$19,014 (reported on 47.8% of returns)
Here:
+$19,014
State:
+$13,591
(% of AGI for various income ranges: -10.1% for AGIs below $10k, -0.8% for AGIs $10k-25k, 0.9% for AGIs $25k-50k, 1.6% for AGIs $50k-75k, -0.2% for AGIs $75k-100k, 12.1% for AGIs over 100k)
Profit/loss from business: +$32,245 (reported on 16.3% of returns)
Here:
+$32,245
State:
+$17,520
(% of AGI for various income ranges: 13.2% for AGIs $10k-25k, 5.5% for AGIs $25k-50k, 5.3% for AGIs $50k-75k, 5.3% for AGIs over 100k)
IRA payment deduction: $4,125 (reported on 4.0% of returns)
08403:
$4,125
New Jersey:
$3,270
Self-employed pension: $27,438 (reported on 2.7% of returns)
Here:
$27,438
New Jersey:
$17,258
Total itemized deductions: $32,450 (20% of AGI, reported on 54.2% of returns)
Here:
$32,450
State:
$23,924
Here:
20.1% of AGI
State:
21.1% of AGI
(% of AGI for various income ranges: 81.1% for AGIs below $10k, 26.0% for AGIs $10k-25k, 20.2% for AGIs $25k-50k, 17.1% for AGIs $50k-75k, 18.6% for AGIs $75k-100k, 16.3% for AGIs over 100k)
Charity contributions deductions: $4,220 (2% of AGI, reported on 49.8% of returns)
Here:
$4,220
State:
$3,242
Here:
2.5% of AGI
State:
2.7% of AGI
(% of AGI for various income ranges: 2.7% for AGIs below $10k, 4.1% for AGIs $10k-25k, 2.4% for AGIs $25k-50k, 1.9% for AGIs $50k-75k, 2.3% for AGIs $75k-100k, 2.0% for AGIs over 100k)
Total tax: $23,723 (reported on 80.3% of returns)
08403:
$23,723
State:
$12,321
(% of AGI for various income ranges: 1.5% for AGIs below $10k, 5.3% for AGIs $10k-25k, 8.2% for AGIs $25k-50k, 10.6% for AGIs $50k-75k, 11.3% for AGIs $75k-100k, 22.4% for AGIs over 100k)
Earned income credit: $1,381 (reported on 3.5% of returns)
Here:
$1,381
State:
$1,711
Percentage of individuals using paid preparers for their 2004 taxes: 74.1%
Here:
74%
State:
65%
(% for various income ranges: 58.2% for AGIs below $10k, 71.2% for AGIs $10k-25k, 76.5% for AGIs $25k-50k, 75.9% for AGIs $50k-75k, 63.6% for AGIs $75k-100k, 87.8% for AGIs over 100k)
Size of family households: 268 2-persons, 15 3-persons, 36 4-persons
Size of nonfamily households: 169 1-person, 21 2-persons
73 married couples with children.
13 single-parent households (13 women).
96.9% of residents of 08403 zip code speak English at home.
2.1% of residents speak Spanish at home (47% very well, 53% well).
0.8% of residents speak other Indo-European language at home (100% very well).
1.7% of residents speak Asian or Pacific Island language at home (100% very well).
Foreign born population: 34 (3.7%) (100.0% of them are naturalized citizens)
This zip code:
3.7%
Whole state:
23.5%
38%Malaysia
3%Algeria
29%Italian
19%Irish
13%American
4%English
4%Hungarian
3%Eastern European
2%Lithuanian
Year of entry for the foreign-born population
112010 or later
02000 to 2009
101990 to 1999
26Before 1990
85.9%Utility gas
13.8%Electricity
0.6%Fuel oil, kerosene, etc.
Population in 1990: 318. Population change in the 1990s: +838 (+263.5%).
Place of birth for U.S.-born residents:
This state: 283
Northeast: 568
South: 40
West: 14
66% of the 08403 zip code residents lived in the same house 5 years ago. Out of people who lived in different houses, 45% lived in this county. Out of people who lived in different counties, 50% lived in New Jersey.
92% of the 08403 zip code residents lived in the same house 1 year ago. Out of people who lived in different houses, 11% moved from this county. Out of people who lived in different houses, 34% moved from different county within same state. Out of people who lived in different houses, 59% moved from different state.
Private vs. public school enrollment:
Students in private schools in grades 1 to 8 (elementary and middle school): 2
Here:
9.3%
New Jersey:
12.3%
Students in private schools in grades 9 to 12 (high school): 4
Here:
9.6%
New Jersey:
13.1%
Students in private undergraduate colleges:
Here:
0.0%
New Jersey:
33.2%
Occupation by median earnings in the past 12 months ($)
242,553Legal occupations
122,399Business and financial operations occupations
104,606Computer and mathematical occupations
102,568Health diagnosing and treating practitioners and other technical occupations
98,183Management occupations
92,466Education, training, and library occupations
Top industries in this zip code by the number of employees in 2005:
Other Services (except Public Administration): Other Similar Organizations (except Business, Professional, Labor, and Political Organizations) (10-19 employees: 1 establishment, 5-9 employees: 2 establishments)
Accommodation and Food Services: Full-Service Restaurants (10-19: 1, 1-4: 1)
Health Care and Social Assistance: Homes for the Elderly (10-19: 1)
Construction: Other Building Finishing Contractors (10-19: 1)
Construction: Siding Contractors (5-9: 1)
Professional, Scientific, and Technical Services: Marketing Consulting Services (1-4: 1)
Professional, Scientific, and Technical Services: Building Inspection Services (1-4: 1)
Construction: Highway, Street, and Bridge Construction (1-4: 1)
Fatal accident statistics in 2013:
Fatal accident count: 2
Vehicles involved in fatal accidents: 5
Fatal accidents caused by drunken drivers: 1
Fatalities: 2
Persons involved in fatal accidents: 7
Pedestrians involved in fatal accidents: 0
Home Mortgage Disclosure Act Aggregated Statistics For Year 2009 (Based on 10 partial tracts)
A) FHA, FSA/RHS & VA Home Purchase Loans
B) Conventional Home Purchase Loans
C) Refinancings
D) Home Improvement Loans
F) Non-occupant Loans on < 5 Family Dwellings (A B C & D)
Number
Average Value
Number
Average Value
Number
Average Value
Number
Average Value
Number
Average Value
LOANS ORIGINATED
1
$143,810
25
$660,094
130
$444,702
5
$589,188
101
$522,623
APPLICATIONS APPROVED, NOT ACCEPTED
0
$0
0
$0
5
$362,060
0
$0
2
$500,900
APPLICATIONS DENIED
0
$0
5
$1,598,832
27
$598,456
4
$212,118
20
$789,808
APPLICATIONS WITHDRAWN
0
$0
2
$1,528,520
21
$412,752
1
$449,140
13
$682,039
FILES CLOSED FOR INCOMPLETENESS
0
$0
0
$0
5
$341,540
0
$0
2
$236,375
Aggregated Statistics For Year 2008 (Based on 10 partial tracts)
A) FHA, FSA/RHS & VA Home Purchase Loans
B) Conventional Home Purchase Loans
C) Refinancings
D) Home Improvement Loans
E) Loans on Dwellings For 5+ Families
F) Non-occupant Loans on < 5 Family Dwellings (A B C & D)
Number
Average Value
Number
Average Value
Number
Average Value
Number
Average Value
Number
Average Value
Number
Average Value
LOANS ORIGINATED
1
$261,840
28
$688,117
60
$704,744
5
$185,544
1
$7,756,150
49
$690,847
APPLICATIONS APPROVED, NOT ACCEPTED
0
$0
5
$1,065,122
12
$588,316
2
$130,675
0
$0
7
$849,779
APPLICATIONS DENIED
0
$0
2
$296,285
19
$411,818
3
$57,340
0
$0
6
$275,268
APPLICATIONS WITHDRAWN
1
$229,530
6
$771,233
18
$486,612
0
$0
0
$0
10
$730,087
FILES CLOSED FOR INCOMPLETENESS
0
$0
0
$0
2
$1,224,455
0
$0
0
$0
2
$1,224,455
Aggregated Statistics For Year 2007 (Based on 10 partial tracts)
B) Conventional Home Purchase Loans
C) Refinancings
D) Home Improvement Loans
F) Non-occupant Loans on < 5 Family Dwellings (A B C & D)
Number
Average Value
Number
Average Value
Number
Average Value
Number
Average Value
LOANS ORIGINATED
58
$758,189
70
$586,334
15
$112,531
62
$827,860
APPLICATIONS APPROVED, NOT ACCEPTED
6
$600,315
22
$543,423
3
$30,827
12
$611,880
APPLICATIONS DENIED
11
$719,853
11
$594,787
3
$61,133
12
$797,398
APPLICATIONS WITHDRAWN
4
$981,330
10
$787,006
1
$113,680
5
$1,307,558
FILES CLOSED FOR INCOMPLETENESS
2
$1,022,470
1
$455,280
0
$0
1
$764,260
Aggregated Statistics For Year 2006 (Based on 10 partial tracts)
B) Conventional Home Purchase Loans
C) Refinancings
D) Home Improvement Loans
F) Non-occupant Loans on < 5 Family Dwellings (A B C & D)
Number
Average Value
Number
Average Value
Number
Average Value
Number
Average Value
LOANS ORIGINATED
58
$977,596
81
$657,929
16
$103,442
75
$940,129
APPLICATIONS APPROVED, NOT ACCEPTED
8
$468,946
15
$385,054
2
$82,555
6
$492,390
APPLICATIONS DENIED
13
$3,771,702
17
$873,461
10
$136,051
13
$3,246,895
APPLICATIONS WITHDRAWN
7
$608,763
22
$462,076
4
$489,658
13
$751,326
FILES CLOSED FOR INCOMPLETENESS
0
$0
2
$459,170
1
$163,770
1
$413,800
Aggregated Statistics For Year 2005 (Based on 10 partial tracts)
B) Conventional Home Purchase Loans
C) Refinancings
D) Home Improvement Loans
F) Non-occupant Loans on < 5 Family Dwellings (A B C & D)
G) Loans On Manufactured Home Dwelling (A B C & D)
Number
Average Value
Number
Average Value
Number
Average Value
Number
Average Value
Number
Average Value
LOANS ORIGINATED
90
$811,777
114
$520,226
17
$160,626
119
$741,743
0
$0
APPLICATIONS APPROVED, NOT ACCEPTED
11
$1,009,789
17
$439,386
3
$85,020
17
$560,815
0
$0
APPLICATIONS DENIED
12
$871,387
28
$448,608
11
$156,259
22
$442,752
1
$163,770
APPLICATIONS WITHDRAWN
12
$1,118,743
30
$430,080
4
$215,195
22
$739,794
0
$0
FILES CLOSED FOR INCOMPLETENESS
1
$3,298,700
5
$255,468
0
$0
3
$1,326,537
0
$0
Aggregated Statistics For Year 2004 (Based on 10 partial tracts)
B) Conventional Home Purchase Loans
C) Refinancings
D) Home Improvement Loans
F) Non-occupant Loans on < 5 Family Dwellings (A B C & D)
G) Loans On Manufactured Home Dwelling (A B C & D)
Number
Average Value
Number
Average Value
Number
Average Value
Number
Average Value
Number
Average Value
LOANS ORIGINATED
86
$452,536
77
$370,183
17
$168,985
102
$446,009
0
$0
APPLICATIONS APPROVED, NOT ACCEPTED
19
$417,921
11
$404,880
3
$37,453
16
$442,245
0
$0
APPLICATIONS DENIED
17
$614,258
25
$305,008
5
$145,864
24
$487,794
0
$0
APPLICATIONS WITHDRAWN
10
$432,640
14
$351,670
0
$0
12
$460,621
1
$2,292,780
FILES CLOSED FOR INCOMPLETENESS
3
$914,200
2
$355,530
0
$0
4
$533,238
0
$0
Aggregated Statistics For Year 2003 (Based on 10 partial tracts)
B) Conventional Home Purchase Loans
C) Refinancings
D) Home Improvement Loans
F) Non-occupant Loans on < 5 Family Dwellings (A B C & D)
Number
Average Value
Number
Average Value
Number
Average Value
Number
Average Value
LOANS ORIGINATED
68
$531,151
295
$291,097
12
$147,961
192
$392,511
APPLICATIONS APPROVED, NOT ACCEPTED
8
$626,228
44
$366,002
2
$49,485
21
$225,380
APPLICATIONS DENIED
7
$400,799
42
$251,285
4
$238,842
19
$198,109
APPLICATIONS WITHDRAWN
6
$387,223
45
$275,761
1
$54,980
14
$299,387
FILES CLOSED FOR INCOMPLETENESS
2
$523,680
14
$218,823
1
$54,350
4
$411,382
Aggregated Statistics For Year 2002 (Based on 10 partial tracts)
B) Conventional Home Purchase Loans
C) Refinancings
D) Home Improvement Loans
F) Non-occupant Loans on < 5 Family Dwellings (A B C & D)
Number
Average Value
Number
Average Value
Number
Average Value
Number
Average Value
LOANS ORIGINATED
62
$471,560
192
$381,386
8
$55,280
154
$496,526
APPLICATIONS APPROVED, NOT ACCEPTED
10
$516,142
23
$193,360
2
$121,295
13
$458,472
APPLICATIONS DENIED
1
$303,770
35
$305,552
2
$178,710
7
$517,826
APPLICATIONS WITHDRAWN
6
$418,382
14
$222,331
1
$133,630
9
$302,401
FILES CLOSED FOR INCOMPLETENESS
0
$0
5
$141,952
1
$94,990
1
$203,070
Aggregated Statistics For Year 2001 (Based on 10 partial tracts)
B) Conventional Home Purchase Loans
C) Refinancings
D) Home Improvement Loans
F) Non-occupant Loans on < 5 Family Dwellings (A B C & D)
Number
Average Value
Number
Average Value
Number
Average Value
Number
Average Value
LOANS ORIGINATED
71
$386,569
126
$308,508
8
$33,892
103
$383,399
APPLICATIONS APPROVED, NOT ACCEPTED
5
$349,228
10
$425,235
1
$46,290
5
$346,570
APPLICATIONS DENIED
4
$1,061,145
16
$437,046
3
$100,483
8
$610,862
APPLICATIONS WITHDRAWN
6
$201,700
18
$284,973
2
$12,910
11
$215,493
FILES CLOSED FOR INCOMPLETENESS
0
$0
3
$128,563
1
$54,590
2
$117,370
Aggregated Statistics For Year 2000 (Based on 10 partial tracts)
B) Conventional Home Purchase Loans
C) Refinancings
D) Home Improvement Loans
F) Non-occupant Loans on < 5 Family Dwellings (A B C & D)
Number
Average Value
Number
Average Value
Number
Average Value
Number
Average Value
LOANS ORIGINATED
72
$251,243
29
$215,813
15
$80,407
44
$295,145
APPLICATIONS APPROVED, NOT ACCEPTED
7
$352,917
7
$126,797
7
$41,611
2
$92,805
APPLICATIONS DENIED
8
$161,144
8
$145,374
3
$139,497
6
$164,852
APPLICATIONS WITHDRAWN
7
$420,004
8
$157,850
1
$6,210
2
$829,220
FILES CLOSED FOR INCOMPLETENESS
1
$194,750
1
$63,360
0
$0
0
$0
Aggregated Statistics For Year 1999 (Based on 5 partial tracts)
B) Conventional Home Purchase Loans
C) Refinancings
D) Home Improvement Loans
F) Non-occupant Loans on < 5 Family Dwellings (A B C & D)


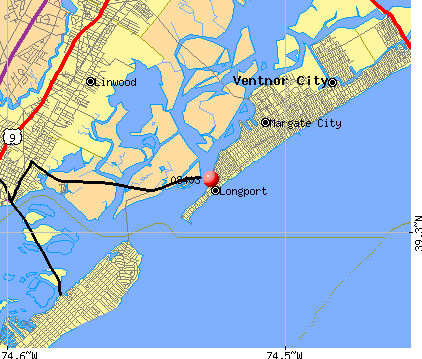 Nearest zip codes: 08221, 08402, 08244, 08225, 08406, 08232.