Estimated zip code population in 2022: 22,524 Zip code population in 2010: 22,922 Zip code population in 2000: 23,413
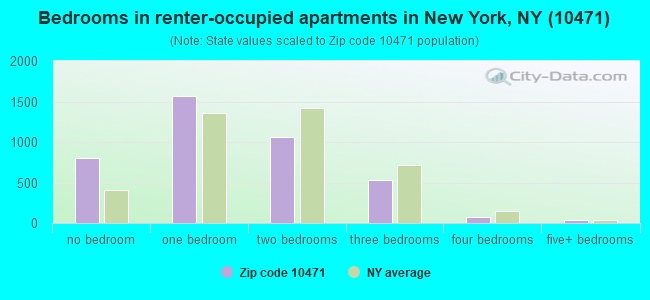
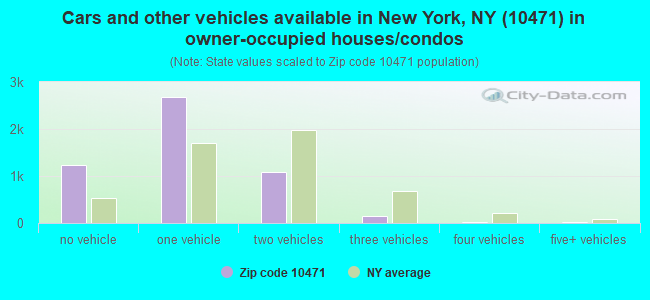
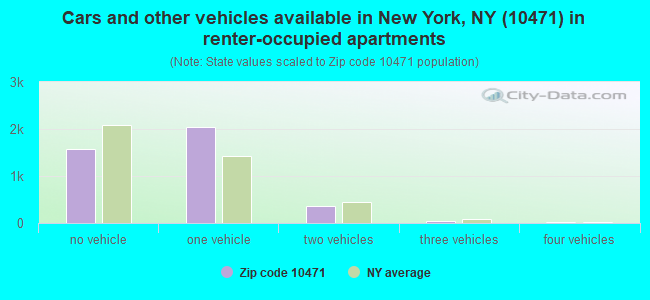
Houses and condos: 9,337 Renter-occupied apartments: 4,032
% of renters here:
44%
State:
46%
March 2022 cost of living index in zip code 10471: 142.3 (very high, U.S. average is 100)
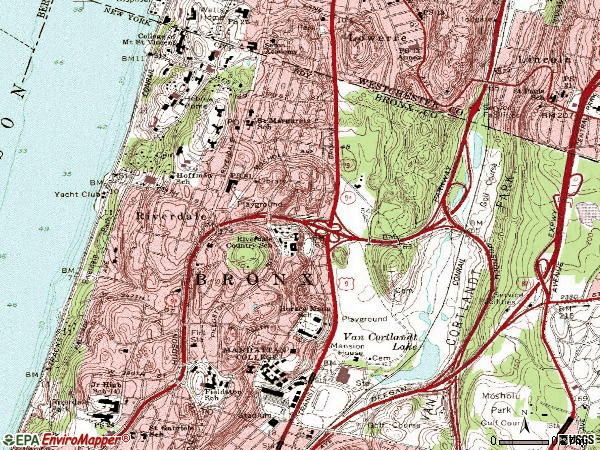
Land area: 2.6 sq. mi. Water area: 0.0 sq. mi.
Population density: 8,724 people per square mile
(high).
OSM Map
General Map
Google Map
MSN Map
OSM Map
General Map
Google Map
MSN Map
OSM Map
General Map
Google Map
MSN Map
OSM Map
General Map
Google Map
MSN Map
Please wait while loading the map...
Real estate property taxes paid for housing units in 2022:
This zip code:
1.5% ($5,711)
New York:
1.5% ($6,180)
Median real estate property taxes paid for housing units with mortgages in 2022: $6,415 (1.5%) Median real estate property taxes paid for housing units with no mortgage in 2022: $4,364 (1.2%)
Estimated median house/condo value in 2022: $387,161
10471:
$387,161
New York:
$400,400
According to our research of New York and other state lists, there were 5 registered sex offenders living in 10471 zip code as of April 23, 2024. The ratio of all residents to sex offenders in zip code 10471 is 4,382 to 1. The ratio of registered sex offenders to all residents in this zip code is much lower than the state average.
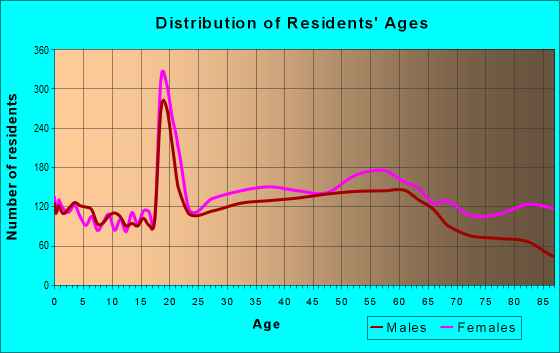
Median resident age:
This zip code:
46.6 years
New York median age:
40.0 years
Average household size:
This zip code:
2.1 people
New York:
2.5 people
Averages for the 2020 tax year for zip code 10471, filed in 2021:
Average Adjusted Gross Income (AGI) in 2020: $132,187 (Individual Income Tax Returns)
Here:
$132,187
State:
$90,930
Salary/wage: $102,005 (reported on 75.1% of returns)
Here:
$102,005
State:
$72,104
(% of AGI for various income ranges: 889.8% for AGIs below $25k, 3466.6% for AGIs $25k-50k, 6551.6% for AGIs $50k-75k, 9871.0% for AGIs $75k-100k, 17962.1% for AGIs $100k-200k, 121386.7% for AGIs over 200k)
Taxable interest for individuals: $4,711 (reported on 41.5% of returns)
This zip code:
$4,711
New York:
$3,075
(% of AGI for various income ranges: 35.2% for AGIs below $25k, 46.9% for AGIs $25k-50k, 55.9% for AGIs $50k-75k, 94.2% for AGIs $75k-100k, 225.6% for AGIs $100k-200k, 4905.0% for AGIs over 200k)
Ordinary dividends: $15,992 (reported on 31.2% of returns)
Here:
$15,992
State:
$11,095
(% of AGI for various income ranges: 78.0% for AGIs below $25k, 112.8% for AGIs $25k-50k, 183.6% for AGIs $50k-75k, 206.7% for AGIs $75k-100k, 662.0% for AGIs $100k-200k, 12190.0% for AGIs over 200k)
Net capital gain/loss in AGI: +$62,061 (reported on 28.3% of returns)
Here:
+$62,061
State:
+$44,925
(% of AGI for various income ranges: 5.0% for AGIs below $25k, 57.0% for AGIs $25k-50k, 106.9% for AGIs $50k-75k, 182.3% for AGIs $75k-100k, 733.8% for AGIs $100k-200k, 54842.0% for AGIs over 200k)
Profit/loss from business: +$22,702 (reported on 19.5% of returns)
Here:
+$22,702
State:
+$14,940
(% of AGI for various income ranges: 252.0% for AGIs below $25k, 255.7% for AGIs $25k-50k, 245.7% for AGIs $50k-75k, 374.4% for AGIs $75k-100k, 734.0% for AGIs $100k-200k, 8082.7% for AGIs over 200k)
Taxable individual retirement arrangement distribution: $22,207 (reported on 10.6% of returns)
10471:
$22,207
New York:
$19,609
(% of AGI for various income ranges: 56.4% for AGIs below $25k, 110.5% for AGIs $25k-50k, 228.2% for AGIs $50k-75k, 271.5% for AGIs $75k-100k, 749.2% for AGIs $100k-200k, 2793.7% for AGIs over 200k)
Self-employed (Keogh) retirement plans: $29,395 (reported on 2.1% of returns)
10471:
$29,395
New York:
$32,497
(% of AGI for various income ranges: 40.2% for AGIs $50k-75k, 81.0% for AGIs $100k-200k, 1610.7% for AGIs over 200k)
Total itemized deductions: $40,926 (reported on 19.2% of returns)
Here:
$40,926
State:
$39,326
(% of AGI for various income ranges: 122.3% for AGIs below $25k, 247.0% for AGIs $25k-50k, 426.3% for AGIs $50k-75k, 788.8% for AGIs $75k-100k, 1649.9% for AGIs $100k-200k, 14940.3% for AGIs over 200k)
Charity contributions: $16,909 (reported on 16.8% of returns)
Here:
$16,909
State:
$15,420
(% of AGI for various income ranges: 9.5% for AGIs below $25k, 38.4% for AGIs $25k-50k, 83.9% for AGIs $50k-75k, 124.7% for AGIs $75k-100k, 302.7% for AGIs $100k-200k, 7554.0% for AGIs over 200k)
Taxes paid: $9,028 (reported on 19.2% of returns)
10471:
$9,028
State:
$9,183
(% of AGI for various income ranges: 30.3% for AGIs below $25k, 53.4% for AGIs $25k-50k, 134.1% for AGIs $50k-75k, 292.2% for AGIs $75k-100k, 563.0% for AGIs $100k-200k, 2066.7% for AGIs over 200k)
Earned income credit: $1,792 (reported on 8.3% of returns)
Here:
$1,792
State:
$2,138
(% of AGI for various income ranges: 74.8% for AGIs below $25k, 43.5% for AGIs $25k-50k)
Percentage of individuals using paid preparers for their 2020 taxes: 93.4%
Here:
93%
State:
95%
(% for various income ranges: 91.2% for AGIs below $25k, 93.3% for AGIs $25k-50k, 94.1% for AGIs $50k-75k, 93.7% for AGIs $75k-100k, 94.0% for AGIs $100k-200k, 95.7% for AGIs over 200k)
Averages for the 2012 tax year for zip code 10471, filed in 2013:
Average Adjusted Gross Income (AGI) in 2012: $135,945 (Individual Income Tax Returns)
Here:
$135,945
State:
$77,088
Salary/wage: $90,265 (reported on 75.8% of returns)
Here:
$90,265
State:
$60,593
(% of AGI for various income ranges: 54.2% for AGIs below $25k, 73.3% for AGIs $25k-50k, 74.2% for AGIs $50k-75k, 72.3% for AGIs $75k-100k, 71.0% for AGIs $100k-200k, 35.6% for AGIs over 200k)
Taxable interest for individuals: $3,671 (reported on 50.6% of returns)
This zip code:
$3,671
New York:
$3,125
(% of AGI for various income ranges: 2.6% for AGIs below $25k, 1.3% for AGIs $25k-50k, 1.0% for AGIs $50k-75k, 0.9% for AGIs $75k-100k, 0.8% for AGIs $100k-200k, 1.6% for AGIs over 200k)
Ordinary dividends: $26,119 (reported on 33.0% of returns)
Here:
$26,119
State:
$10,299
(% of AGI for various income ranges: 5.2% for AGIs below $25k, 2.1% for AGIs $25k-50k, 1.8% for AGIs $50k-75k, 1.7% for AGIs $75k-100k, 2.3% for AGIs $100k-200k, 9.2% for AGIs over 200k)
Net capital gain/loss in AGI: +$89,077 (reported on 28.1% of returns)
Here:
+$89,077
State:
+$42,474
(% of AGI for various income ranges: 0.7% for AGIs below $25k, 0.3% for AGIs $25k-50k, 0.3% for AGIs $50k-75k, 1.1% for AGIs $75k-100k, 1.1% for AGIs $100k-200k, 30.8% for AGIs over 200k)
Profit/loss from business: +$22,361 (reported on 19.2% of returns)
Here:
+$22,361
State:
+$16,168
(% of AGI for various income ranges: 14.8% for AGIs below $25k, 4.3% for AGIs $25k-50k, 2.3% for AGIs $50k-75k, 3.2% for AGIs $75k-100k, 3.2% for AGIs $100k-200k, 2.7% for AGIs over 200k)
Taxable individual retirement arrangement distribution: $24,714 (reported on 13.4% of returns)
10471:
$24,714
New York:
$17,621
(% of AGI for various income ranges: 4.9% for AGIs below $25k, 2.3% for AGIs $25k-50k, 2.5% for AGIs $50k-75k, 3.1% for AGIs $75k-100k, 3.2% for AGIs $100k-200k, 2.0% for AGIs over 200k)
Self-employment retirement plans: $28,274 (reported on 1.9% of returns)
10471:
$28,274
New York:
$27,330
(% of AGI for various income ranges: 0.4% for AGIs $50k-75k, 0.3% for AGIs $100k-200k, 0.5% for AGIs over 200k)
Total itemized deductions: $42,933 (19% of AGI, reported on 53.5% of returns)
Here:
$42,933
State:
$34,985
Here:
19.3% of AGI
State:
21.3% of AGI
(% of AGI for various income ranges: 18.0% for AGIs below $25k, 13.8% for AGIs $25k-50k, 16.0% for AGIs $50k-75k, 18.6% for AGIs $75k-100k, 18.7% for AGIs $100k-200k, 16.4% for AGIs over 200k)
Charity contributions: $9,368 (reported on 47.3% of returns)
Here:
$9,368
State:
$5,572
(% of AGI for various income ranges: 1.0% for AGIs below $25k, 1.6% for AGIs $25k-50k, 1.9% for AGIs $50k-75k, 2.2% for AGIs $75k-100k, 2.2% for AGIs $100k-200k, 4.2% for AGIs over 200k)
Taxes paid: $23,010 (reported on 53.2% of returns)
10471:
$23,010
State:
$18,656
(% of AGI for various income ranges: 3.8% for AGIs below $25k, 4.0% for AGIs $25k-50k, 6.0% for AGIs $50k-75k, 8.2% for AGIs $75k-100k, 9.6% for AGIs $100k-200k, 9.9% for AGIs over 200k)
Earned income credit: $1,909 (reported on 8.7% of returns)
Here:
$1,909
State:
$2,230
(% of AGI for various income ranges: 4.6% for AGIs below $25k, 0.5% for AGIs $25k-50k)
Percentage of individuals using paid preparers for their 2012 taxes: 71.0%
Here:
71%
State:
66%
(% for various income ranges: 67.9% for AGIs below $25k, 67.8% for AGIs $25k-50k, 67.9% for AGIs $50k-75k, 74.2% for AGIs $75k-100k, 73.6% for AGIs $100k-200k, 81.8% for AGIs over 200k)
Averages for the 2004 tax year for zip code 10471, filed in 2005:
Average Adjusted Gross Income (AGI) in 2004: $93,039 (Individual Income Tax Returns)
Here:
$93,039
State:
$59,519
Salary/wage: $71,071 (reported on 75.7% of returns)
Here:
$71,071
State:
$50,673
(% of AGI for various income ranges: 579.2% for AGIs below $10k, 55.0% for AGIs $10k-25k, 78.1% for AGIs $25k-50k, 78.8% for AGIs $50k-75k, 74.9% for AGIs $75k-100k, 48.2% for AGIs over 100k)
Taxable interest for individuals: $3,202 (reported on 64.0% of returns)
This zip code:
$3,202
New York:
$2,377
(% of AGI for various income ranges: 121.0% for AGIs below $10k, 4.7% for AGIs $10k-25k, 2.0% for AGIs $25k-50k, 1.7% for AGIs $50k-75k, 2.1% for AGIs $75k-100k, 2.1% for AGIs over 100k)
Taxable dividends: $6,750 (reported on 39.4% of returns)
Here:
$6,750
State:
$5,394
(% of AGI for various income ranges: 103.8% for AGIs below $10k, 5.1% for AGIs $10k-25k, 2.0% for AGIs $25k-50k, 1.5% for AGIs $50k-75k, 2.0% for AGIs $75k-100k, 3.1% for AGIs over 100k)
Net capital gain/loss: +$38,098 (reported on 31.3% of returns)
Here:
+$38,098
State:
+$23,581
(% of AGI for various income ranges: 71.6% for AGIs below $10k, 0.8% for AGIs $10k-25k, 0.4% for AGIs $25k-50k, 0.5% for AGIs $50k-75k, 1.2% for AGIs $75k-100k, 18.9% for AGIs over 100k)
Profit/loss from business: +$19,716 (reported on 18.1% of returns)
Here:
+$19,716
State:
+$13,809
(% of AGI for various income ranges: 138.1% for AGIs below $10k, 10.7% for AGIs $10k-25k, 3.7% for AGIs $25k-50k, 2.5% for AGIs $50k-75k, 2.3% for AGIs $75k-100k, 3.9% for AGIs over 100k)
IRA payment deduction: $3,419 (reported on 3.2% of returns)
10471:
$3,419
New York:
$3,115
(% of AGI for various income ranges: 4.4% for AGIs below $10k, 0.4% for AGIs $10k-25k, 0.4% for AGIs $25k-50k, 0.2% for AGIs $50k-75k, 0.2% for AGIs $75k-100k, 0.0% for AGIs over 100k)
Self-employed pension: $19,938 (reported on 2.5% of returns)
Here:
$19,938
New York:
$19,016
(% of AGI for various income ranges: 0.2% for AGIs $25k-50k, 0.2% for AGIs $50k-75k, 0.2% for AGIs $75k-100k, 0.7% for AGIs over 100k)
Total itemized deductions: $34,520 (23% of AGI, reported on 53.7% of returns)
Here:
$34,520
State:
$25,864
Here:
23.0% of AGI
State:
21.9% of AGI
(% of AGI for various income ranges: 147.4% for AGIs below $10k, 16.4% for AGIs $10k-25k, 16.1% for AGIs $25k-50k, 19.2% for AGIs $50k-75k, 18.9% for AGIs $75k-100k, 20.7% for AGIs over 100k)
Charity contributions deductions: $6,577 (4% of AGI, reported on 50.2% of returns)
Here:
$6,577
State:
$4,439
Here:
4.5% of AGI
State:
3.6% of AGI
(% of AGI for various income ranges: 9.4% for AGIs below $10k, 1.8% for AGIs $10k-25k, 2.4% for AGIs $25k-50k, 2.7% for AGIs $50k-75k, 2.8% for AGIs $75k-100k, 4.0% for AGIs over 100k)
Total tax: $18,802 (reported on 84.6% of returns)
10471:
$18,802
State:
$11,730
(% of AGI for various income ranges: 39.5% for AGIs below $10k, 5.0% for AGIs $10k-25k, 8.3% for AGIs $25k-50k, 11.1% for AGIs $50k-75k, 12.5% for AGIs $75k-100k, 20.5% for AGIs over 100k)
Earned income credit: $1,508 (reported on 6.2% of returns)
Here:
$1,508
State:
$1,757
Percentage of individuals using paid preparers for their 2004 taxes: 71.0%
Here:
71%
State:
67%
(% for various income ranges: 65.4% for AGIs below $10k, 70.2% for AGIs $10k-25k, 67.6% for AGIs $25k-50k, 71.8% for AGIs $50k-75k, 71.9% for AGIs $75k-100k, 78.7% for AGIs over 100k)
Likely homosexual households (counted as self-reported same-sex unmarried-partner households)
Lesbian couples: 0.0% of all households
Gay men: 0.3% of all households
Household received Food Stamps/SNAP in the past 12 months: 612 Household did not receive Food Stamps/SNAP in the past 12 months: 8,408
Women who had a birth in the past 12 months: 282 (233 now married, 47 unmarried) Women who did not have a birth in the past 12 months: 4,445 (1,523 now married, 2,926 unmarried)
Housing units in zip code 10471 with a mortgage: 2,636 (183 second mortgage, 163 both second mortgage and home equity loan) Houses without a mortgage: 31
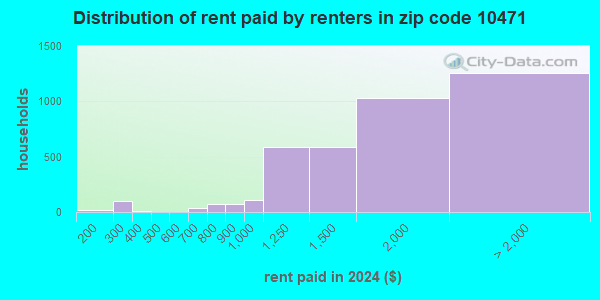
Median monthly owner costs for units with a mortgage: $2,050 Median monthly owner costs for units without a mortgage: $612
Residents with income below the poverty level in 2022:
This zip code:
7.5%
Whole state:
14.3%
Residents with income below 50% of the poverty level in 2022:
This zip code:
3.7%
Whole state:
6.8%
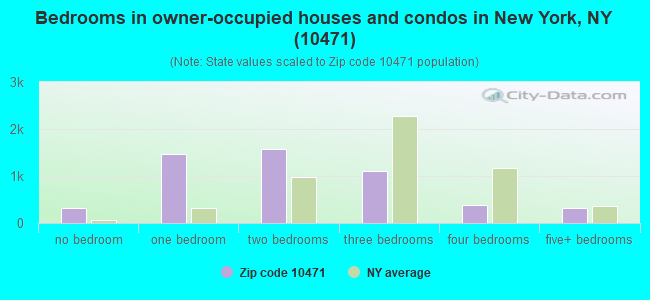
Median number of rooms in houses and condos:
Here:
4.4
State:
6.3
Median number of rooms in apartments:
Here:
3.4
State:
3.8
Notable locations in this zip code not listed on our city pages
Notable locations in zip code 10471: Twohundredfortieth Street Sub-Station (A), Van Cortlandt Golf Course (B), Chapel Farm (C), Riverdale Station (D), Van Cortlandt Stadium (E), Riverdale Yacht Club (F), Riverdale Branch New York Public Library (G), Van Cortlandt Mansion Museum (H), Henry Ittleson Center for Child Research (I), Greyston Conference Center (J), Fieldston Hill (K), Alumni Hall (L), Cardinal Hayes Library (M), Christian Brothers Center (N), Chrysostom (O), De La Salle Hall (P), Draddy Gymnasium (Q), Hayden Hall (R), Jasper Hall (S), Lavelle Hall (T). Display/hide their locations on the map
Churches in zip code 10471 include: Christ Episcopal Church (A), Conservative Synagogue of Riverdale (B), Monastery of the Visitation (C), Riverdale Presbyterian Church (D), Riverdale Temple (E), Saint Margarets Roman Catholic Church (F), Convent of Sisters of Visitation (G). Display/hide their locations on the map
Parks in zip code 10471 include: Sheridan Triangle (1), Riverdale Historic District (2), Riverdale Park (3), Gaelic Park (4), Lower Forecourt (5), Upper Forecourt (6), Bell Tower Park (7), Brust Park (8), Frank S Hackett Park (9). Display/hide their locations on the map
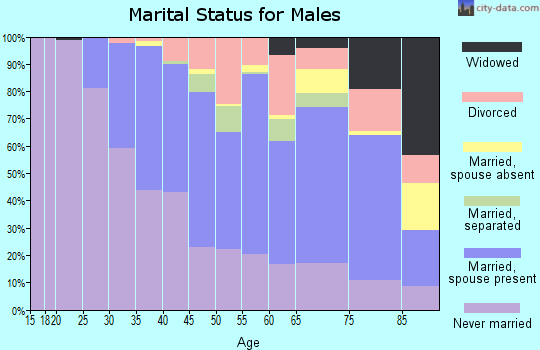
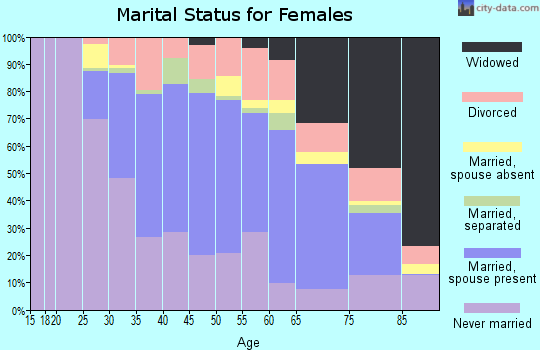
2,858 married couples with children.
671 single-parent households (339 men, 332 women).
67.6% of residents of 10471 zip code speak English at home.
21.1% of residents speak Spanish at home (72% very well, 14% well, 10% not well, 4% not at all).
7.4% of residents speak other Indo-European language at home (62% very well, 27% well, 10% not well, 1% not at all).
1.9% of residents speak Asian or Pacific Island language at home (62% very well, 22% well, 12% not well, 3% not at all).
2.5% of residents speak other language at home (86% very well, 8% well, 5% not well, 1% not at all).
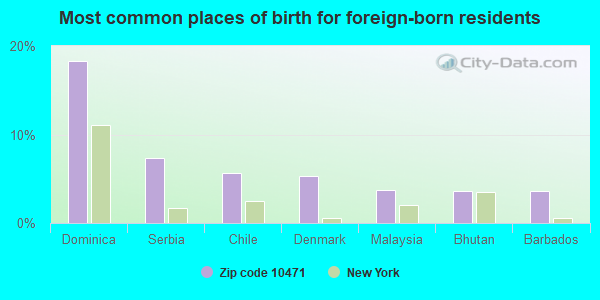
Foreign born population: 4,514 (20.0%) (70.4% of them are naturalized citizens)
This zip code:
20.0%
Whole state:
22.7%
18%Dominica
7%Serbia
6%Chile
5%Denmark
4%Malaysia
4%Bhutan
4%Barbados
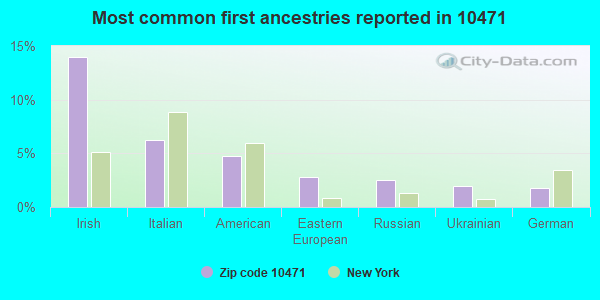
14%Irish
6%Italian
5%American
3%Eastern European
2%Russian
2%Ukrainian
2%German
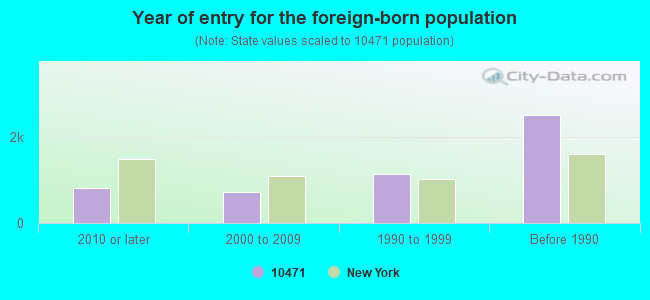
Year of entry for the foreign-born population
8202010 or later
7232000 to 2009
1,1321990 to 1999
2,505Before 1990
Major facilities with environmental interests located in this zip code:
HJB CORP-GETTY #331 (6571 BROADWAY in BRONX, NY)
AIR MINOR (AIRS/AFS) STATE MASTER (New York facility tracking) - AIR PROGRAM, STATE MASTER (New York facility tracking) - AIR PROGRAM (Resource Conservation and Recovery Act (tracking hazardous waste)) Business SIC classification: GASOLINE SERVICE STATIONS Organizations: LEEMILTS PETROLEUM INC (LEGALLY RESPONSIBLE PARTY)
Alternative names: GETTY PETROLEUM CORP, LEEMILTS-HJB CORP GETTY #331
ALL BROADWAY CLEANERS (6201 BROADWAY in BRONX, NY)
AIR MINOR (AIRS/AFS) STATE MASTER (New York facility tracking) - AIR PROGRAM Conditionally Exempt Small Quantity Generators, less than 100 kg/month of hazardous waste (Resource Conservation and Recovery Act (tracking hazardous waste)) - notification Business SIC classification: DRYCLEANING PLANTS, EXCEPT RUG CLEANING Organizations: OLIVER ODANAL - HOD REALTY CORP (CONTACT/OWNER)
, ALL BROADWAY DRYCLEANING & LAUNDRY INC (LEGALLY RESPONSIBLE PARTY)
, NOAH DRY CLEANERS CORP (LEGALLY RESPONSIBLE PARTY)
Alternative names: ALL BROADWAY DRYCLEANING & LAUNDRY
COLLEGE OF MOUNT SAINT VINCENT (6301 RIVERDALE AVE in BRONX, NY)
(Resource Conservation and Recovery Act (tracking hazardous waste)) - ICIS-, ENFORCEMENT/COMPLIANCE ACTIVITY Small Quantity Generators, between 100 kg and 1000 kg of hazardous waste/month (Resource Conservation and Recovery Act (tracking hazardous waste)) Organizations: DELTA ENVIRONMENTAL INC (CONTACT/OPERATOR)
5800 ARLINGTON AVENUE BUILDING (5800 ARLINGTON AVENUE in BRONX, NY)
AIR MINOR (AIRS/AFS) STATE MASTER (New York facility tracking) - AIR PROGRAM Business SIC classification: OPERATORS OF APARTMENT BUILDINGS Business NAICS classification: LESSORS OF RESIDENTIAL BUILDINGS AND DWELLINGS. Organizations: SKYVIEW OWNERS CORP (LEGALLY RESPONSIBLE PARTY)
5552 NETHERLAND AVENUE BUILDING (5552 NETHERLAND AVENUE in BRONX, NY)
AIR SYNTHETIC MINOR (AIRS/AFS) STATE MASTER (New York facility tracking) - AIR PROGRAM Business SIC classification: OPERATORS OF DWELLINGS OTHER THAN APARTMENT BUILDINGS Business NAICS classification: LESSORS OF RESIDENTIAL BUILDINGS AND DWELLINGS. Organizations: AXELROD MANAGEMENT CORP (LEGALLY RESPONSIBLE PARTY)
, RIVERDALE GARDENS INC (LEGALLY RESPONSIBLE PARTY)
HEBREW HOME FOR THE AGED AT RIVERDALE (5901 PALISADE AVENUE in BRONX, NY)
AIR SYNTHETIC MINOR (AIRS/AFS) STATE MASTER (New York facility tracking) - AIR PROGRAM, CRITERIA AND HAZARDOUS AIR POLLUTANT INVENTORY (Inventory of air pollution sources) Business SIC classification: CORRUGATED AND SOLID FIBER BOXES; OPERATORS OF DWELLINGS OTHER THAN APARTMENT BUILDINGS Business NAICS classification: LESSORS OF RESIDENTIAL BUILDINGS AND DWELLINGS.
3950 BLACKSTONE AVENUE BUILDING (3950 BLACKSTONE AVENUE in BRONX, NY)
AIR SYNTHETIC MINOR (AIRS/AFS) STATE MASTER (New York facility tracking) - AIR PROGRAM Business SIC classification: OPERATORS OF APARTMENT BUILDINGS Business NAICS classification: LESSORS OF RESIDENTIAL BUILDINGS AND DWELLINGS. Organizations: 3950 BLACKSTONE ASSOCIATES (LEGALLY RESPONSIBLE PARTY)
Alternative names: WEINREB MANAGEMENT
CON ED - MH 446 (E/S BWAY 56 NNC W 259TH ST in BRONX, NY)
HAZARDOUS WASTE BIENNIAL REPORTER (Resource Conservation and Recovery Act (tracking hazardous waste)) (Resource Conservation and Recovery Act (tracking hazardous waste))
CON ED - V 4235 (MANHATTAN COLLEGE PKWY in BRONX, NY)
HAZARDOUS WASTE BIENNIAL REPORTER (Resource Conservation and Recovery Act (tracking hazardous waste)) (Resource Conservation and Recovery Act (tracking hazardous waste))
CON ED - VS 1065 (W 259 ST & W BROADWAY in BRONX, NY)
HAZARDOUS WASTE BIENNIAL REPORTER (Resource Conservation and Recovery Act (tracking hazardous waste)) (Resource Conservation and Recovery Act (tracking hazardous waste))
CON ED-MH 1749 (E/S BROADWAY 200' S/O W 234 ST in BRONX, NY)
HAZARDOUS WASTE BIENNIAL REPORTER (Resource Conservation and Recovery Act (tracking hazardous waste)) (Resource Conservation and Recovery Act (tracking hazardous waste))
CON ED-V3335 (W 246TH ST & POST RD in BRONX, NY)
HAZARDOUS WASTE BIENNIAL REPORTER (Resource Conservation and Recovery Act (tracking hazardous waste)) (Resource Conservation and Recovery Act (tracking hazardous waste))
GUND GEOFFREY RESIDENCE (690 W 247TH ST in BRONX, NY)
(Resource Conservation and Recovery Act (tracking hazardous waste))
Housing units lacking complete plumbing facilities: 0.4% Housing units lacking complete kitchen facilities: 1.6%
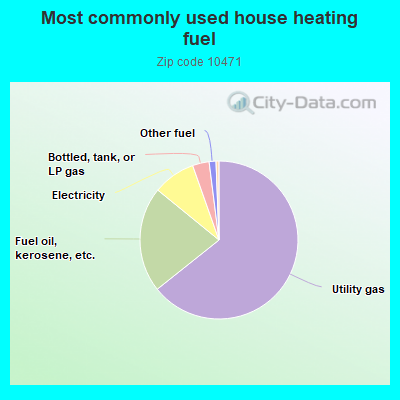
64.3%Utility gas
21.6%Fuel oil, kerosene, etc.
8.7%Electricity
3.4%Bottled, tank, or LP gas
1.4%Other fuel
0.6%No fuel used
Population in 1990: 23,348. Population change in the 1990s: +65 (+0.3%).
Place of birth for U.S.-born residents:
This state: 14,053
Northeast: 1,235
Midwest: 490
South: 845
West: 603
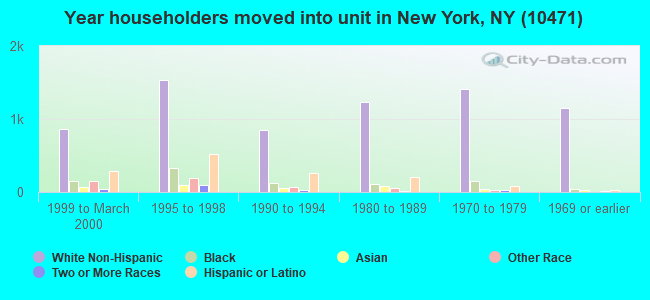
61% of the 10471 zip code residents lived in the same house 5 years ago. Out of people who lived in different houses, 46% lived in this county. Out of people who lived in different counties, 50% lived in New York.
90% of the 10471 zip code residents lived in the same house 1 year ago. Out of people who lived in different houses, 38% moved from this county. Out of people who lived in different houses, 52% moved from different county within same state. Out of people who lived in different houses, 7% moved from different state. Out of people who lived in different houses, 3% moved from abroad.
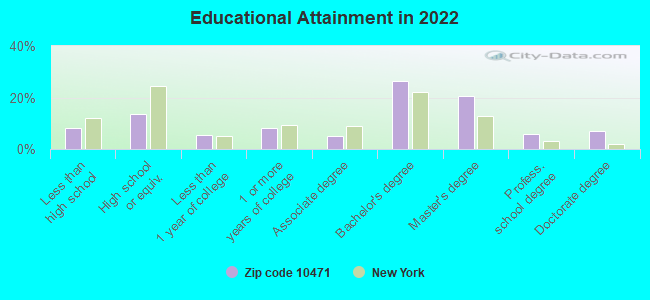
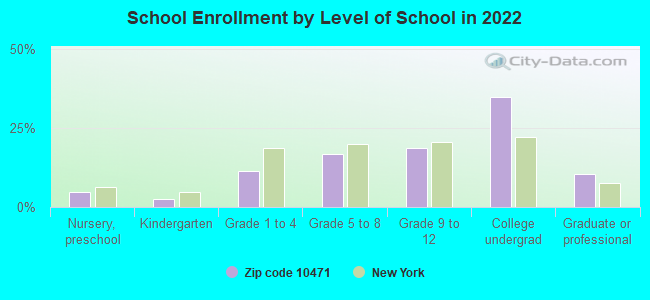
Private vs. public school enrollment:
Students in private schools in grades 1 to 8 (elementary and middle school): 783
Here:
47.2%
New York:
15.6%
Students in private schools in grades 9 to 12 (high school): 296
Here:
27.1%
New York:
15.0%
Students in private undergraduate colleges: 1,478
Here:
71.4%
New York:
39.2%
Occupation by median earnings in the past 12 months ($)
189,281Legal occupations
156,366Computer and mathematical occupations
155,244Law enforcement workers including supervisors
130,517Health diagnosing and treating practitioners and other technical occupations
111,436Management occupations
109,404Architecture and engineering occupations
Top industries in this zip code by the number of employees in 2005:
Educational Services: Colleges, Universities, and Professional Schools (over 1000 employees: 1 establishment, 500-999 employees: 1 establishment)
Health Care and Social Assistance: Nursing Care Facilities (over 1000: 1, 100-249: 2, 20-49: 1)
Other Services (except Public Administration): Religious Organizations (100-249: 1, 20-49: 3, 10-19: 2, 5-9: 2, 1-4: 5)
Health Care and Social Assistance: Other Individual and Family Services (100-249: 1, 20-49: 1, 10-19: 1, 5-9: 1)
Accommodation and Food Services: Food Service Contractors (100-249: 1, 5-9: 1, 1-4: 6)
Other Services (except Public Administration): Other Similar Organizations (except Business, Professional, Labor, and Political Organizations) (50-99: 1, 10-19: 1, 5-9: 2, 1-4: 14)
Health Care and Social Assistance: Child Day Care Services (20-49: 2, 10-19: 3, 1-4: 4)
Health Care and Social Assistance: Residential Mental Retardation Facilities (20-49: 3, 5-9: 1)
2007 - 2018 National Fire Incident Reporting System (NFIRS) incidents
Based on the data from the years 2007 - 2018 the average number of fire incidents per year is 94. The highest number of reported fires - 124 took place in 2017, and the least - 36 in 2007. The data has an increasing trend.
When looking into fire subcategories, the most incidents belonged to: Structure Fires (75.2%), and Outside Fires (15.5%).
Fire incident types reported to NFIRS in Zip Code 10471
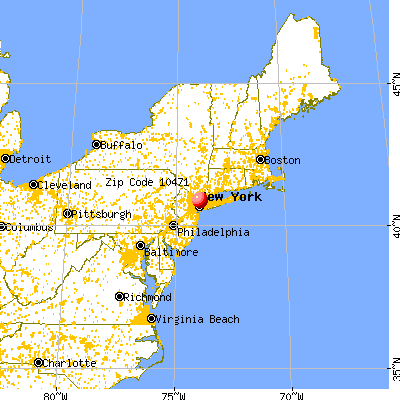


 Nearest zip codes: 10463, 10705, 10468, 10470, 10034, 10458.


 Based on the data from the years 2007 - 2018 the average number of fire incidents per year is 94. The highest number of reported fires - 124 took place in 2017, and the least - 36 in 2007. The data has an increasing trend.
 When looking into fire subcategories, the most incidents belonged to: Structure Fires (75.2%), and Outside Fires (15.5%).